Analysis of secular and contemporary displacement
Tide gauge observations
Tide gauges provide very short to secular records of the elevation of the free surface of the oceans, approximately corresponding to the geoid, relative to the solid surface of the Earth. Relative sea level variations, defined by the offset between these two surfaces, are evolving according to a wide spectrum of spatio-temporal scales. Due to the memory effects of mantle minerals, GIA is still operating today in form of slow crustal deformations and gravity field variations, whose combination result in a smooth, long-wavelength pattern of relative sea level change. Conversely to the GIA signal, long- to short-term tectonics-related vertical movements of the crust result in regional to local scale spatially heterogeneous relative sea level changes. Separating these two distinct signals from the tide gauges record demands an accurate modelling of GIA and long enough time series (> 50 years) in order to filter out the short term sea level oscillations related to waves, currents and tides (climatology, oceanography and astronomical forcing).
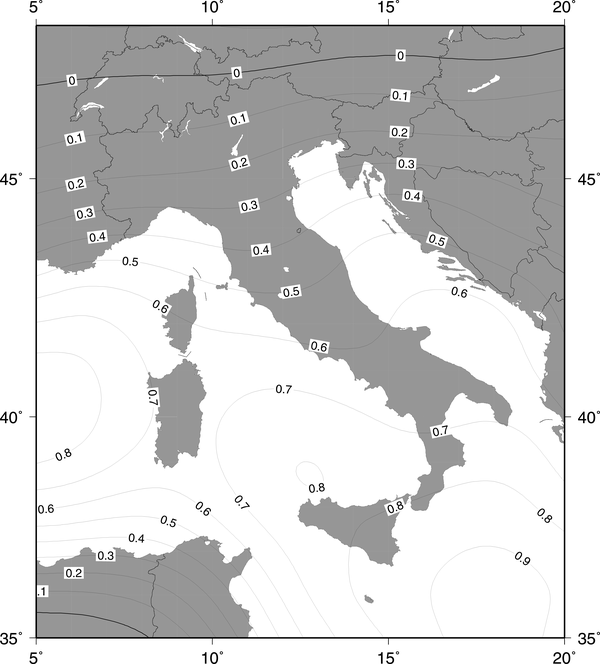
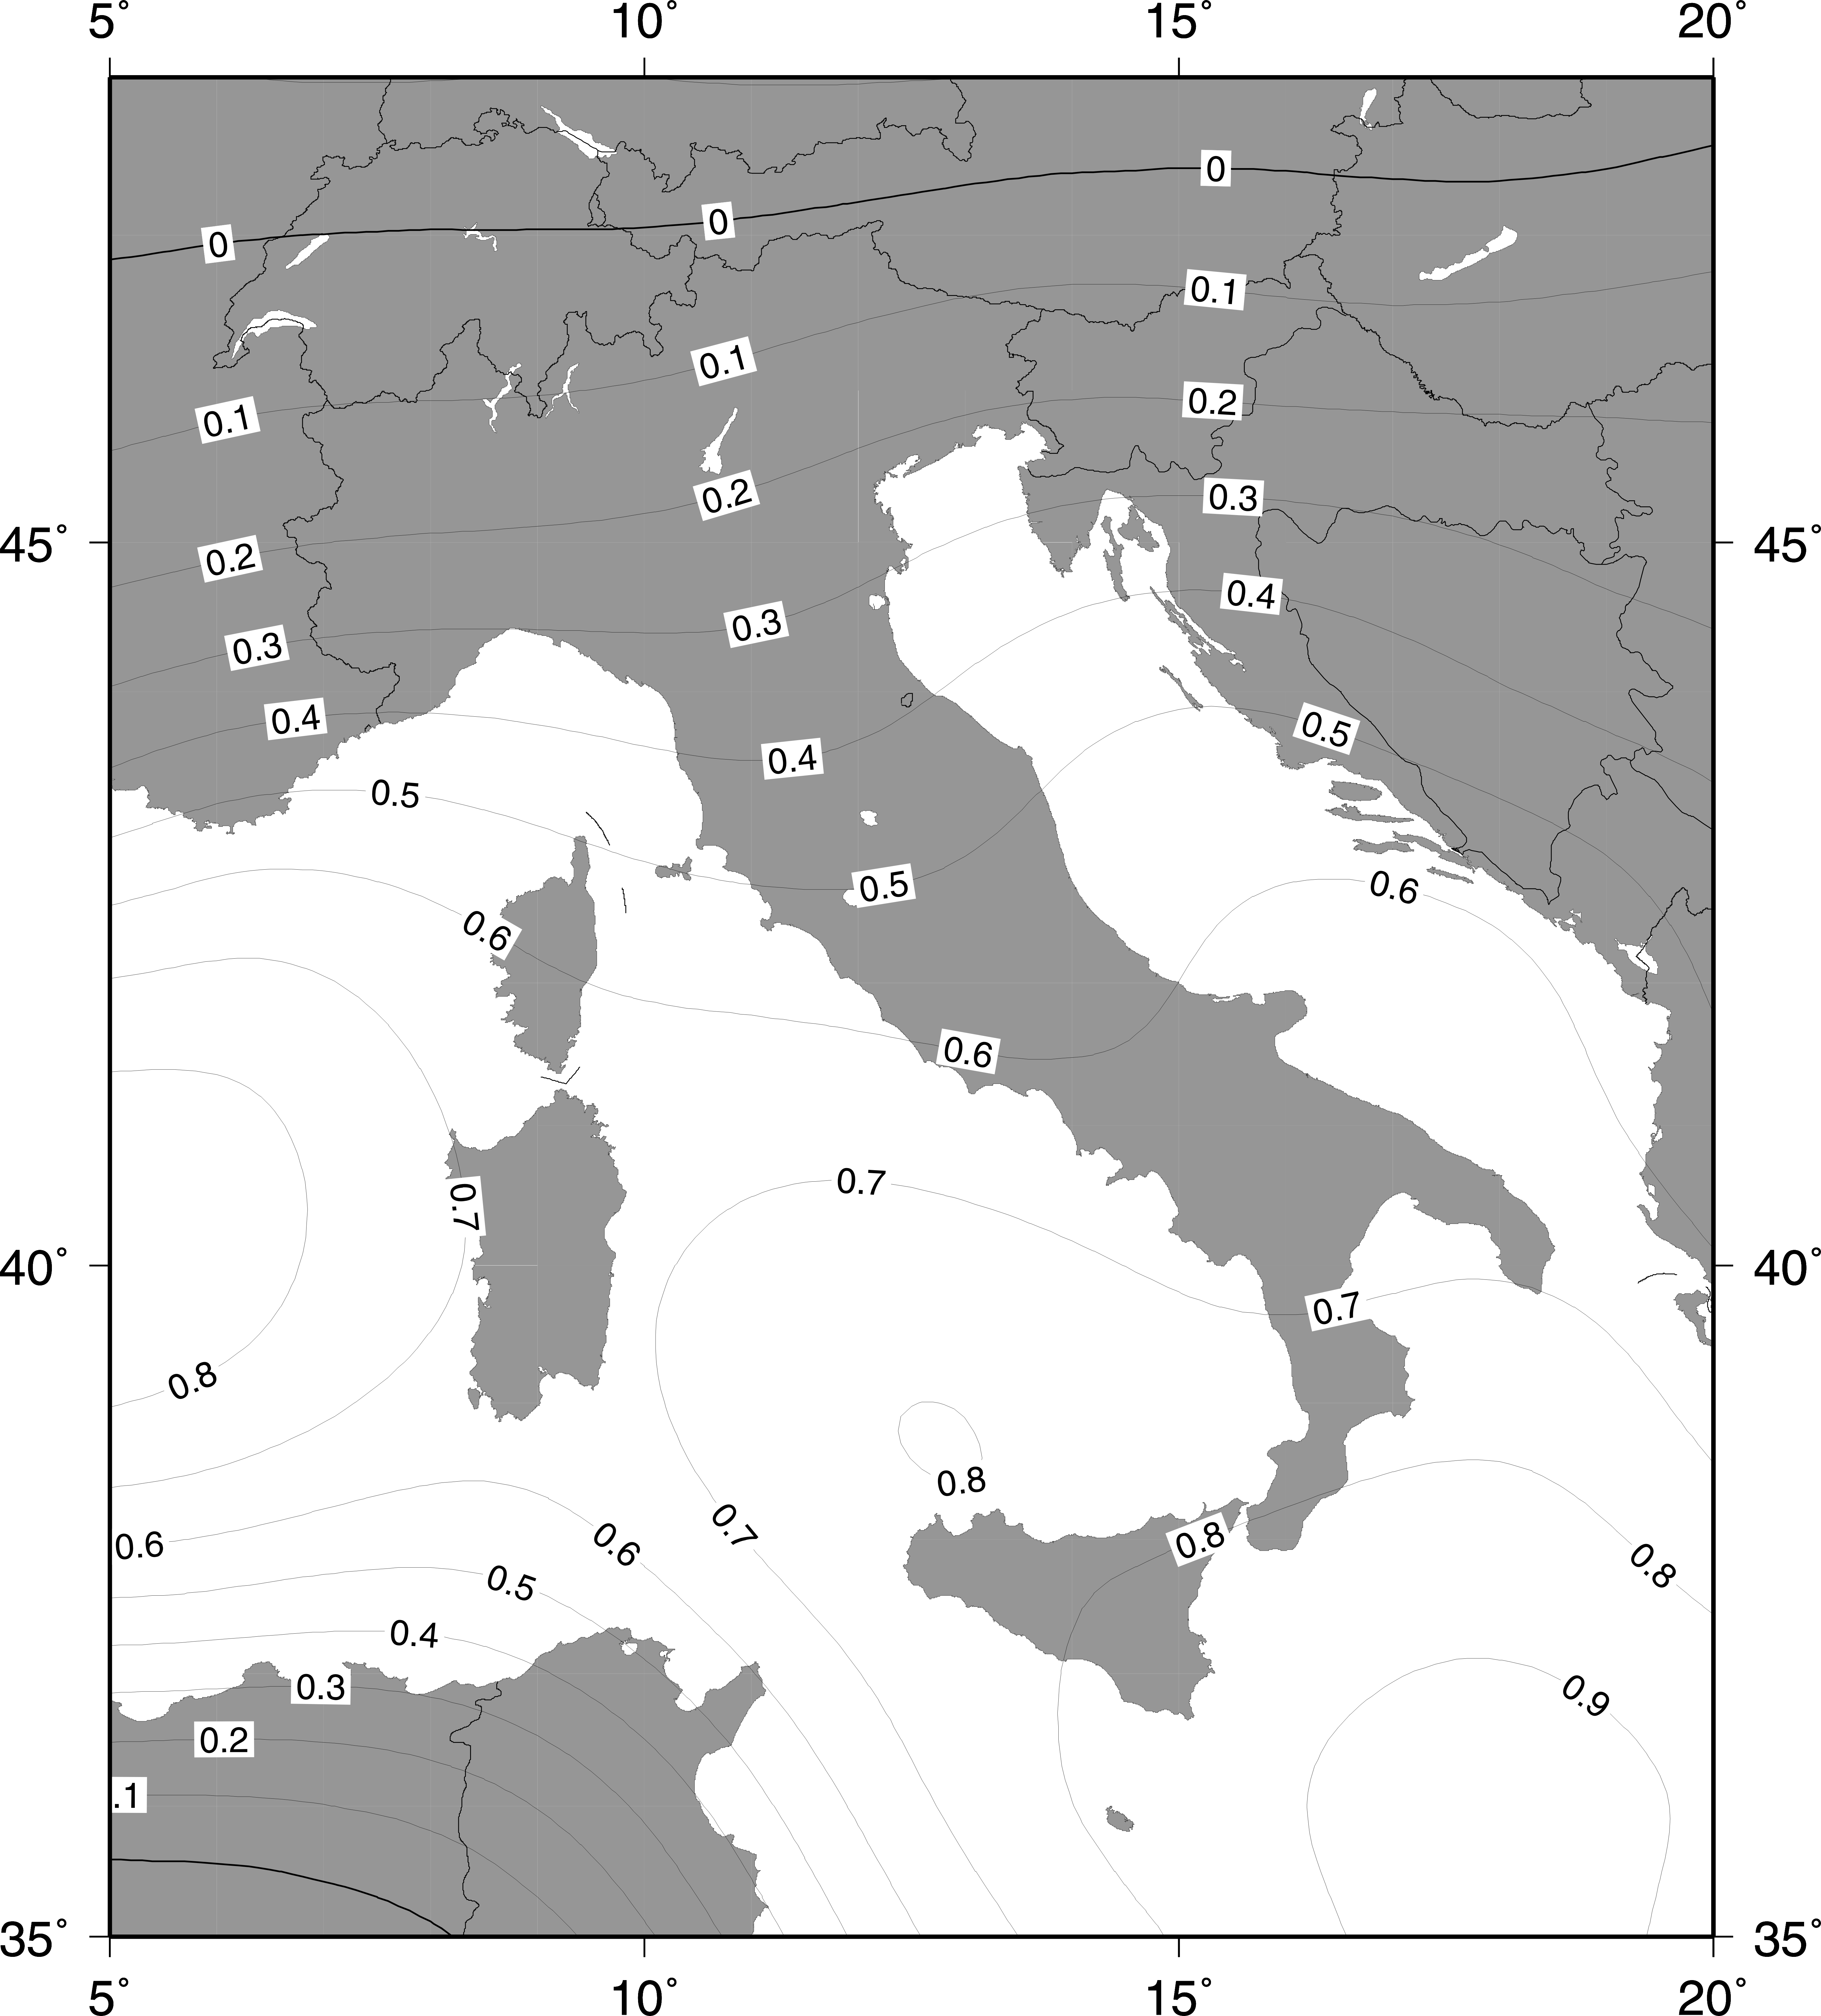
Recent GIA modelling results have shown that the GIA signal in the Mediterranean sea is mainly driven by the melt-water loading which results in a subsidence localized in the bulk of the basin (Ionian Sea, western Tyrrhenian Sea) and radially decreasing towards the coastlines (Lambeck et al., 2004; 2011; Stocchi and Spada, 2009). Fig. 10 show the predicted GIA-related rate of relative sea level change according to a refined version of the Stocchi and Spada (2009) model. Different predictions are achieved using the Lambeck et al. (2011) model; analysis of the different input observations and parameters, as well as prediction results of the two models, are beyond the scope of the present paper. Besides the original papers, the reader is referred to Antonioli et al. (2009) for a comparison of the models.
Inspection of Fig. 10 shows that the coasts of France and northern Italy (Liguria and northern Adriatic) are affected by the subsidence driven by the collapse of the forebulge related to the Fennoscandian ice sheet. To a lesser extent the coasts of Liguria and northern Adriatic may experience the response to the melting of the Würm Alpine ice cap which results in a weak land uplift counteracting the subsidence induced by the meltwater from the far field ice sheets (Stocchi et al., 2005; Spada et al., 2009). In this context the Italian peninsula, given its geographical position and elongated shape, is affected by a GIA-related rate of relative sea level rise which increases with decreasing latitudes (Fig. 10), reaching its maximum values in southern Calabria and around Sicily and Sardinia islands (Lambeck et al., 2004; 2011; Stocchi et al., 2009).
In the ideal case of a dense coastal coverage of tide gauges recording secular time-series, the comparison between a reasonable GIA model and the observed rates of relative sea level change would be a straightforward method to detect the tectonics-related signal along the coasts of Italy. The freely available time series for the Italian coastlines are provided by the Permanent Service for the Mean Sea Level (http://www.pol.ac.uk/psmsl). Figure 11 shows the stations and their rates of relative sea level change considered in this study. The rates have been derived from the Revised Local Reference (RLR) annual means time series. Unfortunately only the tide gauges of Genova, Venezia and Trieste have recorded time series longer than 70 years. These three Italian stations, combined with the French tide gauge of Marseille, which has recorded the longest time series in the Mediterranean (108 years), are only representative of the relatively small longitudinal area from the northern Tyrrhenian sea to the northern Adriatic sea. While Marseille, Genova and Trieste share the same rate of RSL change of +1.2 mm/yr, Venezia is affected by a stronger local subsidence which results in a 2.4 mm/yr rate of relative sea level rise. Such a higher rate testifies a very localized combination of natural and anthropogenic forcing (Antonioli et al., 2009; Buble et al., 2010).
Figure 11. Tide gauges and rates.
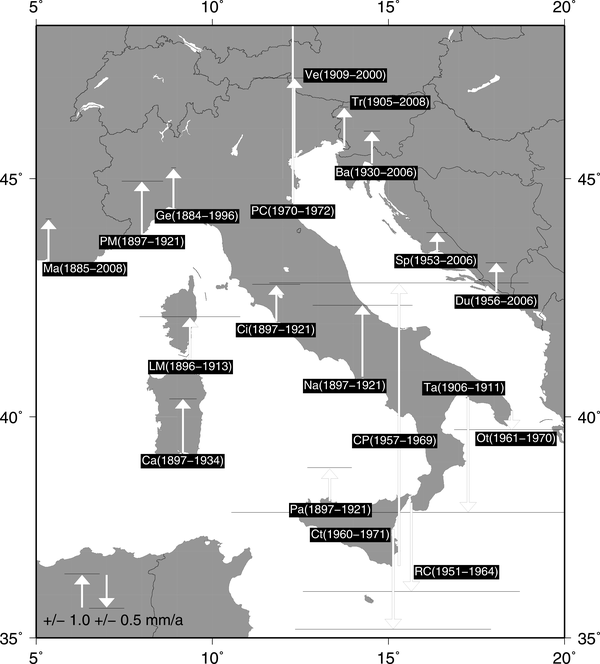
Tide gauges location and rates (RLR) from PSMSL record (http://www.pol.ac.uk/psmsl).
The remaining Italian tide gauges have not recorded continuous time series longer than 30 years and make therefore necessary a type of approach based on the analysis of differential rates of relative sea level change for common time spans. However, by benchmarking the RSL recorded at different stations for a common period to a station located on a geologically stable block, we can derive reasonably accurate quantitative estimates of crustal deformation at these sites.
1897-1921 time interval data.
The first time interval considered for analysis of differential rates of RSL change for common time spans is 1897-1921 and is only representative of the Tyrrhenian and Ligurian Sea. Figure 12a shows the observed rates of relative sea level change (black squares and solid line) and the predicted GIA-related rates (white triangles and dashed line) lined clockwise from Marseille (Ma) to Cagliari (Ca), and piercing through Porto Maurizio (PM) in Liguria, Civitavecchia (Ci) and Naples (Na) in the eastern Tyrrhenian margin, Palermo (Pa) in the southern Tyrrhenian margin and Catania (Ct) in the Ionian Sea. For the tide gauge of Catania, the rate has been derived from the available metric time series. The increase of subsidence from the North (Marseille) to the South (Catania and Palermo) predicted by the GIA model is also broadly observed by the tide gauges which all share positive values of RSL change. Tide gauge data, however, are significantly scattered in space when compared to the smooth GIA signal. It is noticeable the opposite trend among the observed and predicted rates along the baseline from Naples (Na) to Cagliari (Ca). In particular the stations of Catania (Ct) and Palermo (Pa), where the GIA subsidence is expected to be the highest (Fig. 12a), show comparable rates of relative sea level rise (+ 0.9 mm/yr), and lower than Civitavecchia (Ci). As pointed out by Antonioli et al. (2009), Palermo and Catania are therefore well correlated.
By removing the GIA signal from the observed rates and then by referring each station to Cagliari (reference station), it is possible to better appreciate the local contribution to vertical coastal motion affecting the tide gauges (Fig. 12b). Cagliari, as analysis of intermediate- to short term markers indicates (see section 5.1), lies on the tectonically stable block of southern Sardinia, and therefore differential rates to this station, once skimmed of the GIA component, can be taken as reliable estimates of absolute vertical motion along individual baselines.
The differential rate of -0.8 mm/yr obtained at Marseille (Ma), especially when compared to the slightly positive value obtained at Porto Maurizio (PM), indicates mild uplift. The -0.32 mm/yr differential rate found at Civitavecchia (Ci) appears in striking agreement with the ~0.2 mm/yr uplift rate suggested by the LIg marker (see section 5.3; Fig. 5). Likewise, the positive differential rate of 0.55 mm/yr computed at Naples is consistent, within uncertainty, with the ~1 mm/yr Holocene subsidence rate (see section 5.4; Fig. 6). The differential rates of -0.92 mm/yr and -0.81 mm/yr found respectively at Catania and Palermo testify current uplift affecting Sicily (see section 5.5; Fig. 7).
Figure 12. Tide-gauge data, 1897-1921.
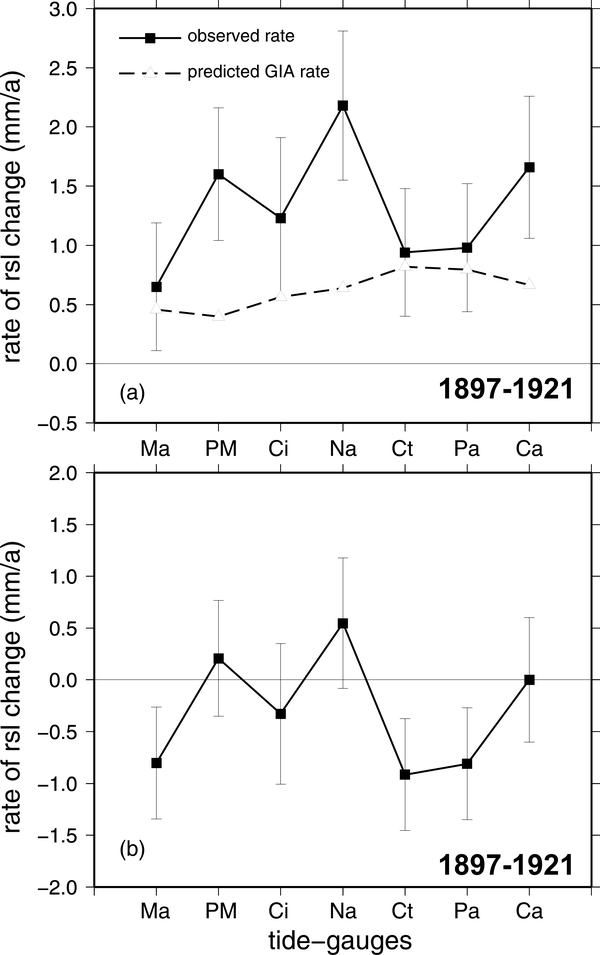
Tide-gauge data for time interval 1897-1921: (a) Observed vs GIA; (b) GIA-detrended data IA referenced to Cagliari (Ca).
1951-1964 time interval data.
A similar analysis is performed for the time interval 1951-1964 for fewer stations (Fig. 13) spanning from the Ligurian Sea (Marseille, Ma; and Genova, Ge) directly south to the Messina Strait (station Reggio Calabria, RC) and up to the Adriatic Sea (Trieste, Tr). For this time interval, a rate of RSL change of -2.7 mm/yr is recorded at Reggio Calabria (RC), while positive values of +2.53, +1.74, and +0.94 mm/yr are observed respectively at the reference station of Genova (Ge), Marseille (Ma) and Trieste (Tr), as shown in Figures 13a and 13b. For the analyzed cluster, we fix the station Genova (Ge). Although LIg and Holocene data are not available at this site, it rests on a region of very weak geological motion, if any (Fig. 4). Note, however, that the RSL rate at Ge for this time interval is twofold the long-trend (+1.2 mm/yr) rate, and thus differential rates computed for the 1951-1964 time interval results higher. When the GIA component is removed, we observe uplift of Marseille (Ma) at 1.25 mm/yr, a finding comparable to the 1897-1921 dataset within uncertainty. Whereas large uplift of up to ~6 mm/yr is found at RC, Trieste has a lesser uplift.
Figure 13. Tide-gauge data, 1951-1964.
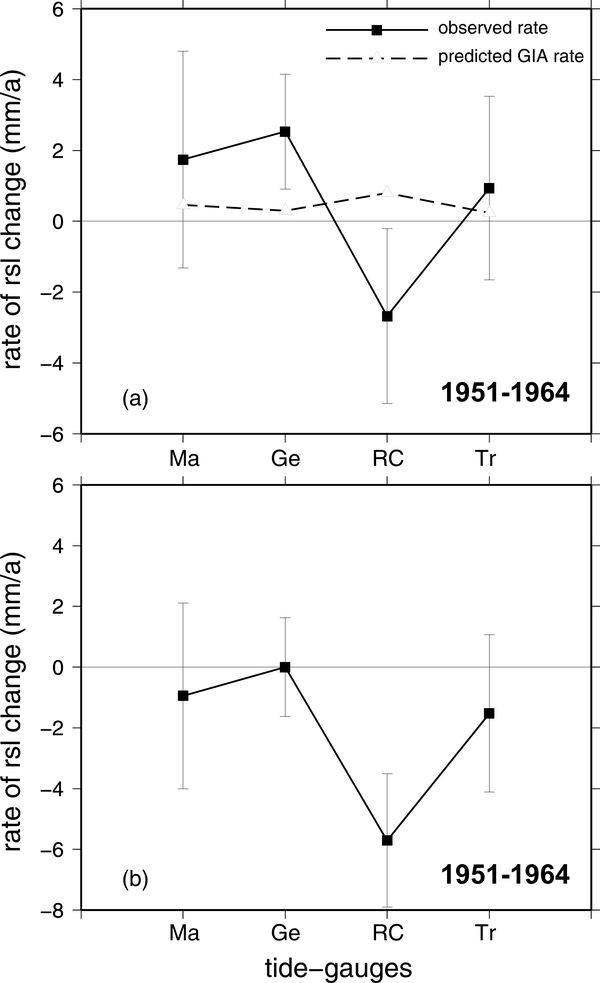
Tide-gauge data for time interval 1951-1964: (a) Observed vs GIA; (b) GIA-detrended data referenced to Genova (Ge).
1957-1969 and 1960-1971 time interval data.
The third time interval considered in this study is 1957-1969, for which the tide gauge of Capo Passero (SE Sicily) shows a surprisingly high rate sea level rise of +8.54 mm/yr (Fig. 14). Also in this case the station of Genova is chosen as reference (Fig. 14a, b). Once purified from the GIA contribution and referenced to Genova, the Adriatic tide gauges of Trieste, Split and Dubrovnik show a good correlation, which suggests a relative tectonic stability. Bakar (Ba) instead could be affected by a localized uplift. Marseille and Capo Passero show two opposite differential rates of -6.0 mm/yr and +6.0 mm/yr respectively, which indicate localized uplift and subsidence, although the magnitude appears severely biased by unknown processes.
Figure 14. Tide-gauge data, 1957-1969.

Tide-gauge data for time interval 1957-1969: (a) Observed vs GIA; (b) GIA-detrended data referenced to Genova (Ge)
The time interval 1960-1971 is characterized by negative rates of RSL change at all the tide gauges taken into account (Fig. 15a). A maximum value of sea level fall of -3.0 mm/yr is observed at Catania (Ct). By referencing the GIA-filtered rates to the station of Genova, both the stability of Trieste, Split and Dubrovnik, and the uplift at Bakar, Marseille and Catania are confirmed. The latter is well correlated with the apparent uplift found for the time interval 1897-1921, when the tide gauge of Cagliari has been used as reference station.
Figure 15. Tide-gauge data, 1960-1971.
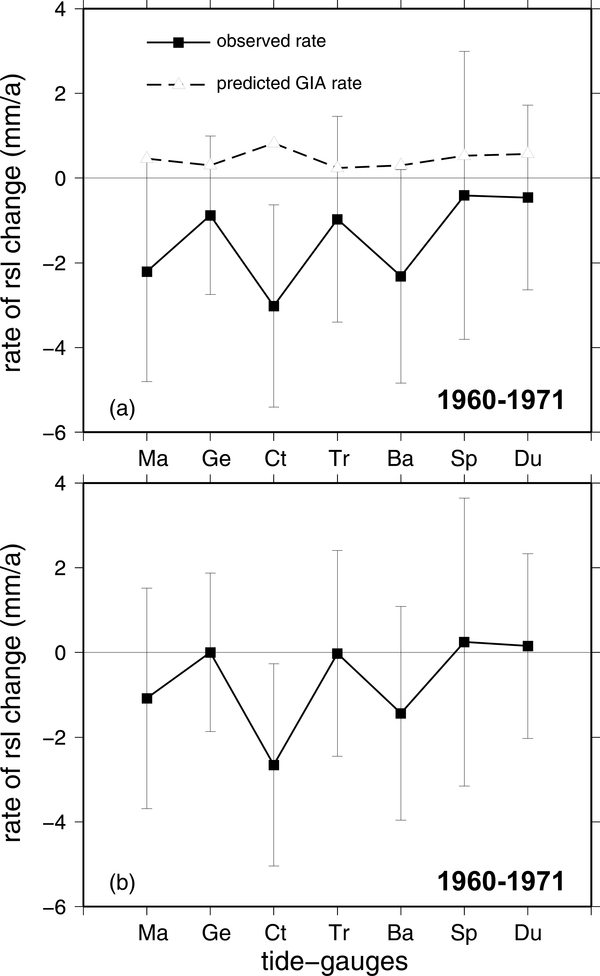
Tide-gauge data for time interval 1960-1971: (a) Observed vs GIA; b) GIA-detrended data referenced to Genova (Ge)
1955-2000 time interval data.
We comment here on the data presented by Antonioli et al. (2009) for Northern Adriatic stations Trieste (Tr), Venice (Ve) in Italy and Rovinj (Ro) and Bakar (Ba) in Slovenia for a common time span between 1955 and 2006 (Fig. 16). Venice has a greater sea-level rise (0.8±0.3 mm/yr) with respect to Trieste (0.5±0.3 mm/yr), indicative of its recent subsidence. The latter shows a slightly higher rate relative to Rovinj (0.3±0.3 mm/yr) and Bakar (0.2±0.3 mm/yr) stations.
Figure 16. Tide-gauge data, 1955-2000.
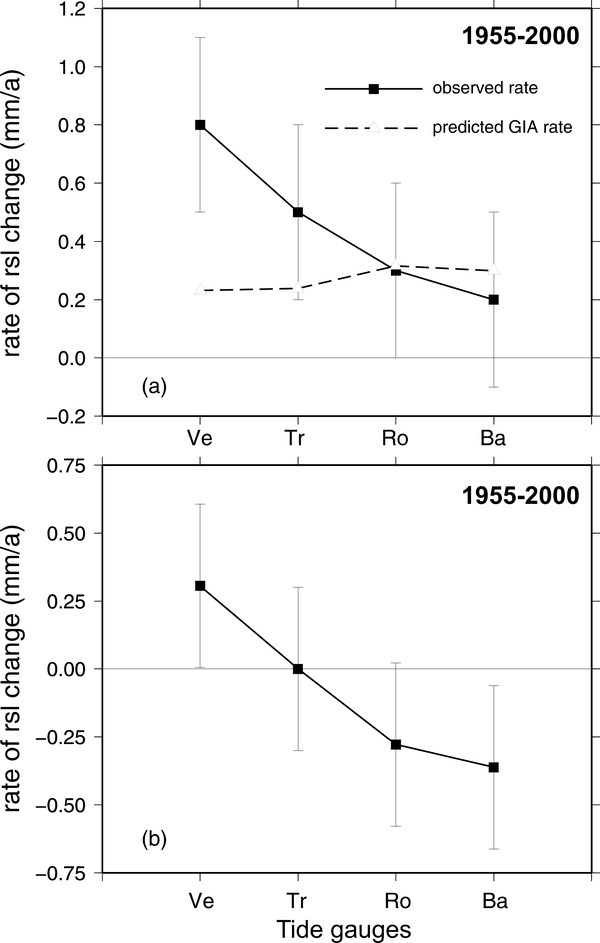
Tide-gauge data for time interval 1955-2000: (a) Observed vs GIA; b) GIA-detrended data referenced to Trieste (Tr)
1999-2008 time interval data.
Figure 17. Tide-gauge data, 1999-2008.
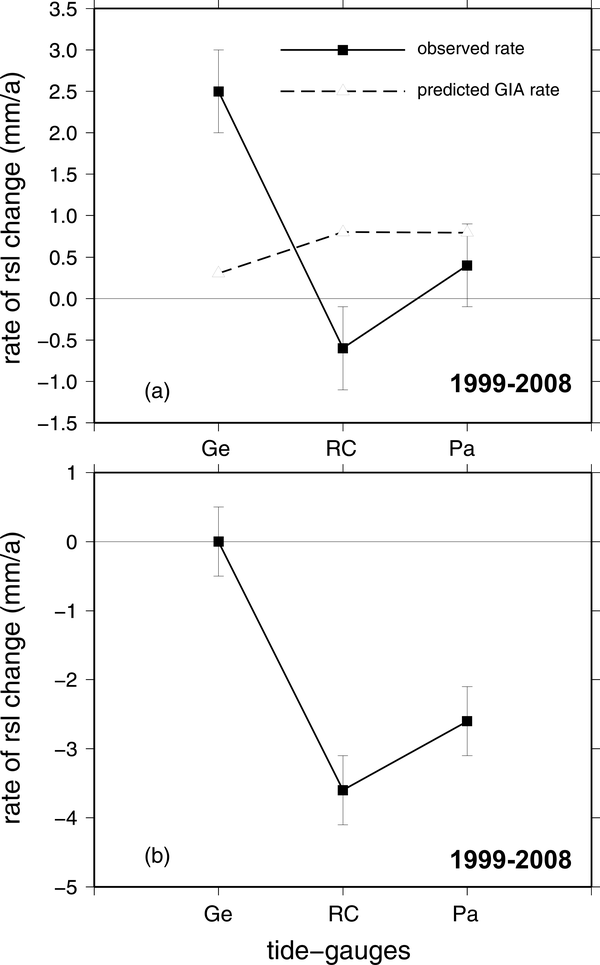
Tide-gauge data for time interval 1999-2008 (ISPRA record, http://www.apat.gov.it/site/it-IT): (a) Observed vs GIA; b) GIA-detrended data referenced to Genova (Ge).
Antonioli et al. (2009), using the 1999-2008 mareographic records provided by ISPRA (Istituto Superiore per la Protezione e la Ricerca Ambientale, http://www.apat.gov.it/site/it-IT), show a rate of RSL change of -0.6±0.5 mm/yr at Reggio Calabria, while positive values of 0.4±0.5 mm/yr and 2.5±0.5 mm/yr are found at Palermo and Genova, respectively (Fig. 17). By combining the 1999-2008 and the 1951-1964 time intervals it is apparent that the sea level fall recorded at Reggio Calabria is driven by a long-term uplift reasonably related to tectonics. The differential rate across baseline RC-Ge in the 1999-2008 data (detrended form the GIA component) is ~3.6 mm/yr, probably a more accurate estimate of the tectonic rate than the 1951-1964 dataset.
Uplift reasonably influences the tide gauge at Palermo (western Sicily), which, for both 1897-1921 (Fig. 12) and 1999-2008 (Fig. 17) time intervals, shows a positive rate well below those measured respectively at the reference stations of Cagliari and Genova. In the 1999-2008 data, the differential rate between Pa and Ge is 2.1 mm/yr, and when the GIA component is removed, relative uplift of Pa to Ge is up to 2.6 mm/yr. Furthermore, because the GIA component is broadly equal at RC and Pa (Fig. 10), their differential rate of ~1 mm/yr in the 1999-2008 dataset is more accurately indicative of the tectonic rate gradient across the Messina Strait and Sicily.
Summary.
Tide-gauges measurements for stations with a sufficiently long time series to allow at least computations of differential rates, once the GIA component is removed, indicate consistent pattern of tectonic motion due to regional or local processes. The western Liguria sea margin in southern France (Marseille, Me) appears uplifting relative to the Italian sector (Porto Maurizio and Genova stations) at an average rate of ~1 mm/yr, a finding in agreement with the localized uplift found by Bennett and Hreisendóttir (2007) relative to a local reference frame.
In the eastern Tyrrhenian margin, relative to the stable Cagliari station, Civitavecchia (Ci) and Naples (Na) are uplifting and subsiding, respectively (1897-1921), at rates strikingly similar to the LIg and Holocene rates (Figs. 5, 6).
In southern Calabria and eastern Sicily, stations show uplift relative to quasi-stable Cagliari which is large at Reggio Calabria and lesser (~0.9 mm/yr, 1897-1921 interval) at Catania, the latter in noticeable agreement with the computed 1 mm/yr Holocene rate (Fig. 8a). Northern Sicily (Pa) is uplifting relative to Sardinia (Ca) and Liguria (Ge) at 0.8 mm/yr (1897-1921 dataset) and ~2.6 mm/yr (1999-2008 ISPRA dataset), respectively (Figs. 12, 17). Similarly, uplift of Catania relative to Genova is 2.7 mm/yr (1960-1971), whereas in the ISPRA 1999-2008 dataset, the integrated uplift of baseline RC to Ge is ~3.6 mm/yr. These data are consistent with largest uplift segregated in the Messina Strait (RC), and with a gradient of ~1 mm/yr relative to both Sicilian stations Catania and Palermo.
Whereas secular uplift at Catania and Reggio Calabria are no surprise as manifestation of the ongoing Calabrian Arc dynamics (see section 5.5), the uplift observed at Palermo merits further investigation in light of the quasi-stability or weak uplift afforded at nearby locations by LIg data (Fig. 7). Although few Holocene data exist for north-western Sicily, the close proximity of station Pa to the uplifting site of Marettimo (1.2 mm/yr), and the relatively short baseline between Palermo and the benchmark site of Cagliari (1897-1921 dataset), might indicate a recent, significant uplift of northwest Sicily.
Uplift might also be recorded in the Ionian Sea tide gauge data. Albeit quantitative calculations are not possible due to the short time record and the lack of a common time span, we note that stations Taranto (Ta) and Otranto (Ot) in Apulia region have recorded negative rates of RSL change during their operation life (Fig. 11), in a manner reminiscent of the uplift recorded by LIg markers (Fig. 9).
In contrast to the south of Italy, no significant difference is observed between sites located along the Croatian coast and Trieste between 1957-69 and 1960-1971 (although Bakar has a little uplift of few mm/yr relative to Trieste both in the above time spans and, together with Rovinij, in the 1955-2000 dataset). This findings is consistent with the observation that current seismological deformation is accommodated inland along the Dinarid axis (Fig. 2). The north-western Adriatic shore (Venice) has a weak (0.3 mm/yr) subsidence relative to Trieste during 1955-2000 (Fig. 16), but over the longer time span of between 1905-1970, differential subsidence increases to 1.8 mm/yr. As observed by Antonioli et al. (2009), the longer dataset records anthropogenic effects, which were reduced or halted after 1970; thus the 1955-2000 rate can be taken as truly tectonics, in light of the good agreement with the 0.4-0.7 mm/yr Holocene rates (see section 5.9; Fig. 4).
GPS observations
Determination of the vertical component of Earth’s current crustal velocity field using the Global Positioning System (GPS) is a challenging goal for the estimation of the vertical tectonic rates. This is important for the study of seismic and volcanic regions but it becomes crucial for coastal application. Since the beginning, GPS has revealed its uncertainty in the height component and this is an important issue in studying RSL changes, when GPS height of the benchmark is used for defining an absolute sea level datum. Some international initiatives have aimed to co-locate GPS and tide gauges to cope with these geodetic topics and measure sea level and land motion through these integrated stations (Schöne et al., 2009; http://adsc.gfz-potsdam.de/tiga/index_TIGA.html). Vertical crustal motion is difficult to measure using satellite geodesy for several reasons. Among the others, the main important are technical (accuracy of the satellites orbits, phase center of GPS antennas, multipath, etc.), site effects (i.e. geological or monument instability, soil compaction, etc.), physical (i.e. atmospheric and ionosphere delay), and geodetic (i.e. stability of the chosen reference frame, center of mass of the Earth, etc.). The amount of these signals can result in vertical positioning bias. Additionally, the contribution of scale change to vertical error is an important source of uncertainty compared with tectonic rates which can be of order 1 mm/yr or less. Hence, tectonic interpretation of space geodetic measurements of vertical movements requires careful attention, especially along the coasts when tide gauge data are compared with GPS data, as the former instruments provide a continuous measure of the sea level with respect to the “fixed” land to which are anchored.
The central Mediterranean region has been recently investigated for the existent relationships between vertical crustal motion and sea level change (Bennett and Hreinsdóttir, 2007; Stocchi et al., 2007; Buble at al., 2010) using the long-record tie gauges (see above chapter), and continuously recording GPS (CGPS) stations. These stations are part of networks in operation since five or more years belonging to different agencies (Réseau National GPS, RENAG; RING network managed by the Italian INGV; GPS Network of the Italian Space Agency; EUREF Permanent GPS Network - EPN, and/or International GNSS Service (IGS), and are sometimes located along the coastal regions. The available long GPS time series for these stations allows for precise determination of vertical rates with respect to the geocentric reference frame with typical theoretical (i.e., “formal”) rate uncertainty of ≤0.1 mm/yr.
Data analysis centers generally use different software (see Devoti et al., this volume), to process data from hundreds of stations located in the Euro-Mediterranean and African area and combine regional and global solutions from SOPAC (http://sopac.ucsd.edu). The final positions are computed in the IGS reference frames and velocities are estimated from the time series after removing jumps due to stations equipment changes (or co-seismic offsets) and the seasonal signals (with annual and semi-annual period). Uncertainties are estimated and reduced adopting noise models (as white+colored error noise model), to produce a self-consistent and homogeneous three-dimensional velocity field and estimates of vertical land movements. Notwithstanding, the GPS reference frame stability still remains un unresolved issue. To mitigate this problem, Altamimi et al. (2007) proposed a correction to the vertical rate of 1.8 sin(latitude) mm/year.
Bennett and Hreinsdóttir (2007) assessed the precision of GPS-determined vertical rate estimates for the central Mediterranean area, using at least 5 yr of GPS data, compared with independent constraints derived from the altitudes of Holocene and late Pleistocene shorelines, tide gauge records, and sea level changes measured by satellite altimetry. They found an average formal uncertainties of 0.08 mm/yr, thus 3 to 5 times smaller than the precision they determined through comparison of GPS with independent measures of surface uplift. They found in the GPS data uplift at several sites along the southern French coast, with short-wavelength spatial variation possibly related to GIA. They conclude that some of the observed difference was certainly associated with errors in rate estimates determined from shoreline data (imperfect corrections for the effects of glacial isostatic adjustment) and un-modeled variation of crustal motion through time.
Buble et al. (2010) have used observations from tide gauges and co-located continuous GPS (CGPS) stations to investigate the relationships between crustal deformation and sea level changes along the eastern margin of the Adriatic Sea. They tentatively separated the signal pertaining to absolute sea level and crustal motions with respect to a local Central Mediterranean–fixed GPS-defined reference frame. The tide gauge data indicated a consistent, mean sea level rise of 0.84 ± 0.04 mm/yr, 2-4 times lower than the global average. Conversely, they found a variable rate of the vertical motion of the land, as determined by CGPS, from -1.7 ± 0.4 to 0.0 ± 0.4 mm/yr in southern and northern Adria, respectively. They attributed this difference in crustal motion to an active thrust fault, which in the south accommodates the convergence of the Adria microplate with Europe (Fig. 1). The combination of tide gauge and CGPS measurements shows that absolute sea level relative to the GPS-determined reference frame varies of ~1.8 mm/yr along the Croatian coast producing a roughly constant sea level in this region. This result is in agreement with Antonioli et al. (2007) who point out the tectonic contribution to the relative sea level changes estimated for the northeastern Adriatic sea, based on archaeological and geological observations and modeling analysis.
Stocchi et al. (2009) compared for the Italian Region the tide gauge and GPS signals and tentatively defined the upper and lower bounds of the effects of the glacial isostatic adjustment (GIA) on current sea level variations and vertical movements along the coasts of Italy. At specific sites, where tide gauges and GPS stations are operating, the analyses found an agreement between the two data set: where land is down-lifting, local relative sea level is rising.
Anyway, as estimated in Bennett and Hreinsdóttir (2007), Buble et al. (2010) and Devoti et al. (this volume), the vertical rates of crustal motion as determined by CGPS in Italy are small, and their estimate is dependent by the duration of the recordings. Instrumental noise, local monument and ground instabilities and the geological environment on which the geodetic stations are situated can induce additional disturbance that conceal the geophysical signal. For the above reasons, the vertical component of the crustal motion is the most difficult to achieve for the limitation of the technique. Hence, a careful site selection and long enough time series (generally >5 years) of geodetic observations are required to provide significant data, with estimates above the accuracies of the uncertainties of the technique and the chosen reference frames.
Latest results on the vertical trends of deformation for the Italian region, as depicted by data analysis of the CGPS stations (Devoti et al., this issue), show the first order vertical movements as a broad uplift of 1-5 mm/yr along the Alpine and Apennine mountain chains, diffuse subsidence in the Po river plain at up to 15 mm/yr, and near null movements for the Sardinia-Corsica block, but all with uncertainties often larger than these values. The few CGPS stations located near the coast, show null or minor movements along the vertical component (with the exception of those stations located in unstable areas, such as on the Ionian coasts near Crotone, with rapid motion at -2.70 mm/yr; or in the volcanic arc of the Aeolian islands, where they are subsiding at ~ -6 mm/yr). Notwithstanding, stations in the Calabrian Arc show uplift well above uncertainty (Devoti et al., this issue) which are in agreement with geological and secular estimates made in the present paper.
Figs. 18a and 18b show two examples of time series recordings along the vertical component at a discrete (PANA) and a continuous (TRIE) GPS station, respectively. Data from these stations show the different tectonic behavior in these two crustal segments. PANA is placed in the volcanic arc of the Aeolian islands (southern Italy), characterized by mild long-term uplift (0.35 mm/yr; Fig. 8a), but the contemporary record is both of subsidence and uplift. On the opposite, TRIE rests on the north Adriatic foreland plate (northern Italy), with low strain rates (Figs. 2, 4, 11). The UP velocity at TRIE is 0.26±0.07 mm/yr (Eurasia reference frame, see Devoti et al., this volume), and is strikingly consistent with the Holocene rate (Fig. 4). Similarly, the co-located tide gauge, which is continuously operating since the beginning of 19th century, provides a sea level trend of ~1.2 mm/yr, and common time-span estimate of stability or uplift relative to other site in northern Italy (see the previous chapter).

Figure 18b. GPS time series examples.
Two examples of GPS time series recordings along the vertical component: a) the discrete GPS station of Panarea (PANA) (modified from Esposito et al., 2010) and b) the GPS station of Trieste (TRIE, daily solutions). The yellow vertical lines are outliers, the red line are the average positions.