Experimental results
We present modeling results finalized to the study of the subduction, separating different aspects of the process. Here, the focus is only the physical meaning of the obtained results, and this information will be merged into a simplified global model qualitatively describing the Central Mediterranean geodynamic evolution over the last 80 Ma. It is useful to experimentally analyze the model-making process, which becomes progressively more complex to separate the contribution of single variables. In particular, our models will help with the following: a) provide an explanation of the main factors promoting subduction initiation; b) describe rapid episodic back-arc opening; c) offer a three-dimensional view of slab-induced mantle circulation; d) explain the consequences of subduction of a heterogeneous continental margin; and f) explain the opening of slab tears.
Initiation of subduction
Models simulating different configurations and rheologies of the oceanic (i.e., subducting plate) and continental (i.e., overriding plate) lithosphere have been developed to simulate feasible evolutionary scenarios for passive margins. In particular, four parameters have been tested: 1) the negative buoyancy of the subducting lithosphere (by changing the density of the silly putty); 2) the horizontal forces (by changing both the magnitude and interval of application of the horizontally pushing piston, and the density contrast between the continent and the ocean); 3) the brittle strength at passive margins; and 4) the ductile strength at passive margins (Figure 5a; see Faccenna et al. 1999 for additional details).
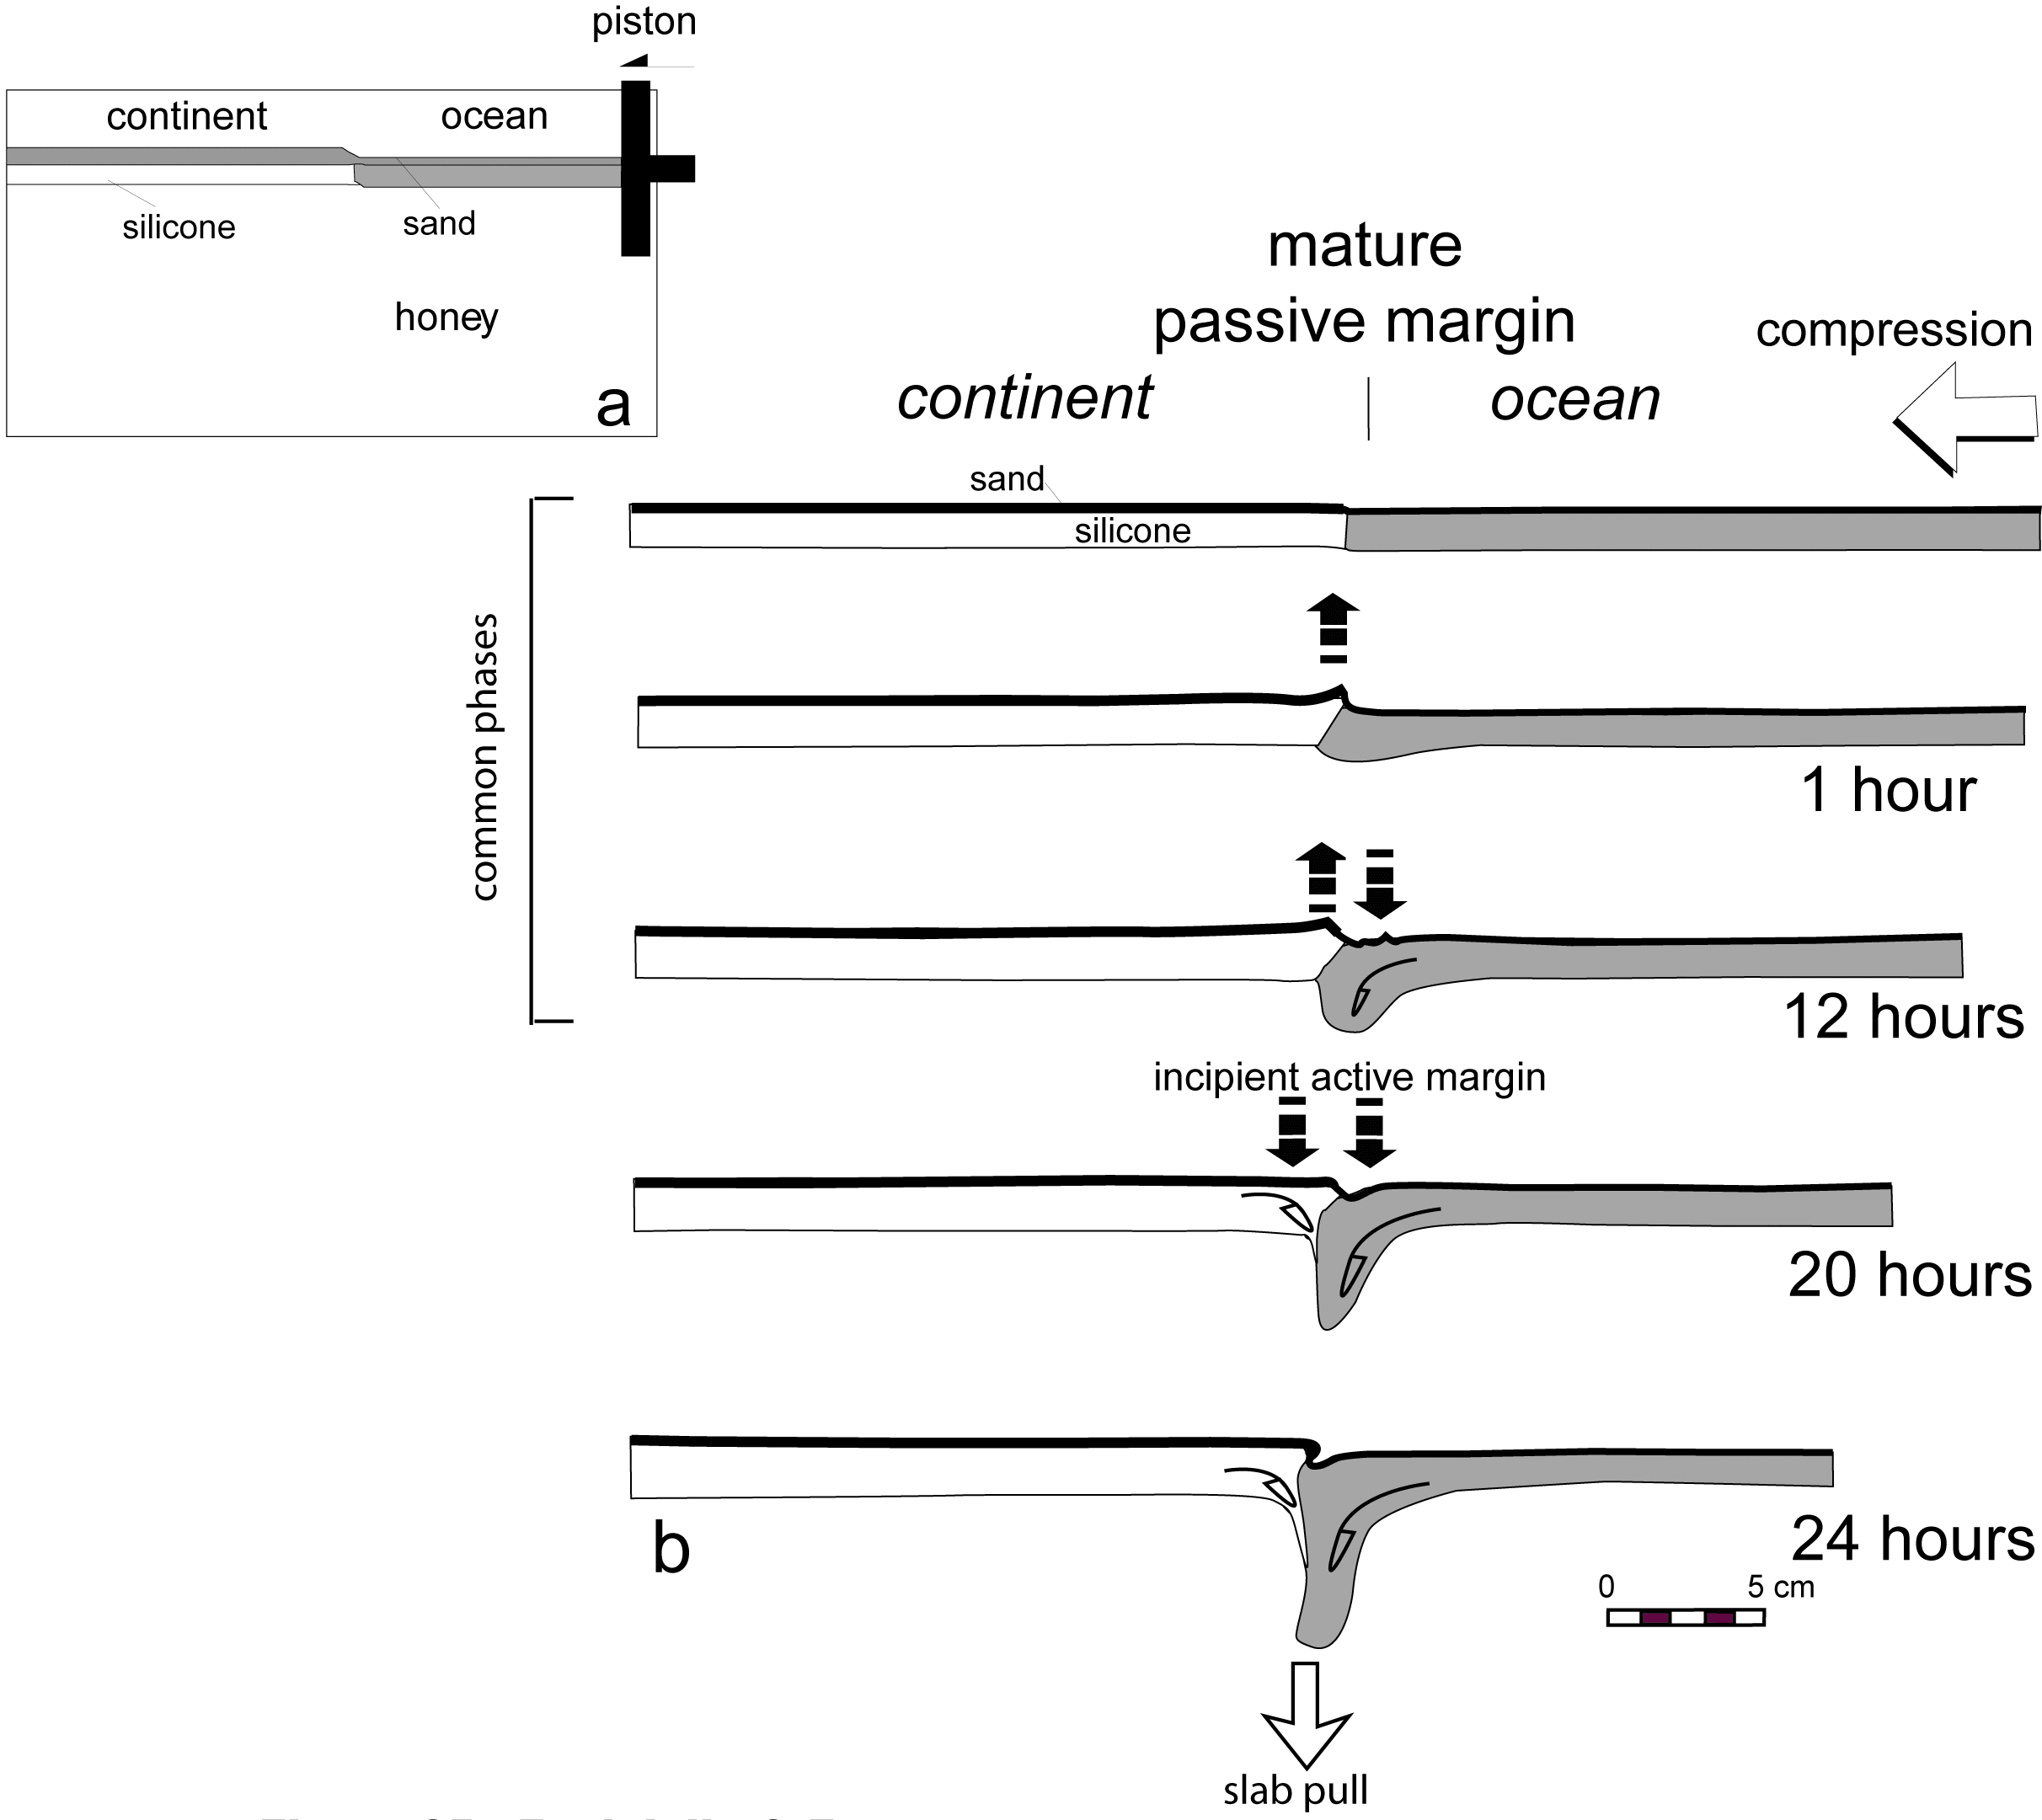
Figure 5. Modeling results of subduction initiation.
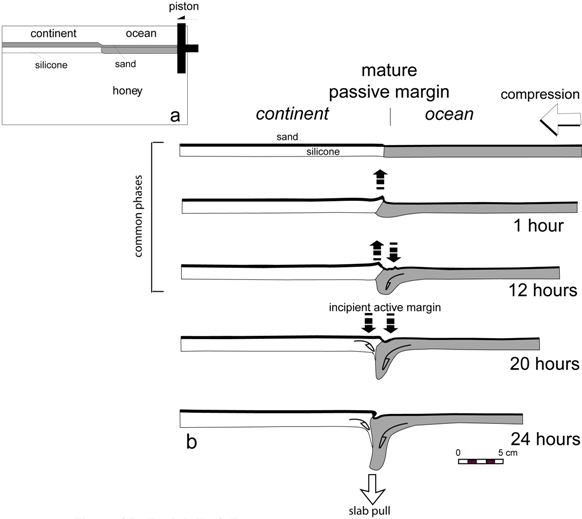
Lateral view of the experimental setup for models developed for the subduction initiation. b) Line drawing of the main evolutionary stages recognized in this set of models.
All the models share a common early behavior characterized by a rapid and localized initial uplifting of the continental plate followed by down-folding of the oceanic plate that is restricted to the passive margin zone and along the piston (Figure 5b). With an increase in shortening, the oceanic plate is affected by pervasive folding, and the passive margin undergoes bulk thickening with an indentation of the oceanic plate into the continental plate, as well as a small amount of underthrusting. Our results (see Faccenna et al., 1999 for details) indicate that either an initial low compressional strain rate (operating over geological time scales) or the pressure produced by the collapse of the continental margin is necessary to trigger the development of a small instability localized at the passive margin (i.e., Rayleigh–Taylor instability). The slow growth of the instability is initially accommodated by ductile flow in the lower lithospheric layers and driven toward the margin by horizontal forces, which are not supported by the low lithosphere strength at these depths. In the subsequent phases, the instability can evolve and only allow subduction initiation under specific conditions (Figure 5b). The negative buoyancy of the oceanic plate is, therefore, the key ingredient needed to transform a margin from passive to active. A density contrast higher than 50 kg cm –3 between the oceanic lithosphere and the underlying mantle is required to localize the compressive strain at the passive margin and to initiate self-sustained, one-sided subduction flanked by continental margin subsidence. In particular, we found that the subduction is initiated only when the negative buoyancy force overcomes the resistance offered by the ductile lithospheric level. This condition was experimentally achieved once the instability reached the length of about 2.5 cm, corresponding to about 150 km in nature. In particular, we experimentally verified that the brittle strength of the lithosphere exerts only a negligible influence on the trench nucleation when compared to the viscous strength.
In summary, the subduction initiation process described by our models is not a sudden brittle failure of a passive margin but rather a slow, continuous transition controlled by ductile flow in the lower lithosphere.
Slab into the upper mantle and interaction with the 660-km discontinuity
This section describes the models developed to study the behavior of the slab sinking into the upper mantle, and the interaction with the 660-km discontinuity (Becker et al. 1999, Funiciello et al. 2003, Funiciello et al. 2004, Bellahsen et al. 2005). First, the subduction process described in the previous section was simplified, while maintaining its usefulness, by forcing the leading edge of the lithosphere inside the mantle at a shallow dipping angle to obtain enough slab pulling force to overcome the resistance at the trench. After initiation, the slab sinks into the mantle, increasing its dip to 90o, while the trench retreats (Figure 6a, b). This process is always associated with a significant displacement of the mantle from beneath and around the slab triggered by the subducting plate (Funiciello et al. 2003, Funiciello et al. 2006). The amount of subduction, which is equal to the trench motion in this peculiar configuration characterized by a fixed incoming plate, increases exponentially with the slab length (Figure 6b). Becker et al. (1999) and Funiciello et al. (2003) found that the behavior shown in this stage is primarily controlled by the interplay between the slab pull (progressively increasing with time) and resistance related to the plate bending. However, a precise force assessment is difficult using the sole experimental approach (Funiciello et al. 2008), and slab-mantle interaction cannot be neglected as an additional contribution to the resisting force (e.g., Capitanio et al. 2007, Di Giuseppe et al. 2008, Funiciello et al. 2008, Stegman et al. 2010). The increasing rates of trench retreat favor the development of an extensional tectonic regime above the subducting lithosphere (i.e., overriding plate), which we assume is the analog of a natural back-arc opening.
After about 10 min (corresponding to about 10 Myr in nature), the slab interacted with the mantle discontinuity (Figure 6a). In this phase, the subduction slowed for a few minutes (Figure 6a, b), while the tip of the slab folded and deformed at depth. For our retreating configuration (i.e., fixed edge at the leading edge), this behavior is a direct consequence of the high viscosity layer representative of the lower mantle. Over the relatively short time scale of our model (< 100 Myr), advection inside the low viscosity layer was slow, and the slab could not directly penetrate into the lower mantle. We experimentally found that this behavior occurred for viscosity contrasts between the upper and the lower mantle that were higher than 10 (Funiciello et al. 2003). The process restarted after the reorganization of the mantle circulation, which was partially inhibited by the presence of the slab along the upper mantle depth. Trench retreat was quite constant, and the slab dip reached values of about 60° (Figure 6b), while its tip lay horizontally on top of the lower mantle. This scenario is justified by the fact that active and resisting forces were constant during this phase, which allowed for a steady-state behavior of the subduction system. Once the subduction and trench migration resumed, the locus of the back-arc extension jumped trenchward, following the new, steeper configuration.
The mantle circulation pattern associated with the subduction into the upper mantle and the interaction with the 660-km discontinuity was continuously monitored and quantitatively estimated using the FT technique (see Funiciello et al. 2006 for additional details). The evolution of the model showed that subduction generated a complex 3-D, time-dependent mantle circulation pattern (Figure 7). The mantle velocity field was decomposed into poloidal and toroidal components. The poloidal flow corresponds to pure sources and sinks in the horizontal plane and is related with vertical mass transport in the viscously coupled slab-mantle system. Toroidal motion corresponds to vortex-like flow and rigid body rotations (e.g., O’Connell et al. 1991). The spatial and temporal features of mantle-induced circulation were carefully analyzed. We found that the poloidal and toroidal mantle components were both active from the beginning of the subduction process (Figure 7). The poloidal component is characterized by the presence of two cells, one at each side of the migrating slab, with different circulation regimes: the oceanic side cell is wider, has a shallower rotation center and is stable in depth. Conversely, the back-arc side cell center of rotation migrates toward the bottom of the box following the slab tip. The poloidal cells were initially not separated by the slab, allowing for a return flow beneath the tip of the slab. The mantle exchange between the two cells faded away as the slab approached the 660-km discontinuity. In particular, when the slab interacted with the upper/lower mantle discontinuity, the poloidal circulation was reduced significantly, only resuming in the third kinematic stage. In this stage the ocean and back-arc side cells were both active, but the slab represented a barrier for material exchange in the vertical direction.
Figure 6. Modeling results of subduction into the mantle and the interaction with the 660-km discontinuity.
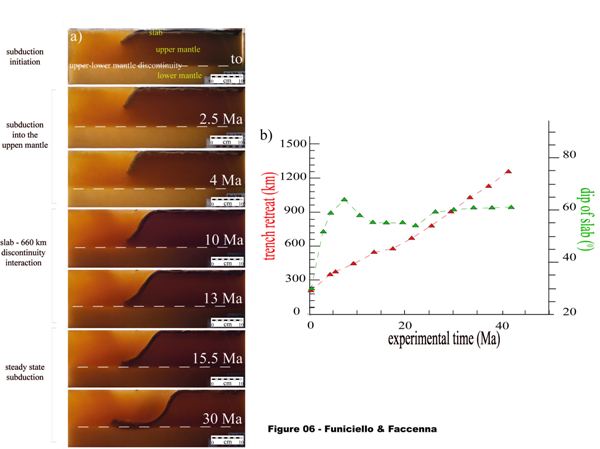
a) Lateral view of seven stages of evolution of a model showing the slab behavior during the subduction into the mantle and the interaction with the 660-km discontinuity. The upper-lower mantle limit in this run is a viscosity increase of 30. However, all the models have an upper-lower mantle viscosity ratio higher than 10 and share a common behavior described in this picture. b) Plot of trench retreat (in red) and dip (in green) versus time.
Figure 7a. Velocity field and streamlines of mantle circulation during the subduction into the upper mantle.
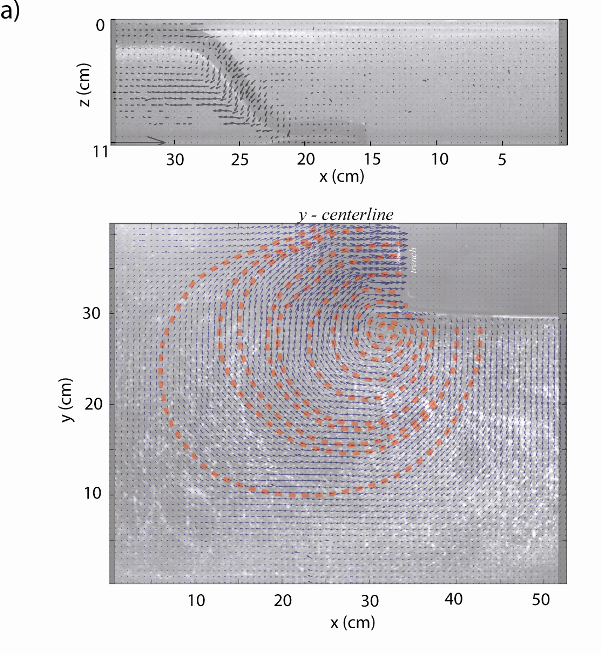
Velocity field and streamlines of poloidal (upper panel) and toroidal (lower panel) mantle circulation during the steady-state phase, as obtained from the FT analysis; time-evolution of linear flow for both x and y components of the mantle circulation. Flow components are:

and

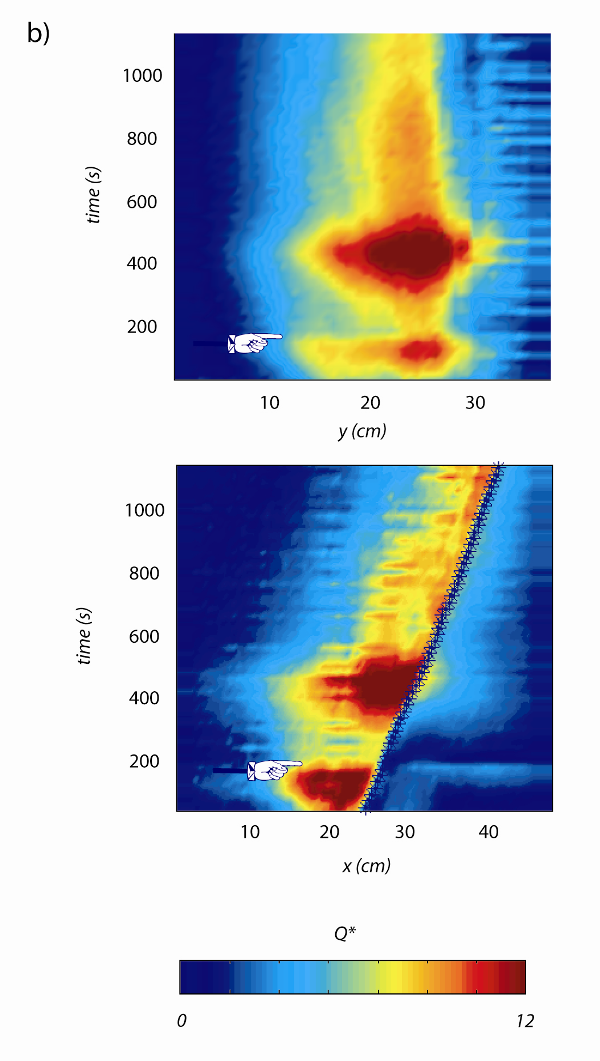
Both components are normalized for a reference flow obtained by multiplying the characteristic trench velocity of the model by the plate thickness. The time of slab-660 km discontinuity interaction is indicated in the left panel. The position of the trench motion at each time is indicated by asterisks in the right panel. This panel summarizes the evolution of toroidal flow during the entire evolution of the experiment, highlighting its strong episodicity (see Funiciello et al. 2006 for details).
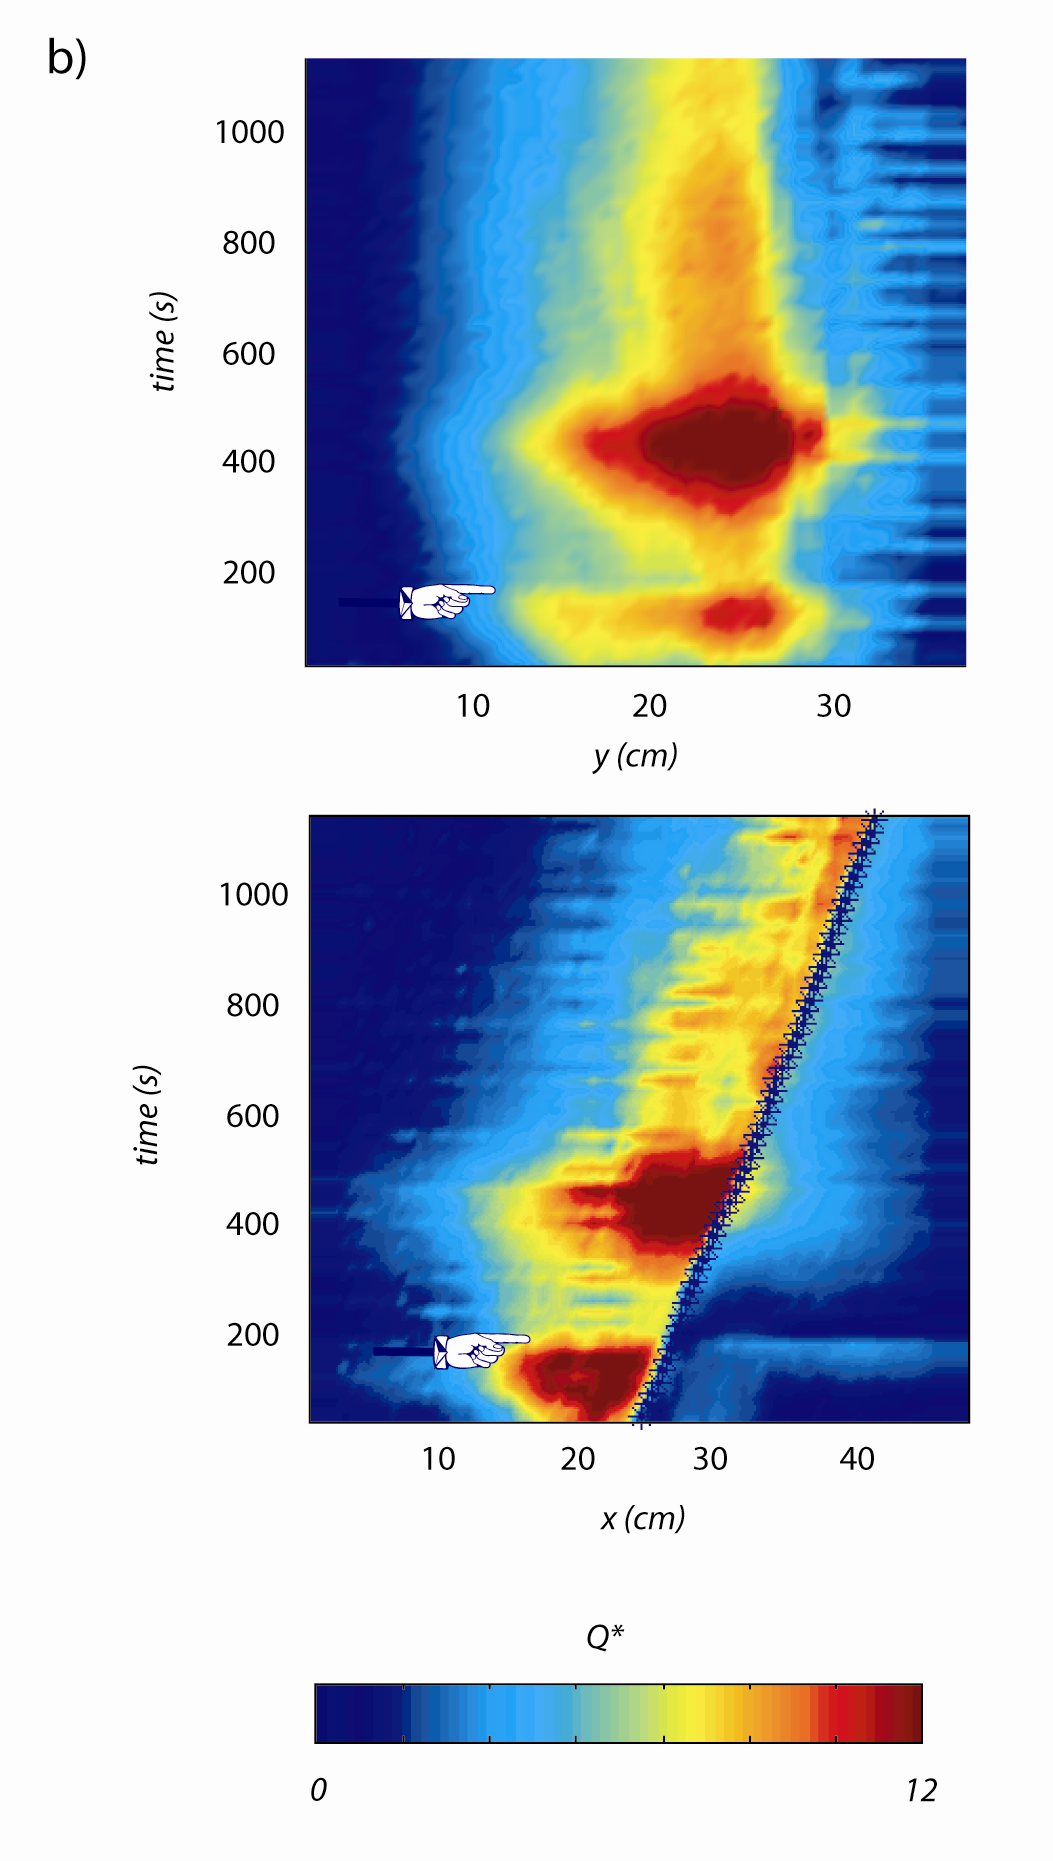
Figure 7b. Velocity field and streamlines of mantle circulation during the subduction into the upper mantle.
The toroidal component, produced by the lateral slab migration in the laterally heterogeneous viscous system, was characterized by two symmetric toroidal return-flow cells centered near the plate edges (Figure 7a and b). Each of the two toroidal cells had fixed dimensions that were linearly dependent on the trench width and followed the trench migration during the entire evolution of the process (Figure 7b).
Finally, our models highlighted the episodic behavior of the mantle circulation. The mantle velocity field consistently increased with time, with trench velocity reaching its maximum before the slab interaction with the 660-km discontinuity (Figure 7b), and it reached a steady-state value only after a slowdown caused by the slab-upper/lower mantle discontinuity interaction. The velocity peak at each time was recorded in the region in front of the trench (Figure 7b) and assumed a value proportional to the trench velocity. The lateral component of flow reached its maximum velocity at a distance of about 300 - 400 km from the slab edge (Figure 7b).
Continental subduction
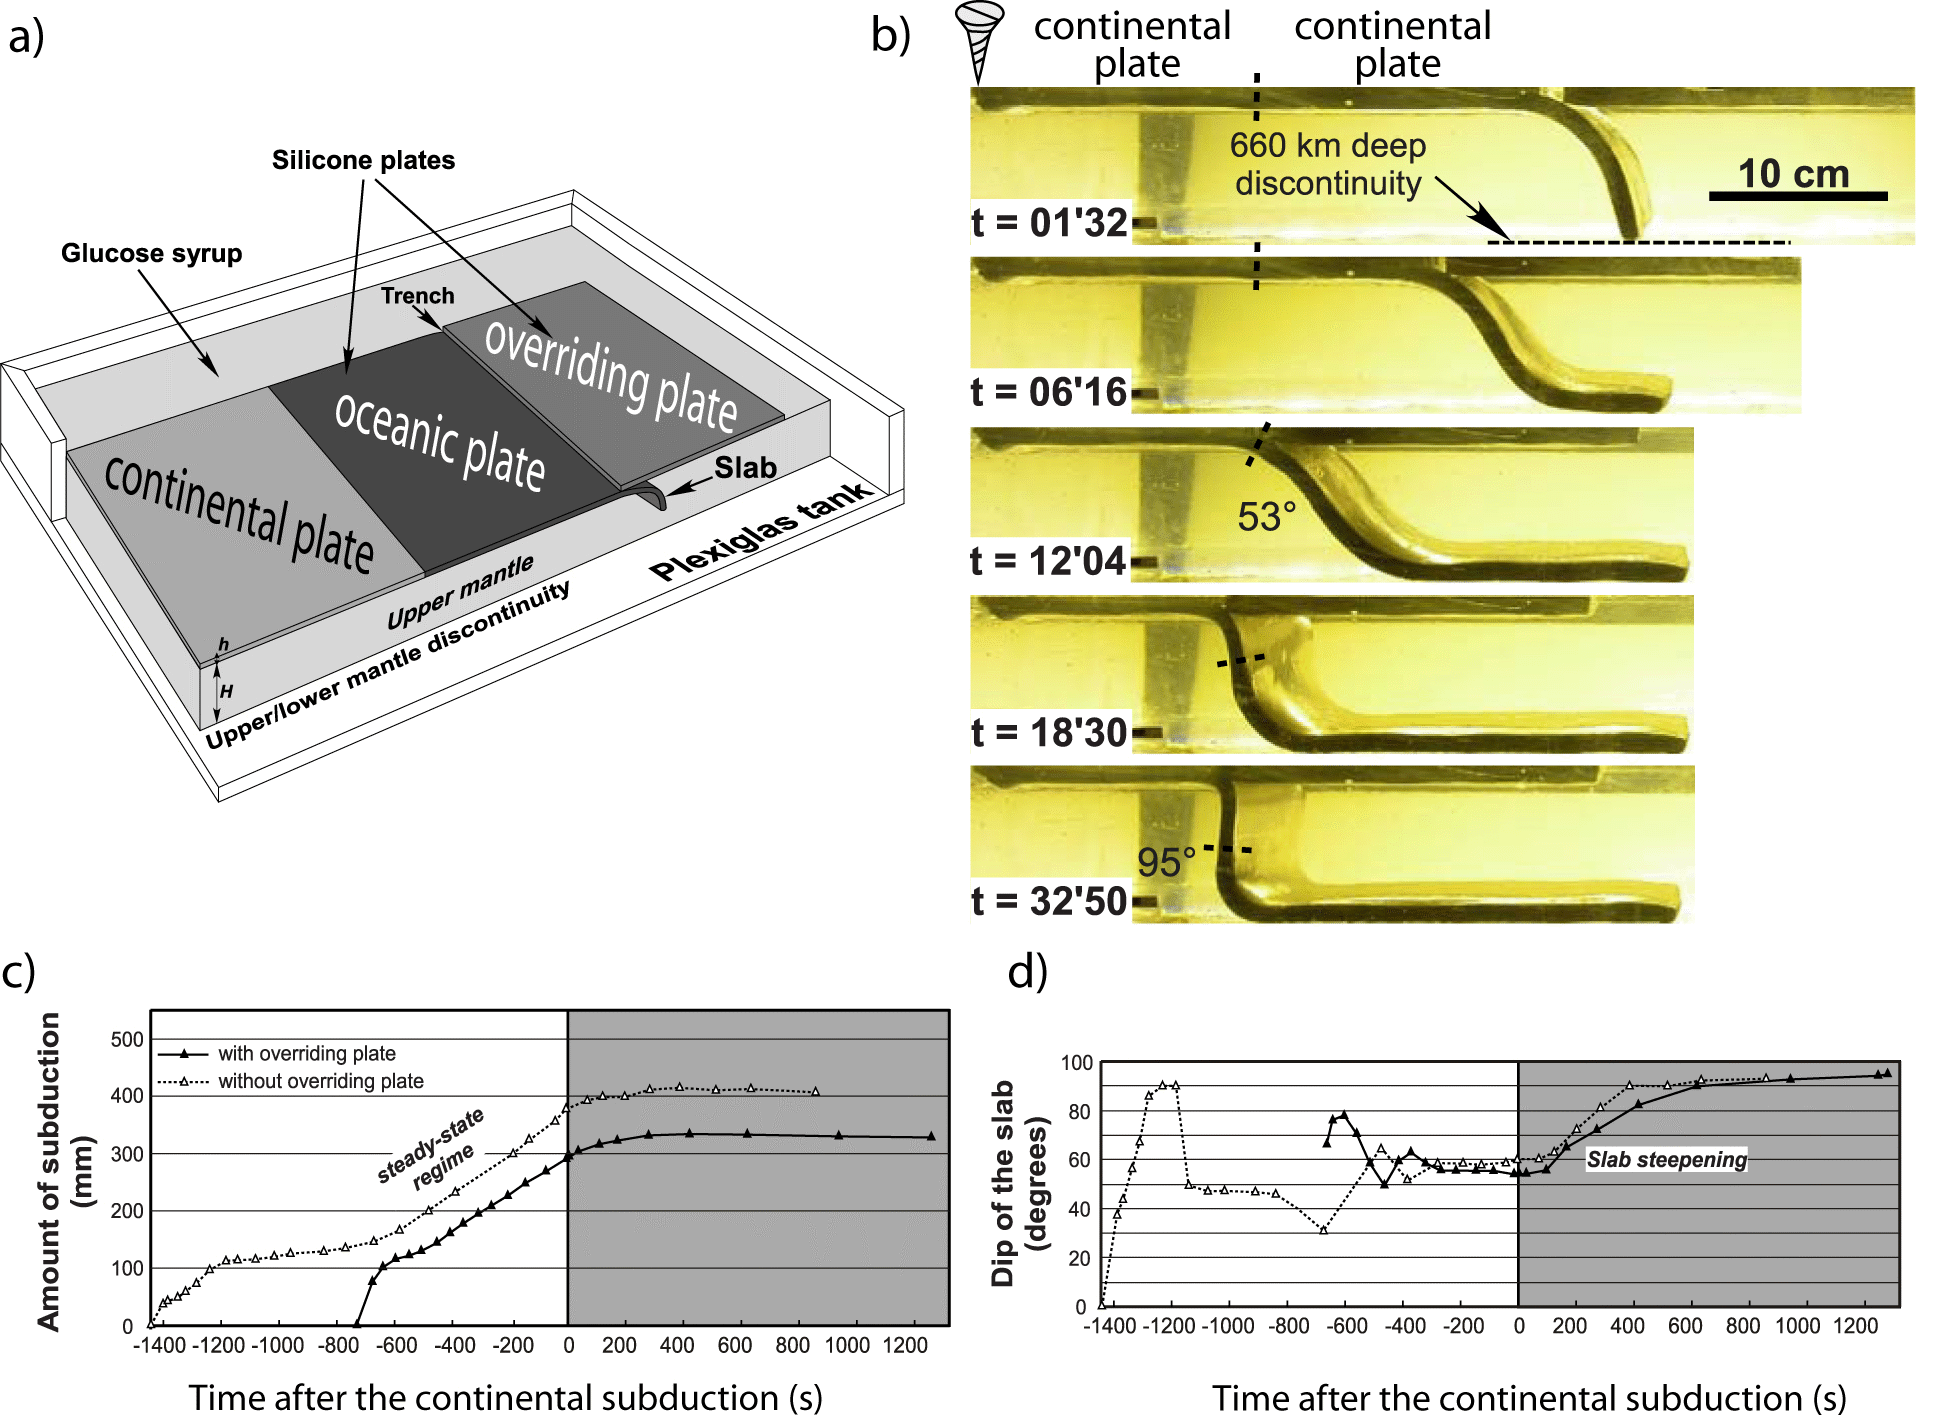
The subduction of the continental lithosphere/oceanic plateau can affect both the kinematics and the geometry of the process by tuning the key driving force active in the system. To experimentally study such a mechanism, we developed models containing a subducting plate simulating a dense oceanic plate, followed by a positively buoyant lithospheric block (Martinod et al. 2005, Espurt et al. 2008). Our models illustrate the typical sequence of events as described in the previous section: subduction initiation, slab interaction with the upper/lower mantle discontinuity, followed by a steady-state regime reached by the subduction of the oceanic lithosphere (Figure 10b-d). In this stage, the process was characterized by a subduction velocity and a slab dip of about 0.3 mm s-1 and 50°, respectively. As soon as the positively buoyant lithosphere began subducting, the subduction velocity suddenly decreased with the slab steepening (Figure 10b-d). The process stopped when ~4 cm of the light lithosphere (corresponding to ~280 km in nature) were subducted, enhancing the progressive verticalization of the slab (Figure 10b and 10d). The presence of a passively moving overriding plate does not alter the overall behavior of the system because the overriding plate passively followed the retreating trench (Figure 10b) and did not deform during the overall modeling evolution.
These experimental results show that the single ingredient represented by the subduction of a large piece of buoyant lithosphere is unable to generate a flat slab segment. This observation contradicts the popular idea, typified by the Mariana and Andes examples, that old and young plates should subduct vertically and horizontally into the mantle, respectively (Uyeda & Kanamori 1979).
Our model illustrates that part of the buoyant lithosphere can easily sink in the upper mantle, which is being pulled at depth by the lower part of the slab (Figure 10b). This can be dynamically justified because the positive buoyancy of the continent/plateau compensates for the negative buoyancy of the dense oceanic slab until an equilibrium is reached. In natural cases, the process may continue with continental/plateau subduction followed by slab break-off (Regard et al. 2003). However, the simplified Newtonian viscous rheology we adopted to simulate the experimental lithosphere does not favor the occurrence of this phenomenon in our models.
Opening of slab windows
In this section, we present models to investigate the long-term and transient effects of a reduction in slab width on the subduction kinematics. These models can offer insights on the consequences of slab tearing and, in turn, slab width reduction on trench kinematics.
In the first set of models (see Guillaume et al. in press), the subducting plate width, kept constant during the experiment, was systematically changed. As previously described, all the models consist of three phases: (1) sinking of the slab through the upper mantle, (2) transient slab/lower boundary interaction, and (3) steady-state subduction after the tip of the slab has interacted with the 660-km depth boundary. Our results confirm that trench velocity at steady state (Vt) scales inversely with slab width (w) (i.e., wider slabs are related to smaller rollback velocity) (Figure 8). These experimental results are in agreement with laboratory (Bellahsen et al. 2005, Funiciello et al. 2006) and numerical models (Morra et al. 2006, Stegman et al. 2006, Schellart et al. 2007, Di Giuseppe et al. 2008) for a free subducting plate. Our data, once scaled to nature, are also compatible with the semi-analytical results of (Royden & Husson 2006), confirming that the trench retreat velocity is controlled by the mantle’s capability to turn around the slab, producing a toroidal circulation. Larger slab width leads to larger amounts of mantle material stirring laterally around the slab edges and, in turn, slower trench retreat velocity.
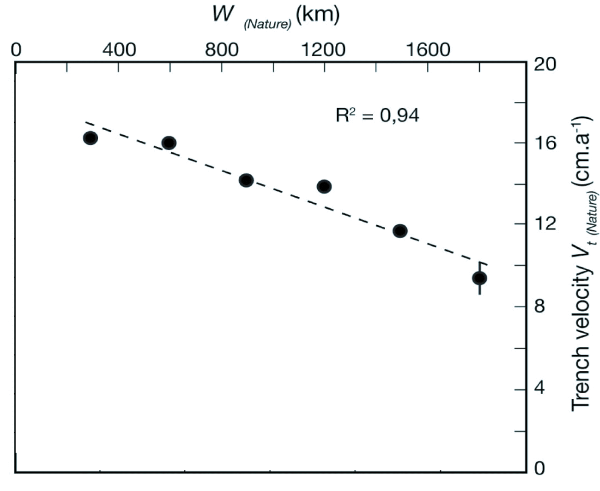
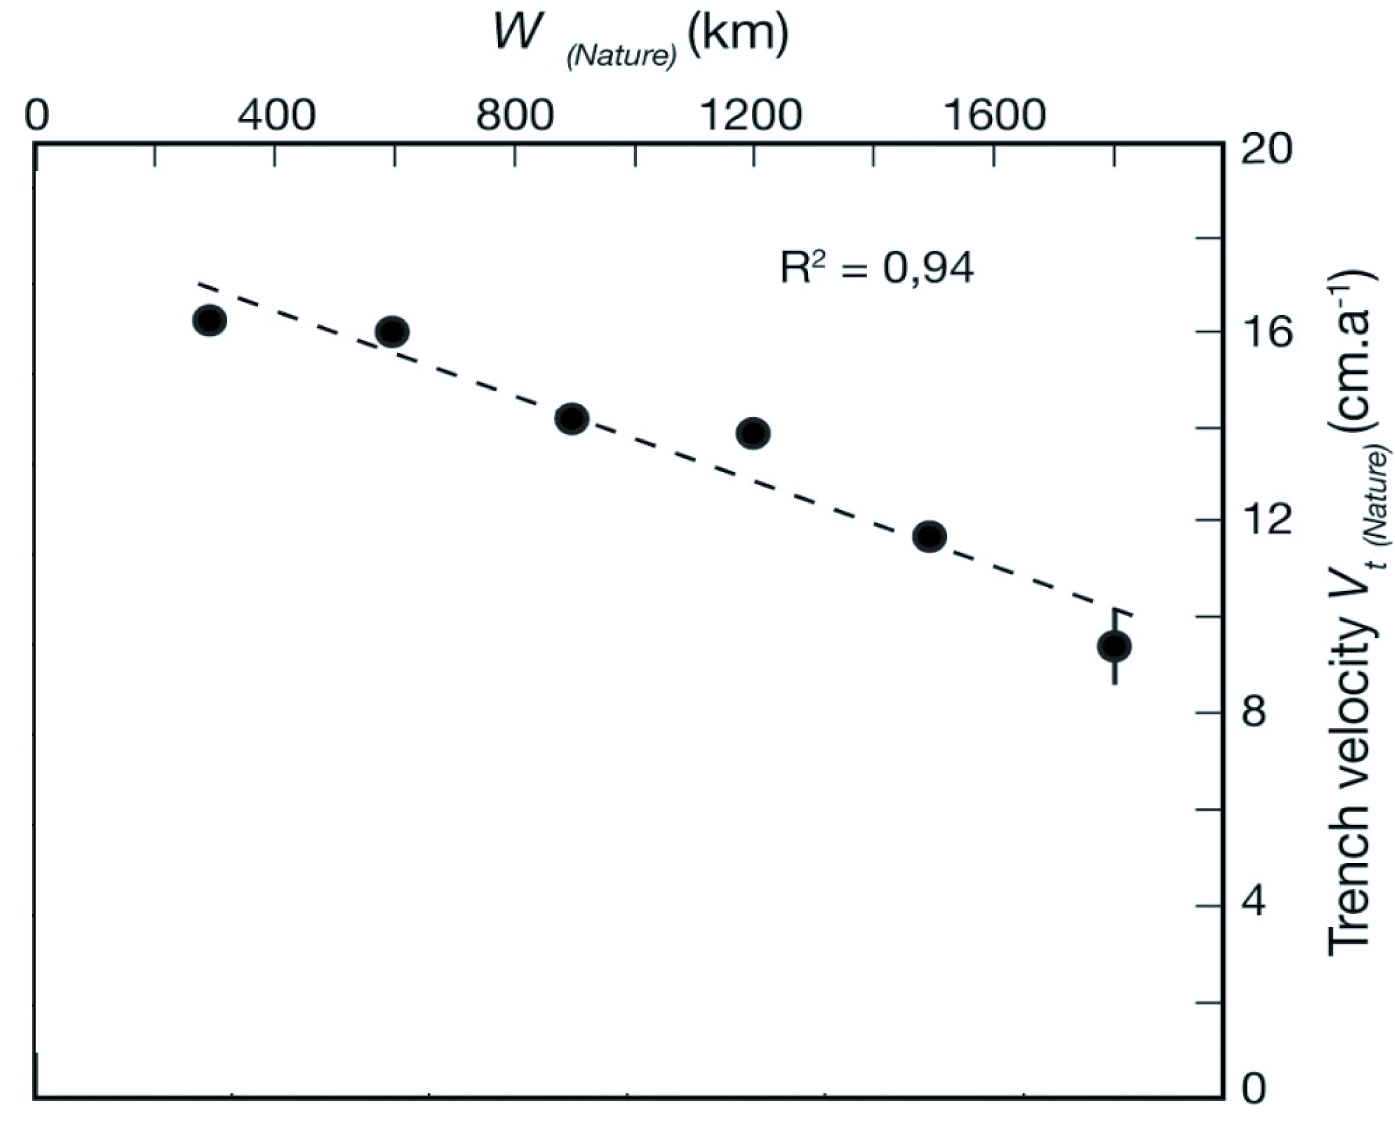
Figure 8. Trench retreat velocity during steady-state subduction vs. slab width.
Diagram showing trench retreat velocity during steady-state subduction (Vt) vs. slab width (w) for models with a constant slab width during subduction. Lengths and velocities are scaled to natural values. The corresponding values for the natural case (considering a 72 km-thick slab, with a negative buoyancy of 77 kg.m-3 and a surrounding mantle with a viscosity of about 103 Pa s) are also reported.
A larger slab width leads to larger amounts of mantle material being stirred laterally around the slab edges and, in turn, a slower trench retreat velocity.
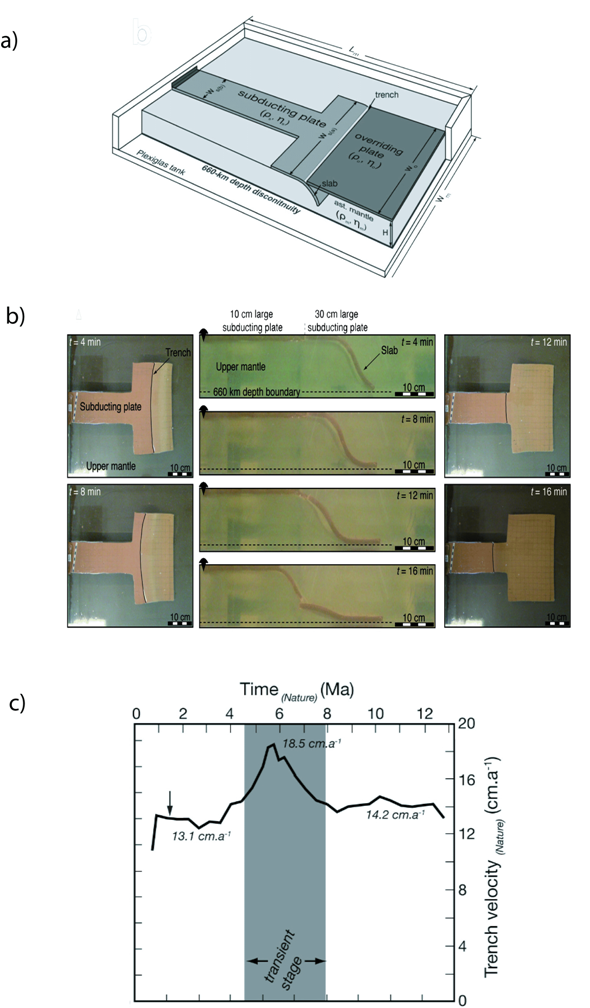
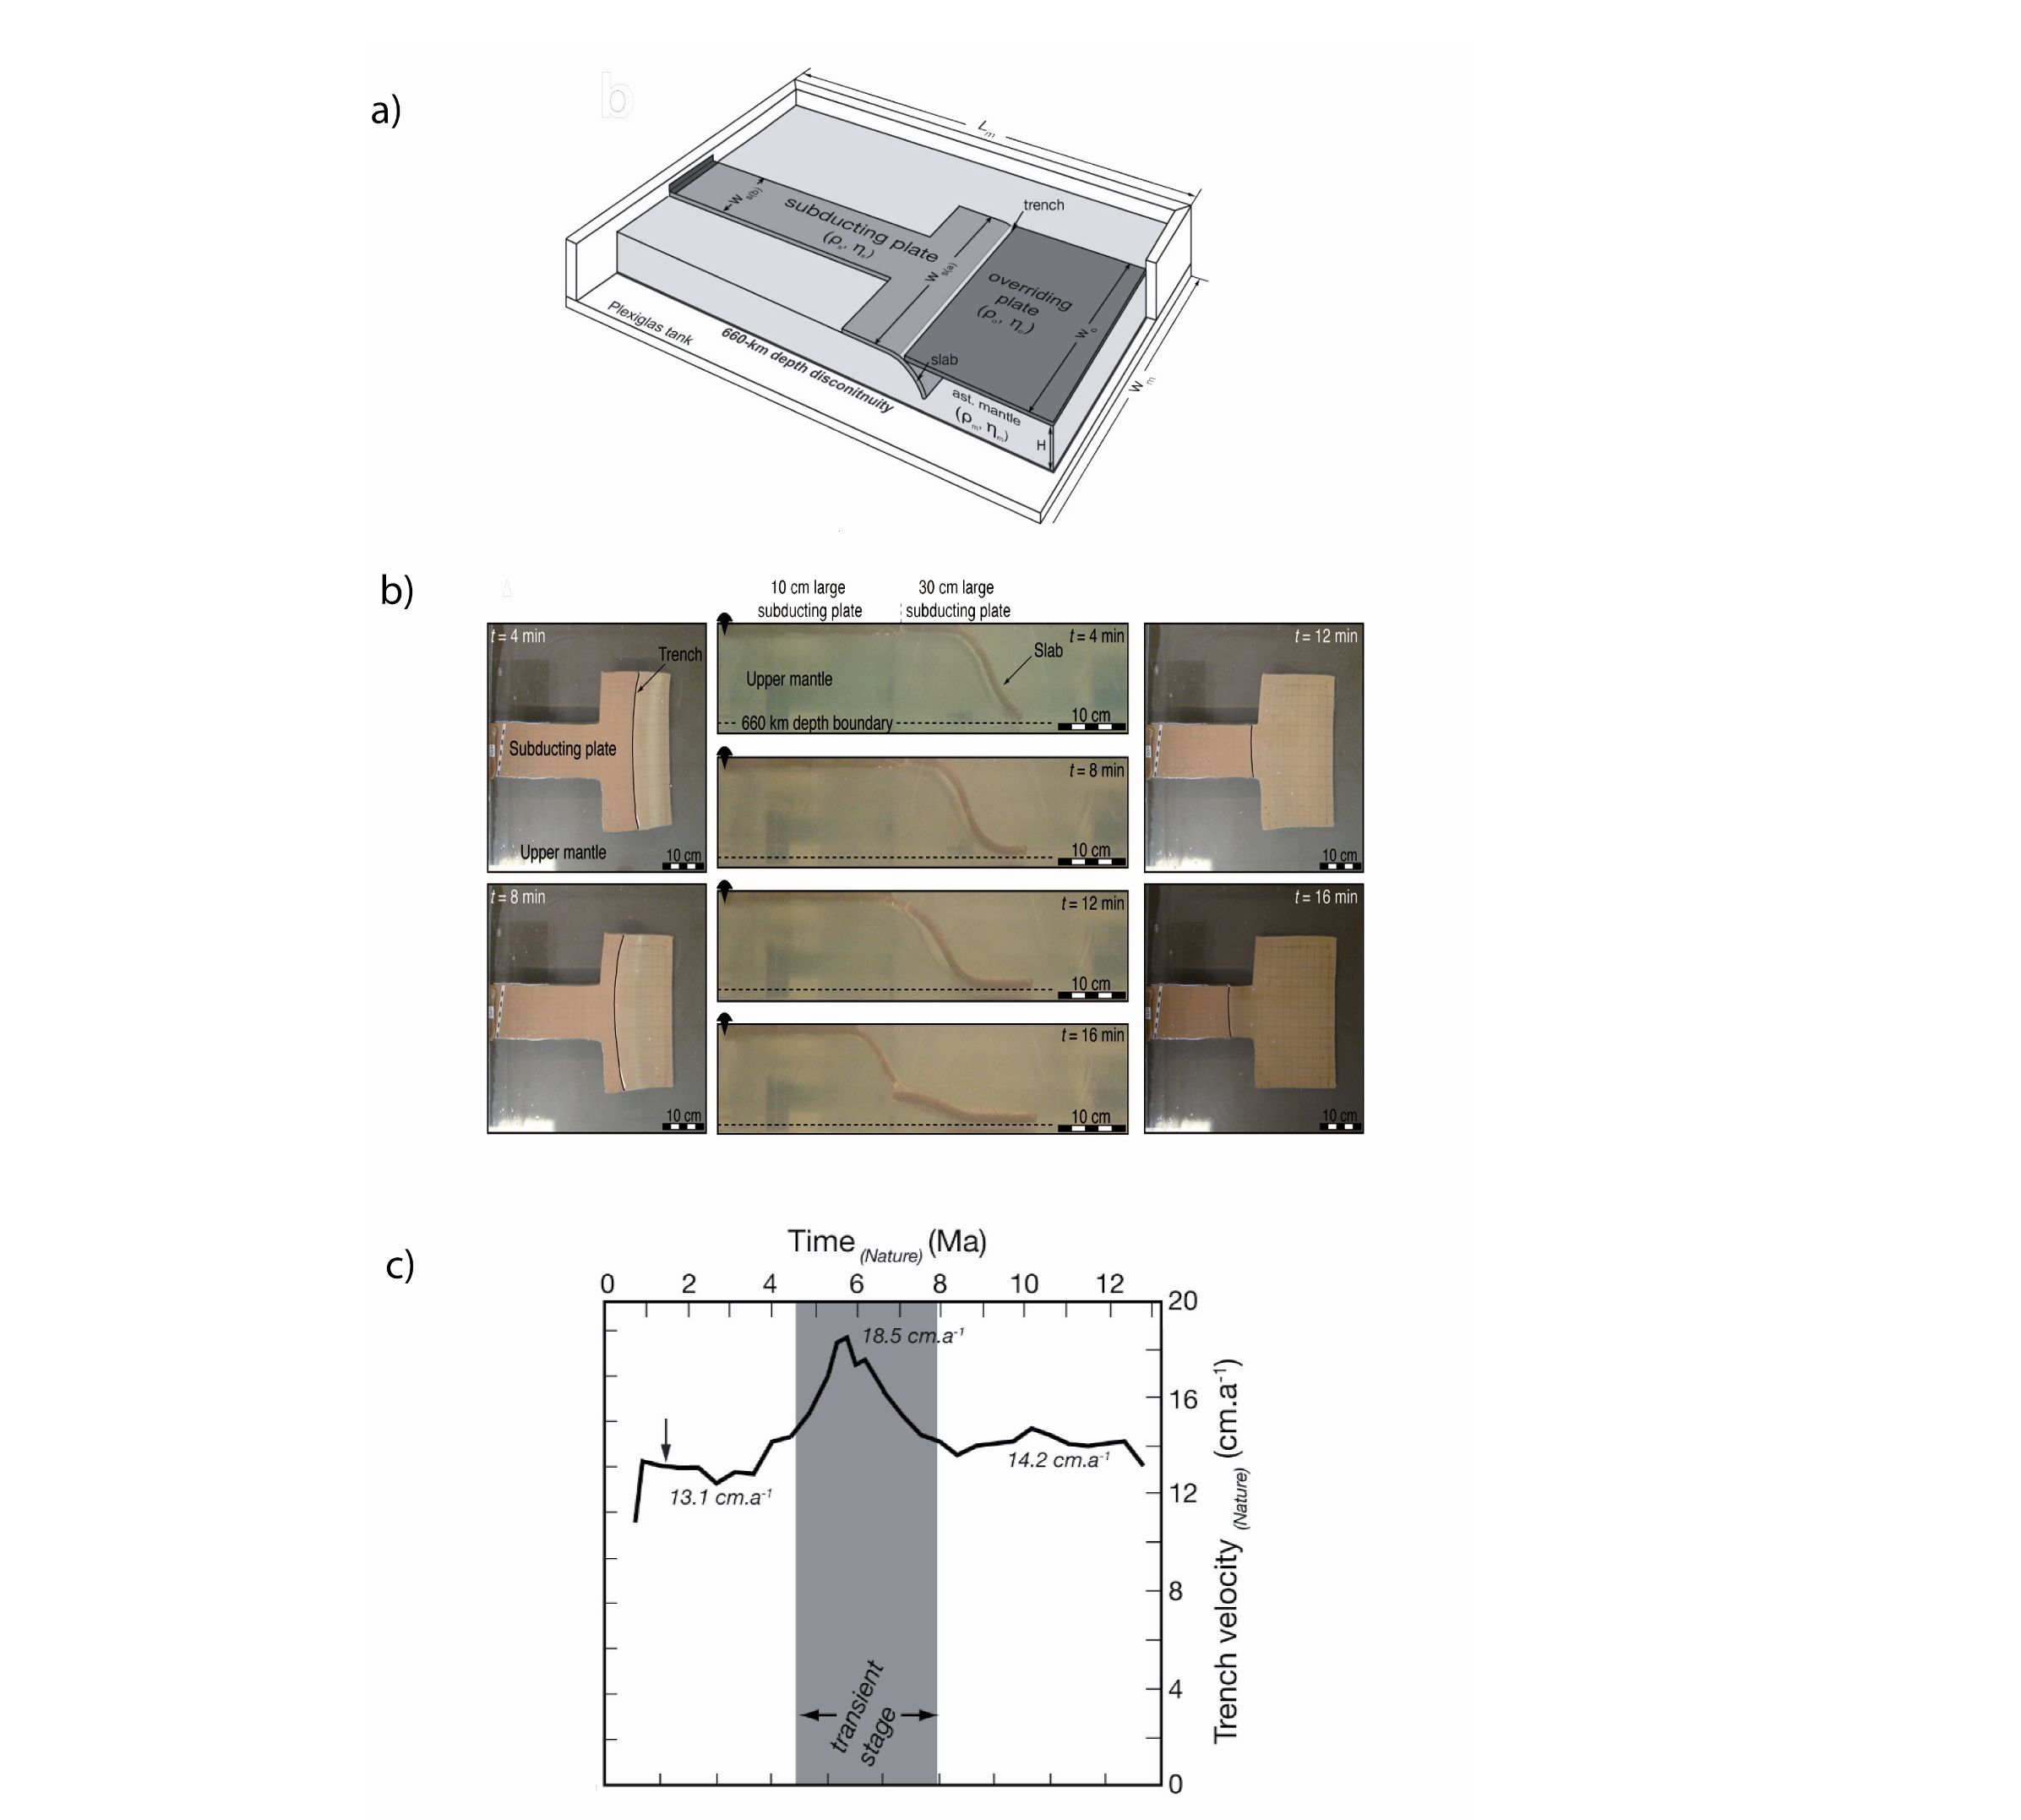
The second set models were developed to study the transient behavior of subduction related to slab narrowing (see Guillaume et al. in press for details). The models adopted a simplified configuration with an abrupt decrease of the subducting plate width (Figure 9a). The selected setup ensures that the steady-state subduction regime is reached before the narrow slab portion reaches the trench. In this way, the kinematic consequences of slab width variation can be univocally recorded. All the models had a typical sequence consisting of four phases (Figure 9a-b): (1) sinking of the slab through the upper mantle; (2) steady-state subduction of the wide part of the slab ("wide slab" stage) after the tip of the slab has interacted with the 660-km depth boundary; (3) transient stage, starting when the narrow portion of the subducting plate entered the trench. This phase is marked by a rapid slab avalanche resulting in a trench velocity acceleration of about 50 % with respect to the velocity recorded during the second phase. The trench velocity progressively decreases by about 25 % to defensively stabilize during phase (4) when, after the trailing edge of the wide slab has interacted with the 660-km discontinuity, steady-state subduction of the narrow part of the slab ("narrow slab" stage) is finally reached.
Figure 9. Modeling results to study effects related to the reduction of slab width.
a) 3-D view of the experimental set-up developed to study the transient effects of the reduction of slab width; b) Lateral and top views of four stages of evolution of a model showing the slab behavior during the subduction into the mantle and the interaction with the 660-km discontinuity while the slab width abruptly decreases. c) Trench velocity, Vt vs. t, for a reference experiment. The time it takes the slab to reach the 660-km depth discontinuity is indicated by a black arrow, and the grey frame indicates the duration of the transient stage.
In terms of slab dynamics, the peculiar peak in trench velocity recorded after the abrupt decrease in slab width may be explained by the rapid decrease in resistance force (mainly slab bending resistance and toroidal flow) related to the reduction in width, while the load of the entire slab, including the lateral detached portion, was still efficiently pulling the plate at depth.
Figure 10. Modeling results of continental subduction.

a) 3-D schematic view of the experimental set-up adopted to simulate the subduction of the continental lithosphere. The subducting plate simulates a 50-Ma-old dense oceanic plate, followed by a continental lithosphere. b) Lateral views of the model. The dashed line marks the tip of the oceanic plateau; at t = 1 min 32 s: the slab interacts with the 660-km discontinuity; t = 6 min 16 s and 12 min 04 s: steady-state subduction occurs at a constant speed, and the slab dip maintains a constant value of about 50° until the initiation of continental subduction; t = 18 min 30s: the continental lithosphere starts to subduct, decreasing the velocity of subduction and increasing the dip of the slab (see panels c and d); t = 32 min 50 s: the buoyancy of the continental lithosphere stops the subduction process. c) Amount of subduction and d) dip of the slab versus time. Results of another model developed without any overriding plate is shown for comparison (white triangles).