Building solid models of focal mechanisms
Solid models of geophysical beach balls may be constructed with applications such as 3D Studio Max™, AutoCAD™, Swift3D™, or SketchUp™, among many other 3D drawing and computer-aided design applications. SketchUp benefits from tight integration with Google Earth; for example, while Google Earth is running in the background, the terrain location on which it is currently centered can be imported into SketchUp and conversely, the current SketchUp model can be exported directly to the current Google Earth location.
Generation and manipulation of models in all 3-D modeling programs is tedious and involves a significant learning curve, consequently such applications have not been adopted by the scientific community with the same enthusiasm as Google Earth itself. However, it is not necessary for individual investigators to generate their own models. Instead, existing models such as those presented here can be (i) downloaded and incorporated in Keyhole Markup Archives (KMZ files), (ii) accessed remotely via network links from within KML documents, or most simply, (iii) imported directly into Google Earth using its “Add...Model” menu option.
Figure 2. Models available for download
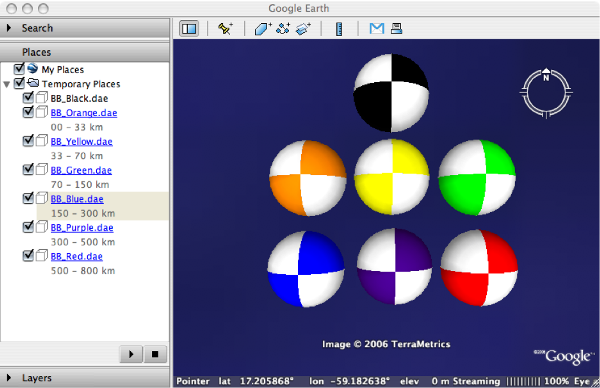
Focal mechanism “beach balls” available for download. Colors can be used to represent depth following the standard USGS depth table (orange <33 km, yellow <70 km, green <150 km, blue 300 km, purple 500 km, red <800 km), or alternatively they can represent event time or other parameters. The black model is used when depth or or data is not implied.
Figure 2 shows a set of beach ball models available for download from the download archive link. They were saved as Collada file types (suffix .dae; see www.khronos.org) which can be directly imported into Google Earth. Like KML, Collada files are an XML dialect and their source code can be viewed with any text editor, as shown in Table 1.
Table 1: Sample Collada File Syntax
<?xml version="1.0" encoding="utf-8"?>
<COLLADA xmlns="http://www.collada.org/2005/11/COLLADASchema" version="1.4.1">
<asset>
<contributor>
<authoring_tool>Google SketchUp</authoring_tool>
</contributor>
<created>2006-12-26T20:21:33Z</created>
<modified>2006-12-26T20:21:33Z</modified>
<unit name="meters" meter="1.0"/>
<up_axis>Z_UP</up_axis>
......etc.
Colors correspond to the standard USGS depth scale, although they could be used to represent other variables such as event time given an appropriate explanatory legend. The models have a default radius of 1,000 meters, but this may be rescaled from within KML (see below). The default ensures that models are clearly visible on a regional map pattern if moment magnitude is scaled so that Mw = 1.0 corresponds to 1 km, Mw = 2.0 to 2 Km, etc.. It is important to bear in mind that solid models viewed from above correspond to upper hemisphere projections, in contrast to traditional lower hemisphere focal mechanism diagrams.
Figure 3a. Semi-transparent ground overlay

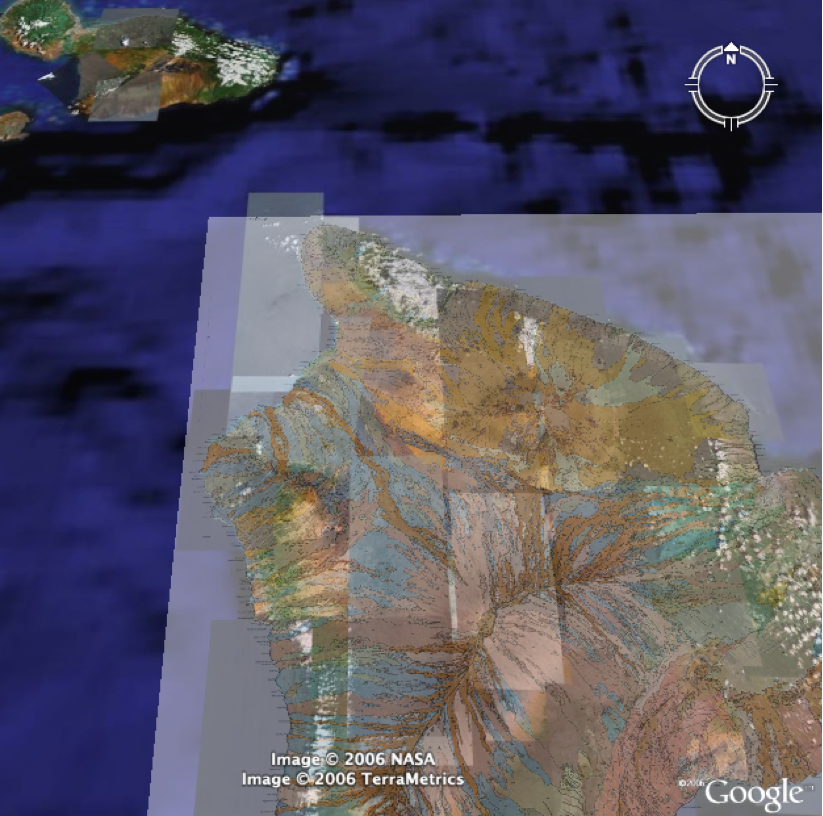
A semi-transparent ground overlay representing the USGS geological map of Hawaii main island. Note that the underlying Google Earth terrain model is opaque.
Figure 3b. Virtual Globe transparency
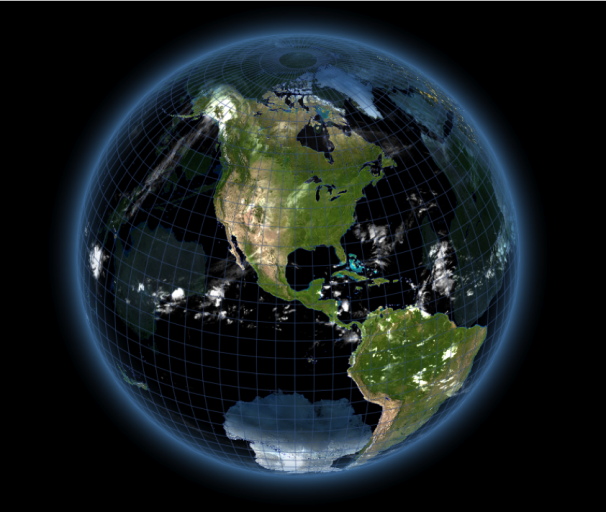
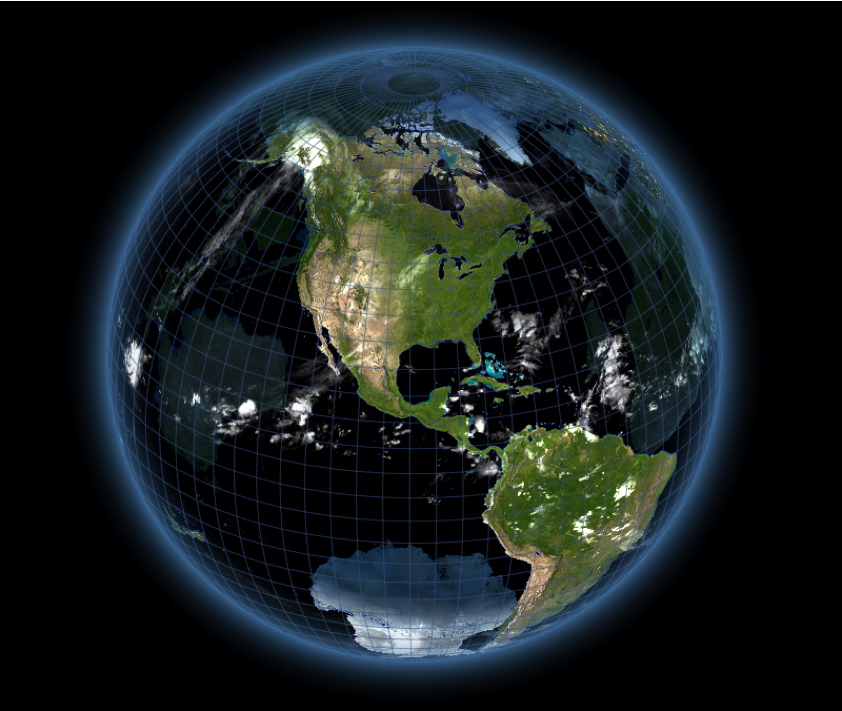
A virtual globe with opaque continents and fully transparent oceans from www.mackiev.com.) Note that the continents other than North and South America are viewed back-to-front, through the interior of the globe. Google Earth currently does not support terrain transparency.