Representing the subsurface in Google Earth
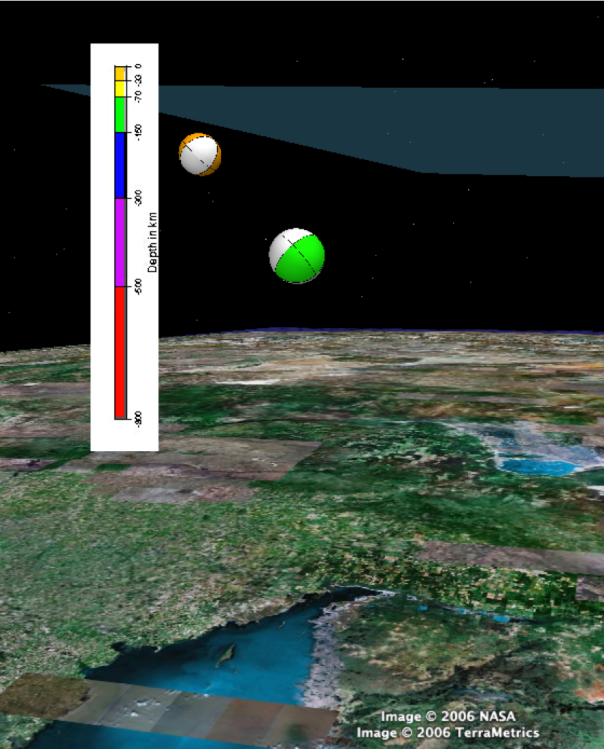
A current limitation of Google Earth is that, whereas models and ground overlays can be made variably transparent, the Google Earth surface itself is always opaque (Figure 3a). Hopefully, future versions of Google Earth will permit sub-surface visualization, a feature which would not be technically difficult to implement. Other virtual globes permit surface transparency – see for example www.mackiev.com (Figure 3b). Meanwhile, sub-surface data must be “bumped up” by a specified amount. The approach taken here is to include either a depth scale pole (Figure 4a) or a local semi-transparent datum plane (“glass ceiling”) that hovers over the local surface to indicate the amount of vertical offset (Figure 4b). Both models can be made visible or invisible, moved to any Lat/Lon location, and bumped out by any specified distance. They are included in the download file. A more labor-intensive approach developed by De Paor & Williams 2006) is to bump-out the terrain, as shown for the main island of Hawaii in Figure 4c. Here, the Google Earth terrain was recorded with screen capture software and projected onto the upper surface of a solid model which was then imported back into Google Earth and positioned precisely over the original terrain. Click here for a movie demonstration [Bump-out Demo].
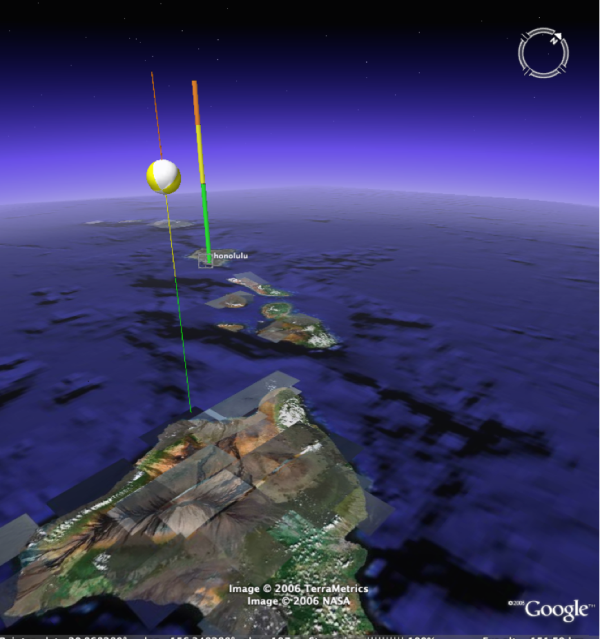
Figure 4a. Scale pole
Scale poles indicate the amount of vertical offset using the USGS color chart of Fig. 2.
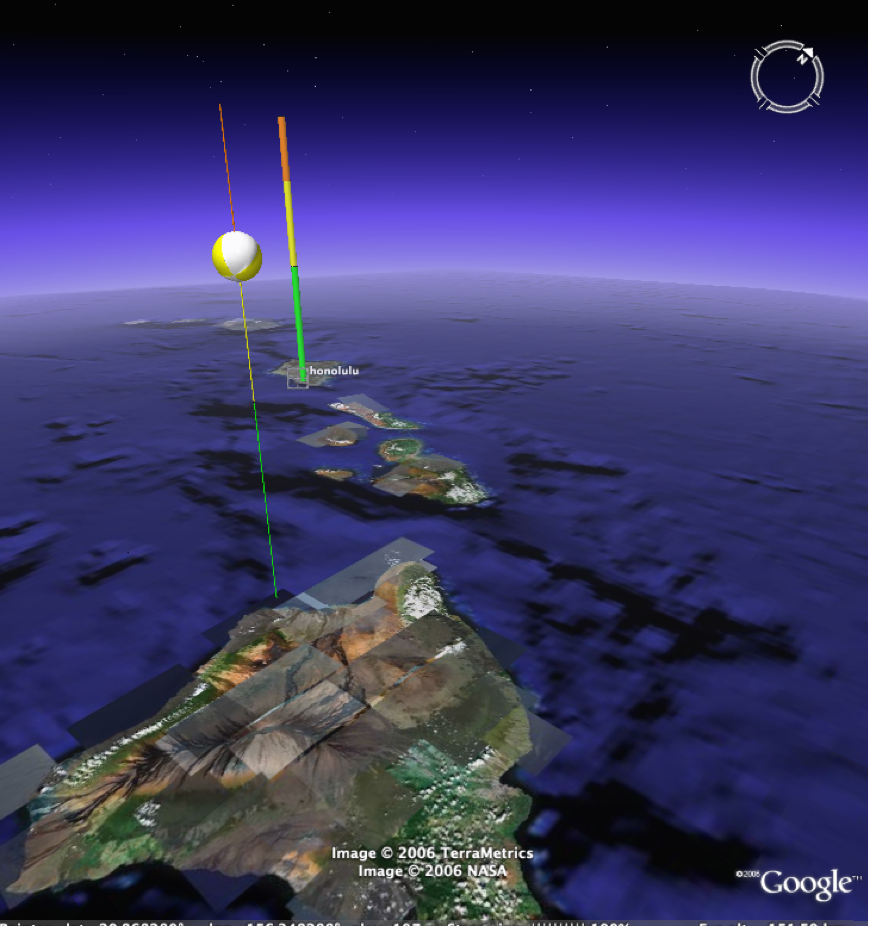
Figure 4b. "Glass ceiling" reference plane
A “glass ceiling” floating over the local region of interest can be used to represent the zero depth datum. Or an image may be imported as a screen overlay.
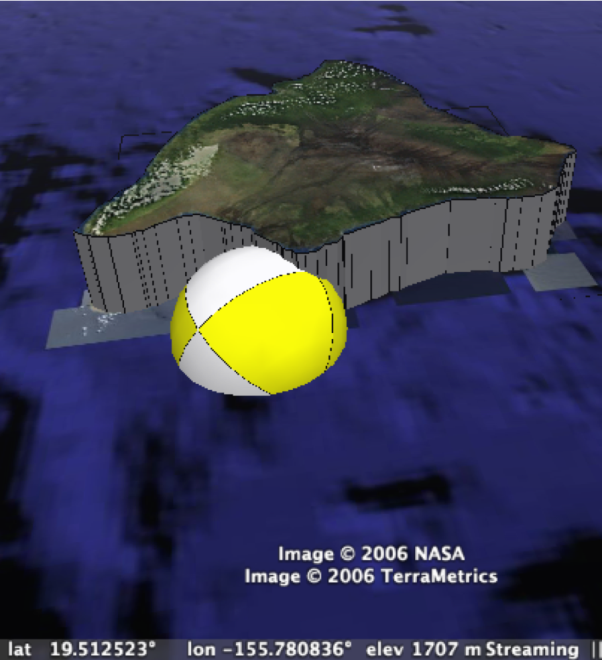
Figure 4c. Hawaiian surface bumpout
A 50 km high surface bump-out of the Hawaiian main island (here viewed towards the east) was created using SketchUp modeling software. This aids visualization of the 38 km deep Kiholo Bay Earthquake of Oct 2006 (see De Paor & Williams 2006).