GES DISC Data Processing
In order to visualize 2D geospatial satellite data and analyze output results in Google Earth, data access and processing services are used to pre-process the data into images or user required format. The results from those services are then integrated and visualized in Google Earth.
Uniform serving of and access to data products
OPeNDAP simplifies scientific data networking, allowing uniform and simplified access to remotely-sited data. OPeNDAP servers can make data from any server appear local -- regardless of data type, storage location, storage format, or user’s visualization package. Existing, well-known data analysis and visualization applications such as Matlab and Interface Definition Language can be easily transformed into clients to interact with OPeNDAP server. The server consists mainly of an OPeNDAP Light Front Server and Back End Server (OPeNDAP 2007). GrADS is another kind of interactive software tool for easy access, processing, and visualization of scientific data related to the Earth. It handles datasets in a four-dimensional data environment (longitude, latitude, vertical level, and time). GrADS can process many kinds of data formats, including binary, GRIdded Binary, and HDF (Doty 1995)
Both GrADS and OPeNDAP are used at GES DISC to serve vast volumes of Earth science data distributed among different data servers. The data include TRMM, AIRS, MODIS-Aqua, MODIS-Terra, etc. GrADS mainly serves data in binary format. Most data in HDF format are served through uniform OPeNDAP interfaces that can be remotely accessed by any client or user requests.
Uniform processing geospatial data
Figure 1 shows several solutions that can be used to visualize geospatial data in Google Earth. OGC WCS and WMS standard specifications have been widely followed, developed and applied in geoscience communities. WCS provides the getCoverage interface for accessing user required data that can be output to KML files. WMS provides the getMap interface for outputting user required data in the desired image format, such as png, jpeg, and gif. Output images can be embedded into a KML file and visualized in Google Earth.
WMS has been implemented and used by many academic, non-profit, governmental, and commercial organizations. WMS has lots of versions because implementations vary widely. Most WMS implementations are free of charge and open source for future development and improvement according to users’ specific requirements. One of the most popular and stable WMS is from the University of Minnesota. It is called MapServer and is being maintained by a growing number of developers (nearing 20) from around the world, and is being supported by a diverse group of organizations that fund enhancements and maintenance (MapServer 2007).
The GES DISC has selected MapServer to customize and visualize geospatial data. MapServer can access up to 60 different data formats via the geospatial data abstract library, one of whose features is the capability to create a virtual file format where different data-related options can be specified. The MapServer can access a SQL database, such as PostGreSQL, or MySQL, whose records point to local virtual files. Inside the virtual file is geospatial information, warping information, a color bar, and an OPeNDAP link. MapServer uses this information to render the data. Once all user-required layers have been processed and overlain, the resulting image is sent back to the OGC-compliant client or to any Web browser for display.
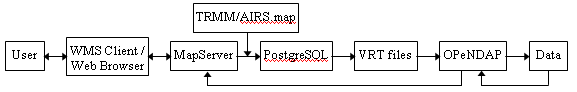
Figure 2 is the data flow diagram for transparent, uniform access to vast volumes of distributed, heterogeneous geospatial resources, with the results returned to the user in an image format through OPeNDAP and MapServer. The advantage of this approach is that the data and computational servers are totally separated. The data server can be freely archived and managed without any concerns about processing services served through OPeNDAP. The computational server can freely access and retrieve user-required data and process these data through a uniform URL interface.
Visualization of 2D data products in Google Earth
Any path followed in Figure 1 will allow users to customize, visualize, and display distributed and heterogeneous geospatial data in Google Earth. At GES DISC, the shadowed paths in Figure 1 are used. Several kinds of 2D data are made available in Google Earth, including Level 3 monthly, daily and 3-hour TRMM, monthly and daily AIRS, monthly MODIS-Terra and MODIS-Aqua, and monthly Polarization & Anisotropy of Reflectances for Atmospheric Sciences coupled with Observations from a Lidar, and others.
KML files are used as the intermediate media to visualize the aforementioned available images or data in Google Earth. Those images or data are produced on-the-fly via WMS/Giovanni 3 rendering the data that are served through OPeNDAP/GrADS. Table 1 is a KML file for TRMM data inside which a WMS request is embedded. When the user opens the KML file in Google Earth, a WMS request is sent to the WMS server and an image is returned to the Google Earth for display. The KML <LookAt> tag defines how Google Earth displays the image to the user. The KML <href> tag is a WMS request that is necessary for WMS to acquire and process the data and includes all user-provided parameters. The KML <LatLonBox> tag defines the size of the image that will be displayed. Because all TRMM data are global for the tropical and subtropical regions, they cover 40°N to 40°S of latitude and 180°E to 180°W of longitude.
Table 1 - KML file for integrating TRMM 3A12 data product
<kml xmlns="http://earth.google.com/kml/2.0">
<Folder>
<name>NASA TRMM_3A12_V6 2000-07-01</name><description>…</description>
<LookAt>
<longitude>-92.5813388657719</longitude>
<latitude>26.80481483728439</latitude>
<range>8000000.0</range>
<tilt>0.0</tilt>
<heading>0.0</heading>
</LookAt>
<Document>
<name>TRMM V6 Data</name><description>…</description>
<GroundOverlay>
<name>2000-07-01</name>
<Icon>
<href><![CDATA[http://g0dup05u.ecs.nasa.gov/cgi-bin/wms_ogc?SERVICE=WMS&
VERSION=1.1.1&REQUEST=Getmap&layers=bluemarble,TRMM_3A12_V6_MONTHLY_surfrain
&BBOX=-180,-50,180,50&TIME=2000-07-01&format=png&transparent=true&WIDTH=1500 &
HEIGHT=800]]> </href>
</Icon>
<LatLonBox>
<north>50</north>
<south>-50</south>
<east>180</east>
<west>-180</west>
</LatLonBox>
<TimeStamp>
<when>2000-07-01</when>
</TimeStamp>
</GroundOverlay>
</Document>
……
</Folder>
</kml>
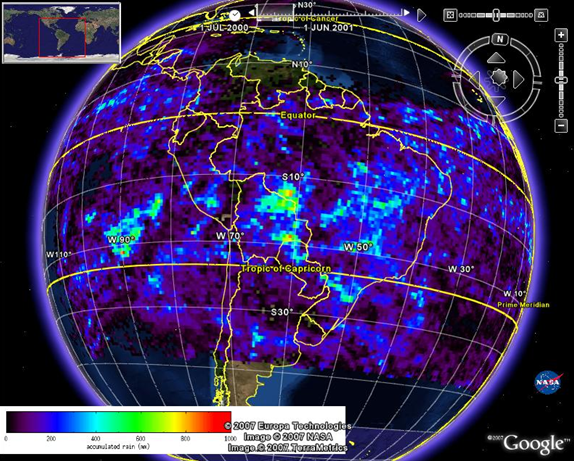
Figure 3 is the TRMM 3A12 0.5˚ x 0.5˚ gridded monthly product that is integrated into Google Earth via the above KML file. The image product consists of mean 2A12 data, calculated vertical hydrometeorological profiles, and mean surface rainfall.