Data organization, serving and visualization in Google Earth
KML is an XML-compliant markup language, invented by a company called Keyhole Inc. that was later acquired by Google Inc. It can be used to represent, organize, store, manage, serve and visualize 2D and 3D geospatial data in geographic browsers such as Google Earth, Google Maps, Google Mobile, World Wind and Virtual Earth. Non-expert users can easily publish their geospatial data using KML in Google Earth. Data can also be streamed continuously from a server.
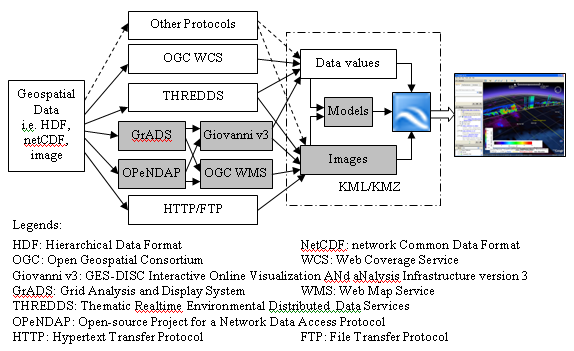
The KML language permits the user to plot points, lines, and polygons, and to superimpose images on the screen or on or above the ground. Data may be linked to remote servers and textual descriptors may be added. All geospatial data, regardless of form (point, line strings, polygons, geometries, images, and 3D models), always have corresponding longitude, latitude and altitude information. KML tags, such as scale, tilt, heading, and style, can make the view of geospatial data more specific. KML also provides time features, such as TimeSpan and TimeStamp, which are very important for visualization of a massive historical archive of geospatial data. Geospatial data can be nicely organized via specific tags in KML files (Google 2007a). Figure 1 illustrates how to utilize general and scientific specific data access protocols to represent, store, serve and visualize the geospatial data in Google Earth via KML/KMZ files.
Figure 1. Visualizing geospatial data in Google Earth
Serving and visualizing geospatial data in Google Earth via KML/KMZ files
Basically, KML provides three kinds of methods for visualizing data in Google Earth.
Directly using geospatial data values in KML files and rendering them in Google Earth
In this method, such KML tags as Point, LineString, LinearRing, Polygon, MultiGeometry play important roles. Geospatial data can be accessed by some scientific data specific protocols, such as Web Coverage Service (WCS) from Open Geospatial Consortium, Inc. (OGC), Thematic Realtime Environmental Distributed Data Services, NASA GES DISC Giovanni v3, and others. The scietific data values are read into the KML file as the values of the KML tags and its properties. Finally, the scietific data are visualized in Google Earth via the KML file.
Using images of geospatial data
Geospatial data are first rendered in standard image formats - png, jpeg, gif, etc. Then, images are stored in KML files in standard web address or local path. Such tags as PhotoOverlay, ScreenOverlay, and GroundOverlay are used to access the above files. The Google Earth application can display such images with features (e.g location, or transparency) specified in KML. Images can be remotely provided through HTTP/FTP protocol or HTTP/FTP-based OGC Web Map Service (WMS) or Giovanni v3, etc. Scientific data relating to planet Earth may be accessed via other protocols that are generally used only by scientists, e.g.. the Grid Analysis and Display System (GrADS) (Doty 1995) and Open-source Network for a Data Access Protocol (OPeNDAP) (OPeNDAP 2007). This solution is currently used by the GES DISC for integrating 2D AIRS and TRMM data into Google Earth (Figure 1). It is also used to produce images for creating the orbit curtain models of CloudSat, CALIPSO, MODIS-Aqua, and AIRS vertical data.
Using models in KML files
The Google Earth application can display 3D Collada models (http://www.khronos.org/collada/). Collada is the name of an XML-compatible file type especially used for modeling 3D objects. So, 3D and 4D data sets can be prepared for viewing in Google Earth via using the SketchUp tools (Google 2007) which exports Collada files. Both numeric data and graphic images can be imported into Collada models via the above two methods. The model template is created via Google’s SketchUp tool. This method is used to create the orbit curtain of the vertical data of CloudSat, CALIPSO, AIRS, and MODIS-Aqua.
Folder, Document, Placemark and NetworkLink tags are used to organize and manage the geospatial data. Their attributes are used to describe datasets, offer download addresses, and introduce data-related issues. The shadowed elements of the diagram in Figure 1 are the solutions used by the GES DISC. These solutions embrace Earth science specific protocols and services for access to, processing Earth science data and visualizing them in Google Earth