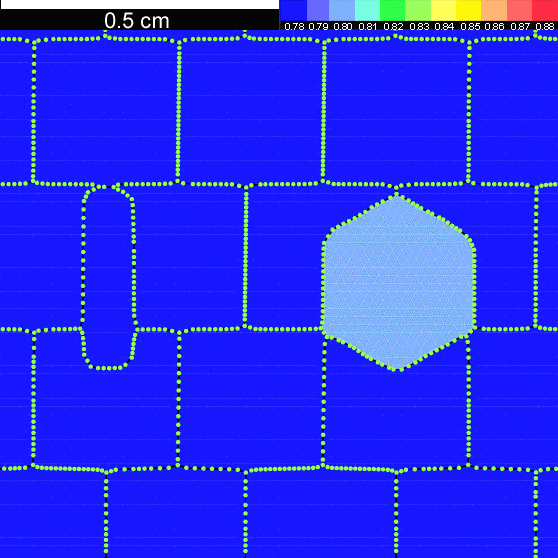
Figure 8. Comparison of the volume diffusion results
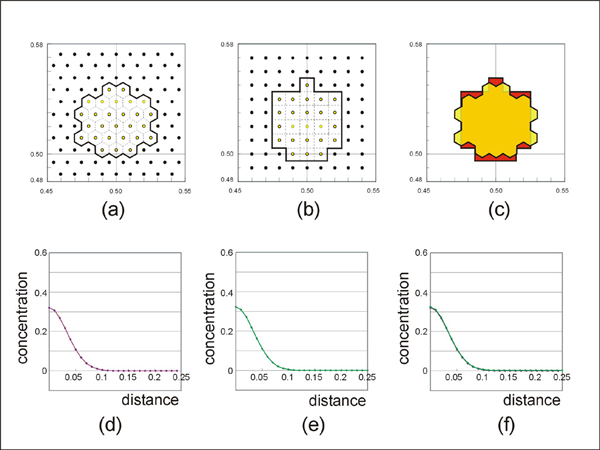
Comparison of the volume diffusion results between this model (a and d) and the conventional finite-difference grid model (b and e). Superposed diffusion source region (c) and concentration profile (f).
In order to test the algorithm for volume diffusion within crystals, the result from the diffusion algorithm (discussed above) is compared with the result from the well-known finite difference scheme [e.g. Crank 1975; p. 141]. This type of test was carried out because of some complexities in the unode-involved diffusion algorithm (e.g. calculation of flux area and estimation of the concentration field represented by a single unode). We compared the concentration profiles with the point-source initial condition (Figure 8). Since the geometry of nodal distribution is different between the two methods, the area represented by a node is different and this resulted in different concentration profiles. To avoid this, a source region instead of a point source was constructed with multiple points. When geometrically similar regions are used (Figure 8a, b, and c) it is found that the concentration profiles are almost identical (Figure 8d, e, and f). Thus, we believe that the diffusion algorithm using unodes produces numerically correct results.
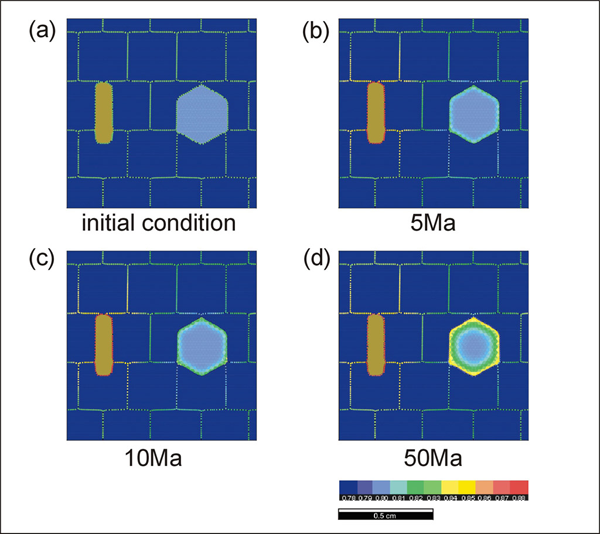
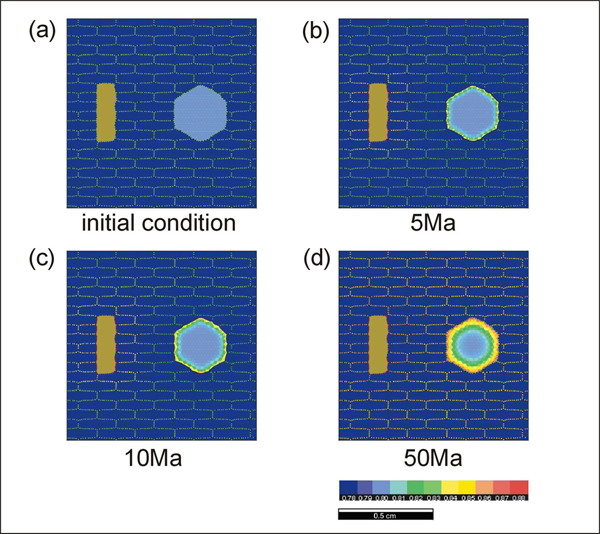
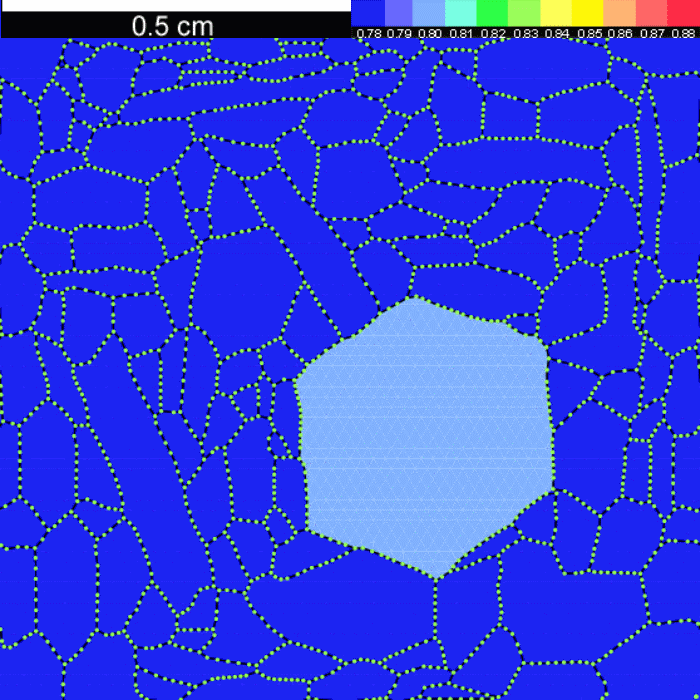
Simulation 1. Results of garnet-biotite exchange reaction run #1
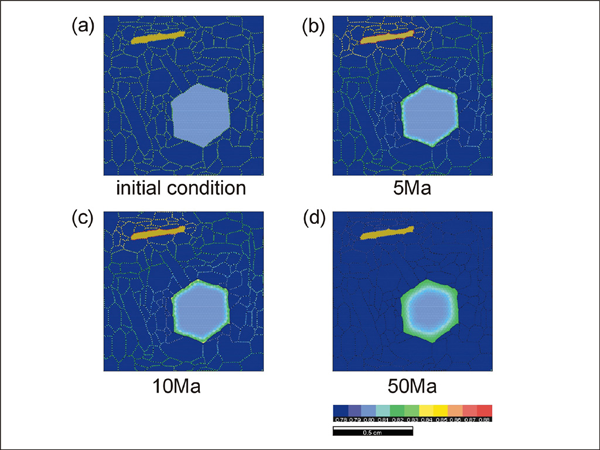
Results of garnet-biotite exchange reaction run #1 (dot: grain-boundary nodes, yellowish brown: biotite, blue: quartz, hexagonal crystal: garnet). The colors in garnet represent the mole fraction of Fe. Compare the result with Figures 2 and 3 to see how distribution geometry of garnet and biotite affects the reaction rate.
We have carried out three types of experiments; (1) at a constant temperature with different distribution of phases participating in the exchange reaction (run #1 to 3), (2) at a constant temperature with varying matrix textures where the matrix does not participate in the reaction (run #4 to 8), and (3) during cooling (run #9). The experiments (run #1 to 3) at a constant temperature are intended to investigate how the pattern of garnet zonation is affected by the distribution and amount of biotite. The initial compositions for garnet and biotite are 0.8 and 0.6 (in Fe mole fraction), respectively. Since these compositions are disequilibrium compositions at the experimental temperature condition of 600°C, the garnet and biotite start to exchange ions to approach the equilibrium KD value. Simulation 1 shows the results of run #1 where a single biotite and a single garnet are present with quartz matrix. Since the differences in the garnet composition are small, we have optimized CLUT (color look up table) for the garnet composition. Therefore, the biotite composition as well as the grain boundary chemistry is not expressed correctly under the selected CLUT. Concentric zonation pattern is developed in garnet. Since the biotite grain is located in the upper left, we can expect some differences in biotite-facing sides of garnet, but such differences are not observed. This could be because of the boundary geometry in this model; the Elle texture assumes ring boundary (i.e. the upper boundary is attached to the lower boundary and this is also true for the left and right boundaries).
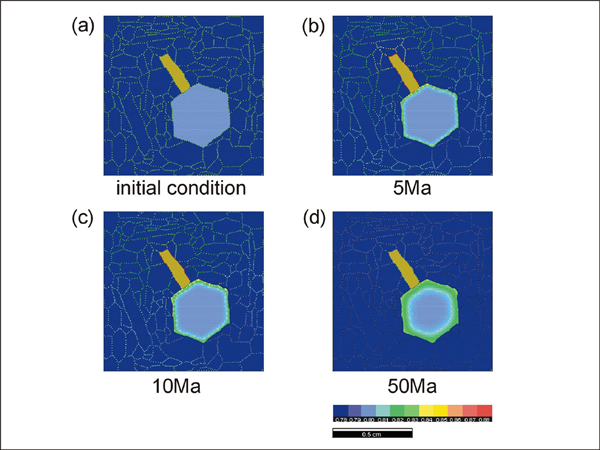
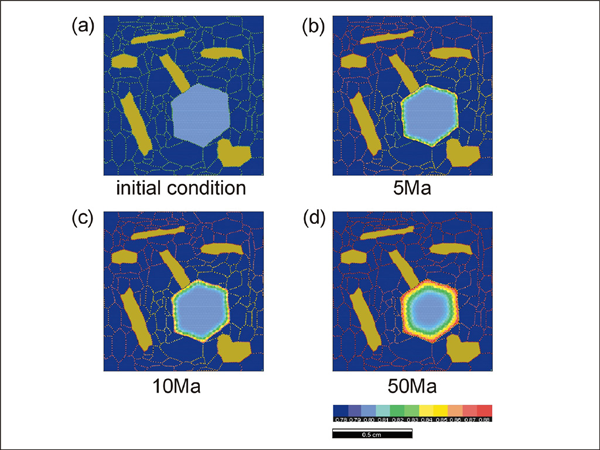
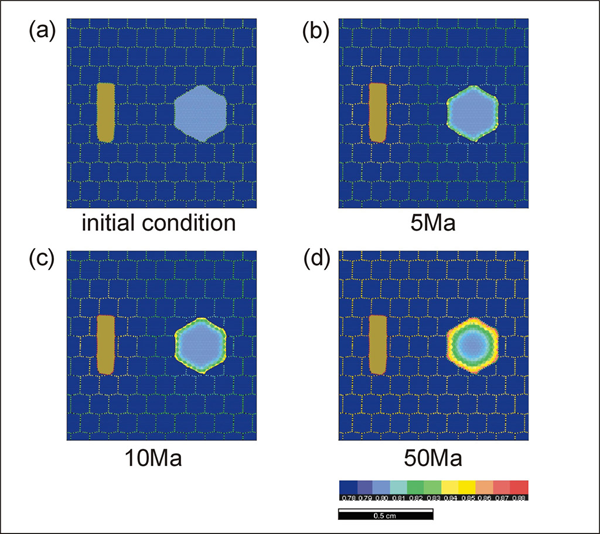
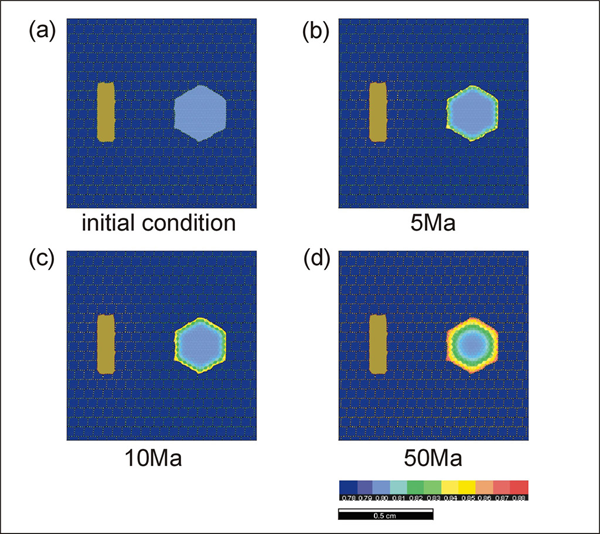
In run #2 where biotite is placed adjacent to garnet (Simulation 2), the diffusion effect is more pronounced for the biotite-facing side compared with the opposite side of the garnet. Therefore, we can expect that the distribution geometry of phases participating in reactions can influence the exchange reaction. In run #3 (Simulation 3), we have increased the volume fraction of biotite to see how the amount of biotite can affect the exchange reaction. The amount of biotite seems to be an important factor during exchange reaction. An increased amount of biotite enhances the rate of reaction by providing more ions and possibly by larger surface area for ionic exchange between biotite and grain boundary. Experiments (run #4 to 8) were carried out to see the effects of matrix texture on the rate of exchange reaction. The initial conditions for these runs are identical to those used in experimental runs #1 to 3.
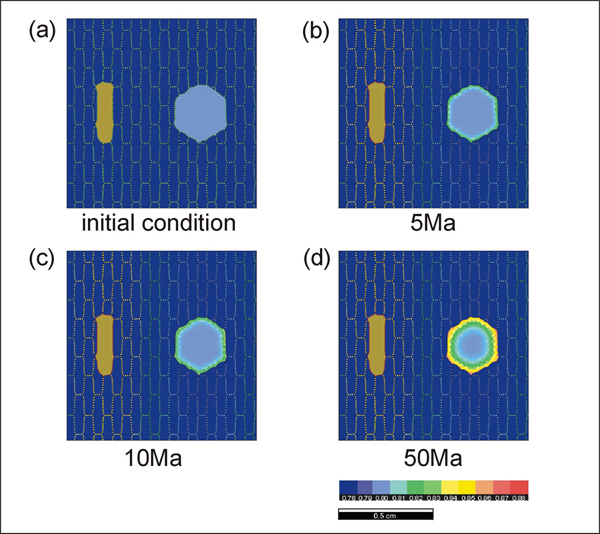
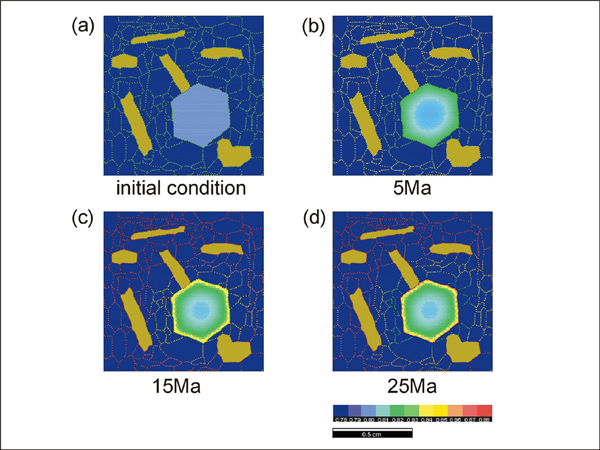
Simulation 1. Results of garnet-biotite exchange reaction run #4
Results of garnet-biotite exchange reaction run #4. Compare the result with simulations 2 and 3 to see how the matrix grain size affects the reaction rate.
Simulations 4 - 6 (run #4 to 6) show the effect of grain size in the matrix that does not participate in the exchange reaction. The rate of the ion exchange reaction is enhanced as the grain size in the matrix phase decreases. This result is expected since the amount of ion transportation will increase as the density of grain boundary area per unit volume (i.e. flux area) increases. The effect of grain-shape foliation in the matrix as well as the geometry of diffusion pathways is also investigated.
Simulation 1. Results of garnet-biotite exchange reaction run #7
Results of garnet-biotite exchange reaction run #7. Compare the result with Figure 16 to see how the direction of grain-shape foliations and the geometry of diffusion pathways affect the reaction rate.
Simulations 7 and 8 show the experimental results with a north-south and east-west oriented foliation, respectively. When the foliation direction is east-west (Simulation 8), the rate of reaction is faster because the geometry of the diffusion pathways is simpler. In run #9 (Simulation 9), we have performed a cooling experiment from 750°C to 450°C with a cooling rate of 10°C per Ma. The biotite distribution geometry is the same as in run #3. Equilibrium compositions are used for the starting composition (garnet Fe mole fraction = 0.8 and biotite Fe mole fraction = 0.54). Since the rate of diffusion becomes slower during cooling, sluggish changes in zonation pattern occur during the late stages of cooling.