Although the current model for Fe-Mg exchange reaction produced the predicted results, the model has several limitations and uncertainties in algorithm. These will be briefly discussed here.
Figure 18. Results of volume diffusion from a point source in one, two, and three dimensions
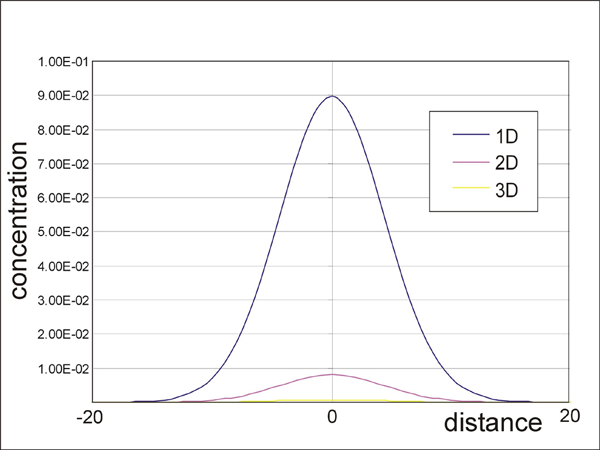
Results of volume diffusion from a point source in one, two, and three dimensions. The calculations were made using finite-difference methods described in Crank (1975).
The major limitation of the model is dimension-related problem. Since diffusive mass transfer in rocks occurs in three dimensions, our two-dimensional model has a fundamental limitation when we apply the model to the interpretation of the natural zoning. Figure 18 shows the comparison of concentration profiles in point-source diffusing systems of one, two, and three dimensions. Not surprisingly, the two-dimensional model (like in our Elle based model) shows much slower diffusion than the three-dimensional result. Therefore, it is impossible to model natural diffusive process with the current model. Expansion of data structure is necessary to allow three-dimensional diffusive mass process (Figure 19).
Figure 19. Possible data structure for three dimensional diffusive mass transfer
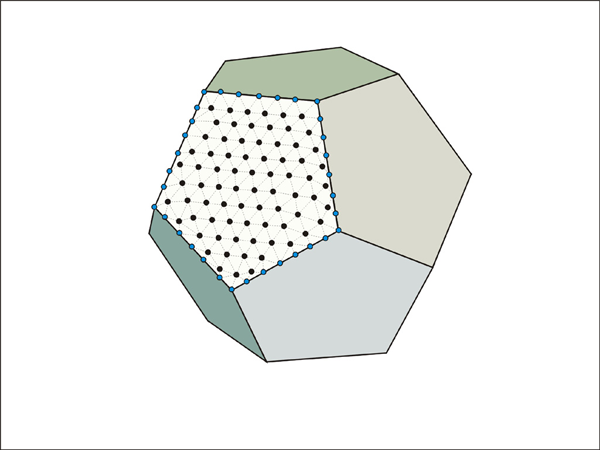
Illustration of a possible data structure for three dimensional diffusive mass transfer.
The exchange process of grain chemistry with the grain boundary chemistry was made using the special unodes (Figure 4b). The proportionality constant was introduced to calculate the rate of exchange, and the constant may have a meaning similar to the reaction constant. For the results presented here, we used an arbitrary value that produced sufficiently fast reaction during each run. However, the proportionality constant can have a fundamental effect on the bulk rate of ion exchange reaction. For example, when the constant approaches to the value of zero, the reaction ceases in the model. In spite of the fundamental importance, it is not clear which value should be chosen for natural rocks.
When the model calculates the equilibrium composition for garnet and biotite, the distribution coefficient (KD) is used (described in assumption (4)). The program finds the unodes adjacent to the grain boundaries. Then the average concentrations for garnet and biotite are calculated for these unodes. The concentration values are used to calculate the distribution coefficient within the system. The calculated value of the distribution coefficient is compared with the predicted equilibrium value of the distribution coefficient by Ferry & Spear (1978). Then the exchange reaction proceeds in the direction of approaching the equilibrium value of the distribution coefficient. This type of calculation sometimes can produce incorrect results. Figure 20 illustrates a situation where incorrect results can be produced where heterogeneous garnets (e.g. fractured garnet) are present in the system. When the volumes of interfacial garnets have different composition (like in Figure 15), a complicated situation may arise. For example, some garnet interfaces should lose Fe to reach chemical equilibrium while other interfaces should gain Fe. However, this type of complicated processes may not be possible in our model since we simply average the compositions of interfacial garnet in order to compare the average value with the equilibrium value. We feel that this simplification sometimes may produce incorrect results while approaching the state of equilibrium. A more robust way of dealing with heterogeneous garnet composition will be to calculate the local Gibbs free energy for the volumes occupied by interfacial unodes. Then, the direction of exchange reaction (i.e. Fe gain or loss) can be determined in the direction of lowering local Gibbs free energy.
Figure 20. Heterogeneous compositions
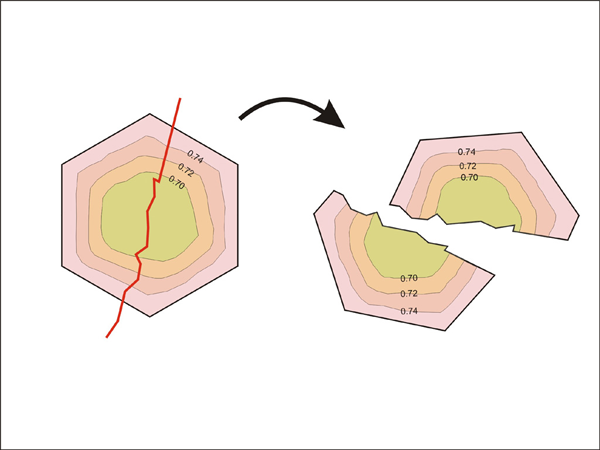
Heterogeneous compositions of garnet at grain margins by fracturing (Numbers and dashed curves represent Fe mole fraction and isochemical contours, respectively). See text for details of this effect on exchange reaction.
As stated earlier, we feel that the current model has many problems in simulating natural garnet-biotite exchange reactions. However, we also think that this type of approach will eventually lead to the development of more realistic model since it is difficult to solve this problem analytically because many parameters are changing during metamorphism. For example, textural changes in matrix such as grain growth and development of foliation commonly occur during metamorphism. Since the framework of the model is Elle [Jessell et al. 2001] which allows simultaneous operation of many subprocesses (e.g. grain growth, recystallization, and deformation), we believe that the algorithm presented here may be used to build a more complete model for thin-section scale textural development.