Texture analysis
Texture (crystallographic preferred orientation) measurements were done at HIPPO (High-Pressure Preferred Orientation neutron time-of-flight diffractometer) at Los Alamos Neutron Science Center (LANSCE), New Mexico. Neutrons penetrate deeply into rocks allowing the use of larger samples than other diffraction techniques like EBSD, improving statistics (Xie et al., 2003, Gómez Barreiro et al., 2010A).
Microstructural analysis was crucial to decide the sample selection and orientation. Strain partitioning and severe variation in grain size have to be under consideration, in order to maximize the total number of grains and the homogeneity of the fabric. For those reasons we are focusing on homogeneous levels of ultramylonites, where shear strain is supposed to be most concentrated. Lineation and foliation were also used as a reference system for sample preparation in texture analysis. Oriented cylindrical samples of 10 mm in length and 8 mm in diameter, were drilled perpendicular to the lineation, and parallel to the foliation in order to maximize the volume of ultramylonitic fabric (Fig. 4 and 8)
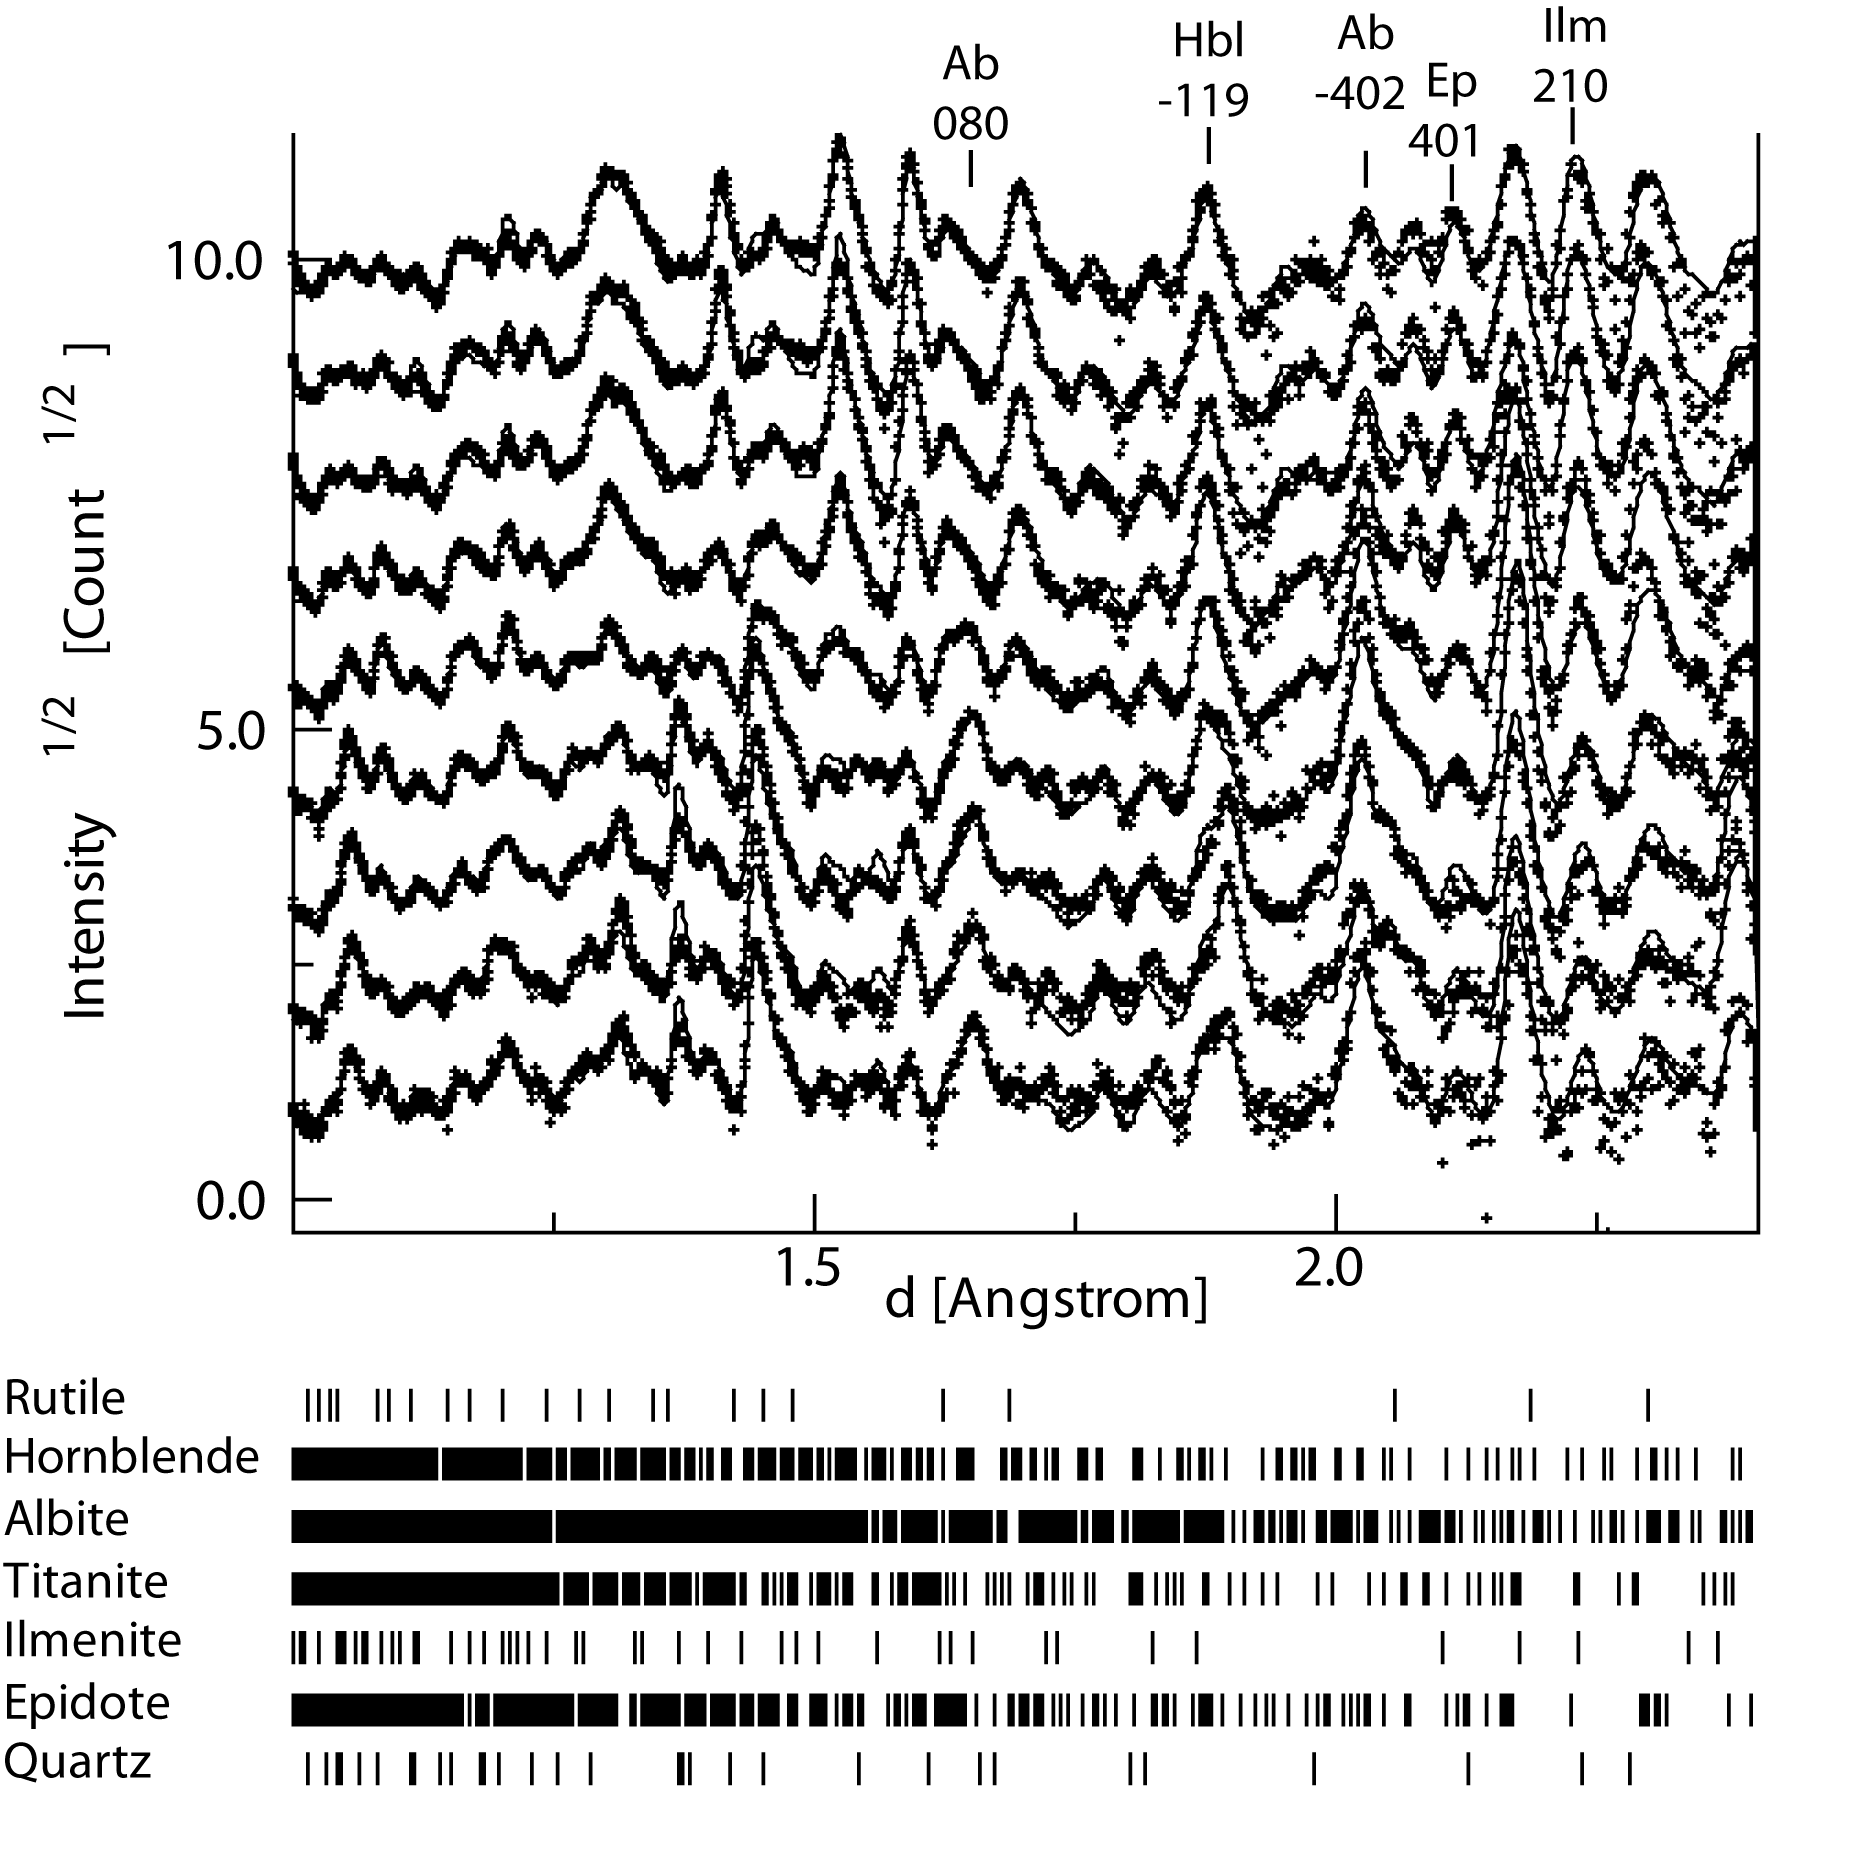
The oriented cylinder was fully immersed in the neutron beam. For each measurement the sample was rotated around the cylinder axis (perpendicular to the incident neutron beam) into four positions (0°, 45°, 67.5°, 90°) to improve pole figures coverage. The total exposure time was 120 minutes per sample. TOF diffraction spectra, (Fig. 11) were analyzed with the Rietveld method as implemented in the software MAUD (Material Analysis Using diffraction; Lutterotti et al. 1999). We use MAUD to extract the orientation distribution function (ODF) from mineral phases, and used it in BEARTEX to calculate and plot pole figures (Wenk et al. 1998).
Figure 11. Diffraction spectra for ultramylonitic amphibolite, recorded in HIPPO-neutron diffractometer.

Example of diffraction spectra for ultramylonitic amphibolite, recorded in HIPPO-neutron diffractometer. Relative intensity variations illustrate the presence of texture. Some important peaks are indexed (1st setting, Matthies and Wenk, 2009). Dots represent measured data, and solid lines the results of Rietveld refinement. Peak position for each mineral phase appears at the bottom illustrating the strong overlapping of peaks.
In the Rietveld refinement, crystallographic structures (CIF files) were required. For monoclinic phases, the first setting has to be used, in both MAUD and BEARTEX (Matthies and Wenk, 2009), which requires some transformations. For representations in this article we use labels for second setting (i.e., [010] is the 2-fold axis). It should be noted that due to the low crystal symmetry of major components, for example, hornblende (monoclinic) and plagioclase (triclinic), [100] [010] and [001] directions do not correspond to the pole of the respective crystallographic plane (100) (010) (001), except for [010] in the monoclinic system. Poles of (20-1) (010) (-102) and (-401) (010) (-104) were used as the best approximation to [100] [010] and [001] directions for plagioclase and amphibole, respectively (Xie et al. 2003; Gómez Barreiro et al. 2007c). In the case of epidote and titanite, poles to (201), (010), (102) and (102), (110), (111) were used respectively. When considering mineral composition and diffraction data, we used hornblende (C/2m) as a general structure for the calcic amphibole, epidote (P21/m), albite (P-1), titanite (P2), ilmenite (R-3), quartz (P3121) and rutile (P42/mmm) structures as the starting point for Rietveld analysis (Gómez Barreiro et al., 2010a).
TOF diffraction spectra collected at different angles are showed in Fig. 11. Extreme peak overlaping and variation of relative intensities (Texture) are evident. Volume fraction of each mineral phase was calculated in several thin sections, and refined in MAUD during texture analysis.
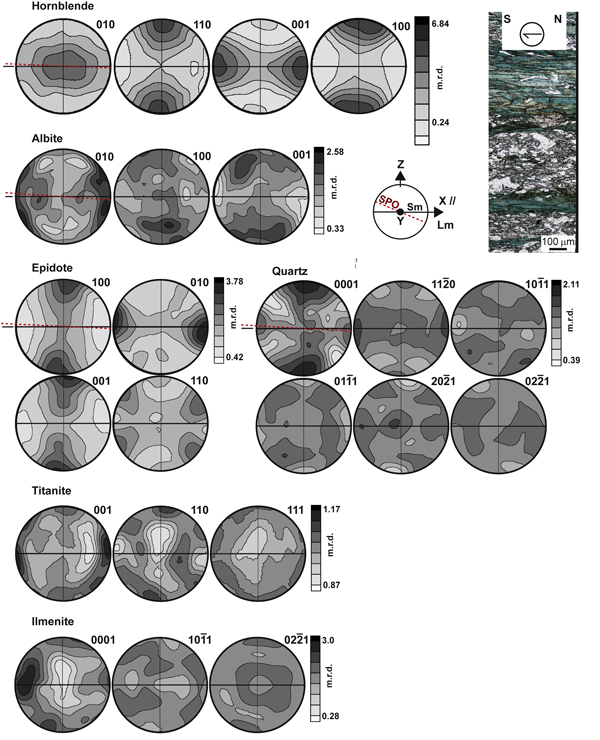
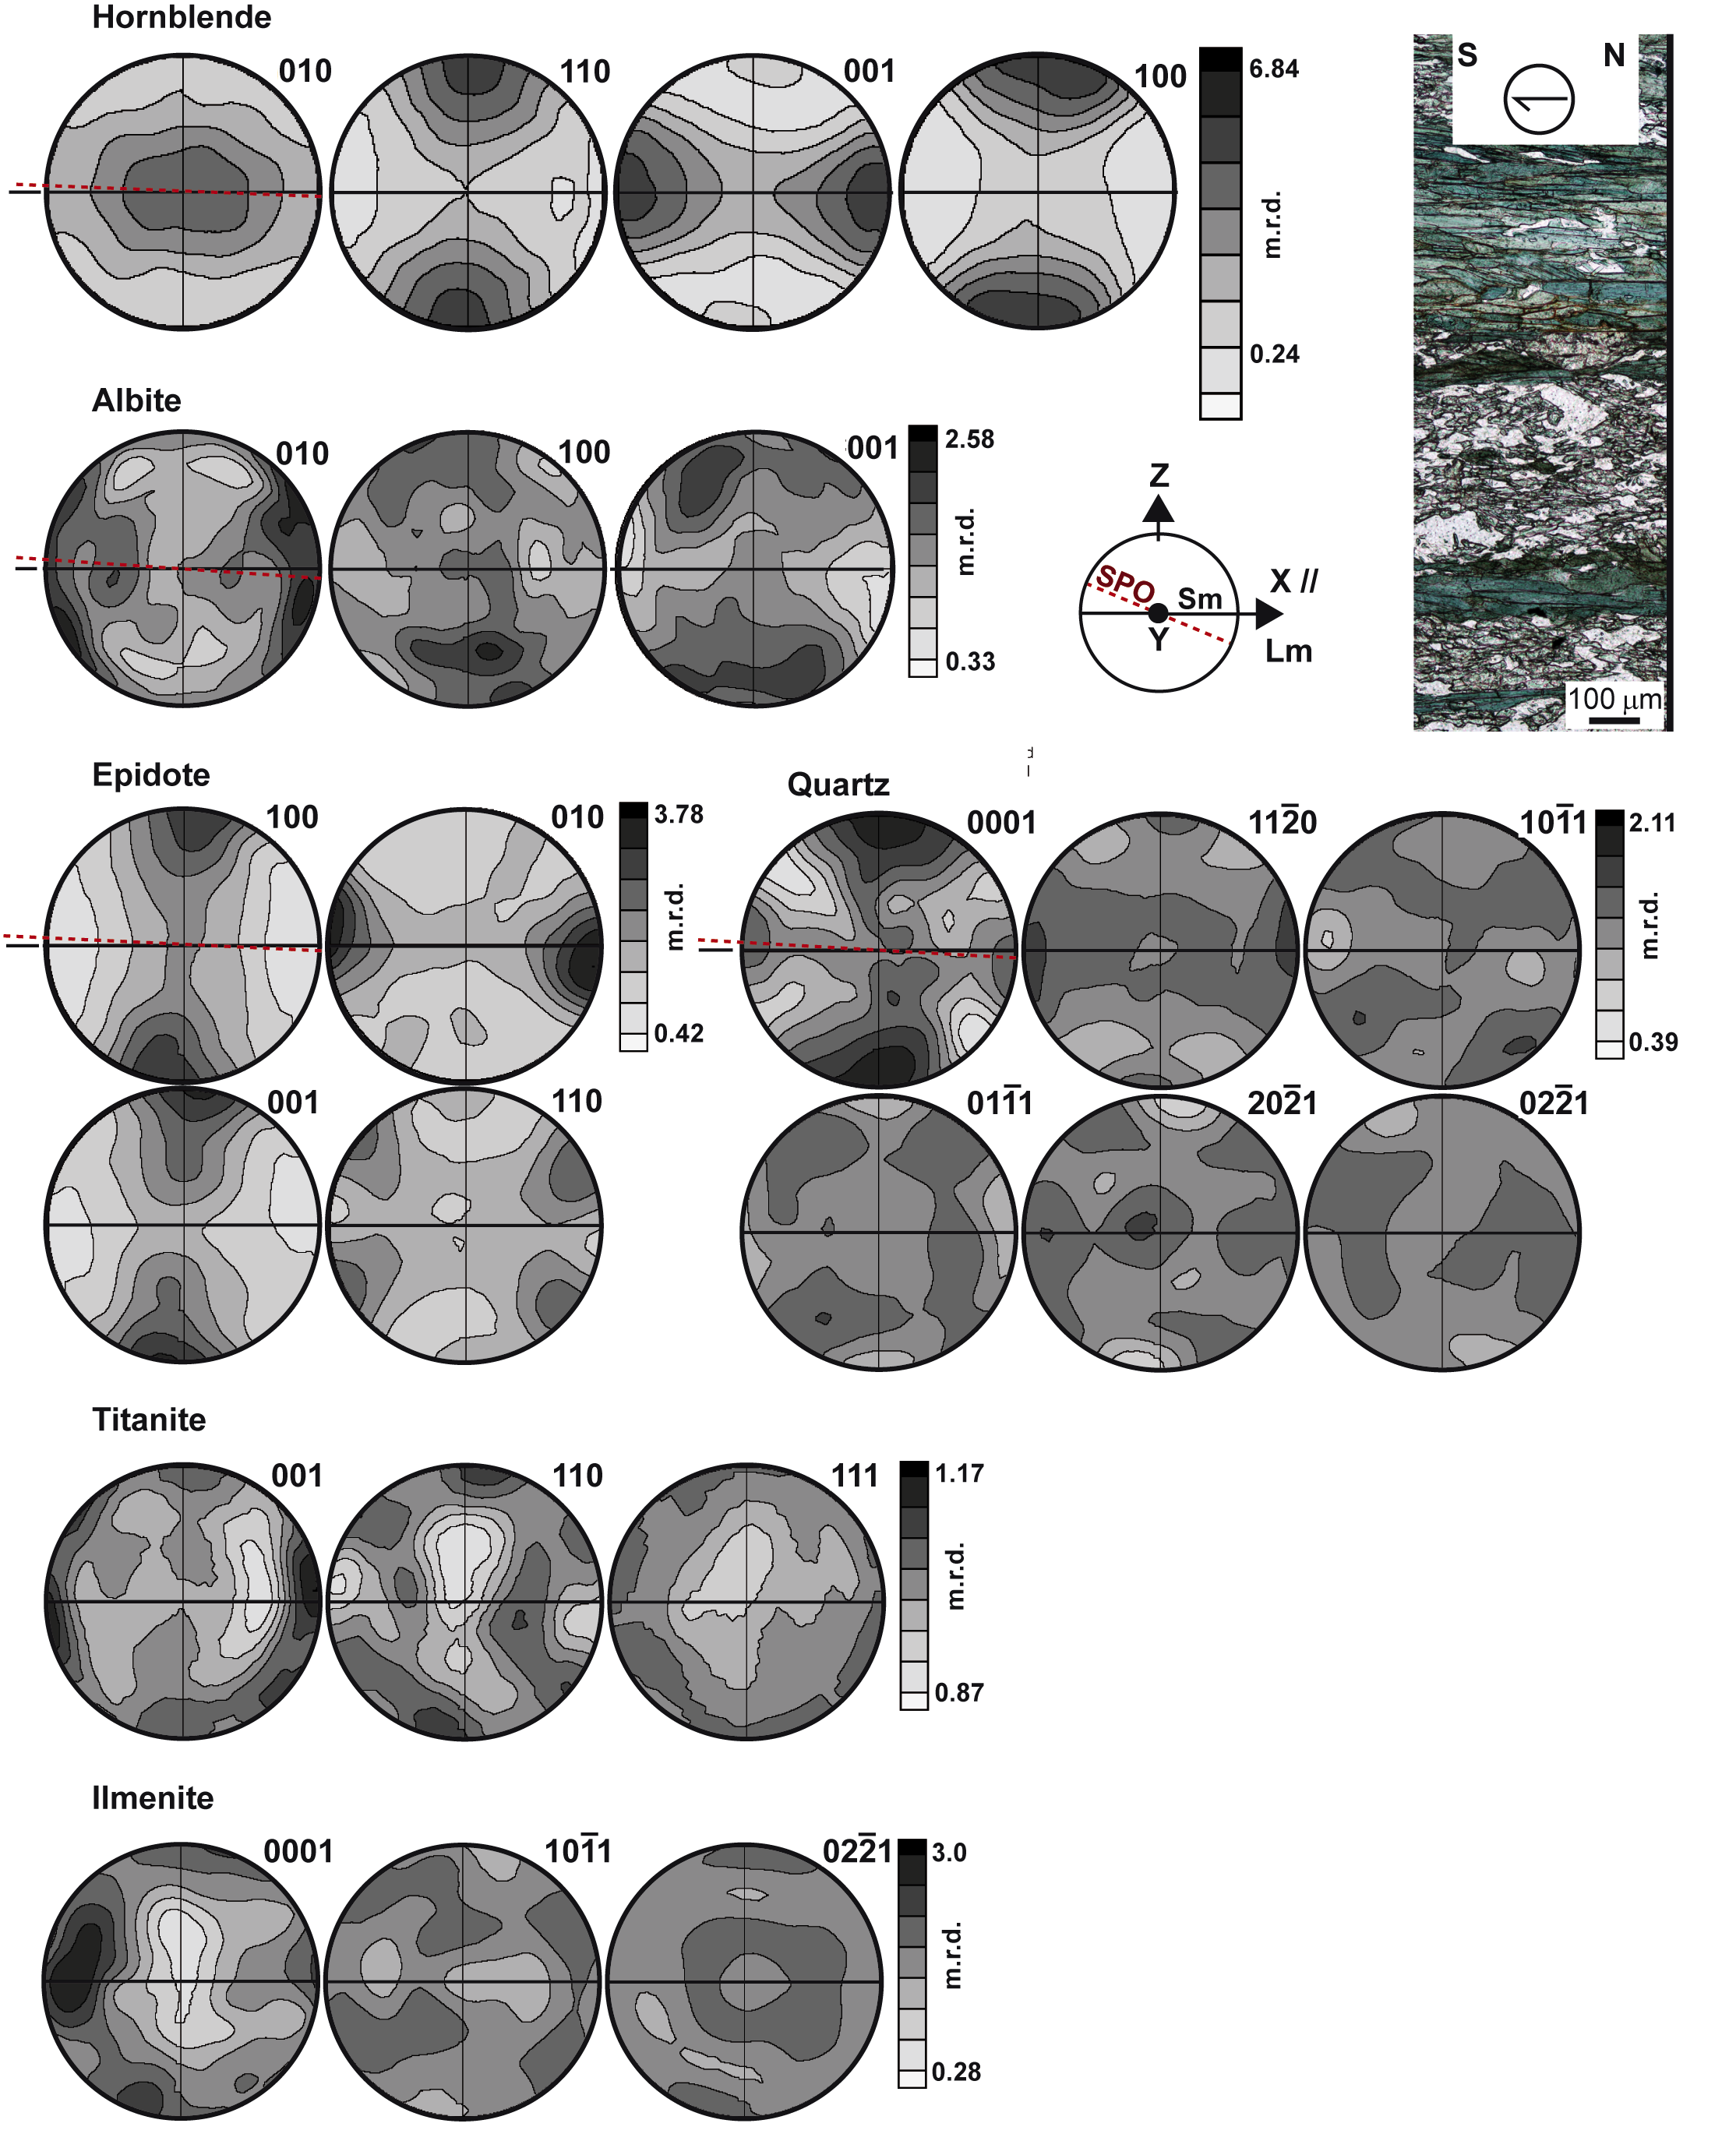
Amphibole: In ultramylonitic domains blue/green amphibole (am2) is ~ 60% by volume. We use the hornblende structure for calcic amphibole am2. Hornblende has a strong crystallographic preferred orientation or texture, with an orthorhombic or slightly monoclinic symmetry, moderate to strong (6.84 m.r.d., multiples of a ramdom distribution) (Fig. 12). The [001] direction is parallel to the lineation (X) and (100) planes are parallel to the SPO which forms a small angle to the mylonitic foliation (Sm). The [010] direction defines a maximum centered on the Y-axis and elongated along SPO plane. This geometry correlates well with previous studies of amphibole textures (e.g., Gapais and Brun 1981; Siegesmund et al. 1989, 1994; Kruhl and Huntemann 1991; Ji and Salisbury 1993; Ji et al. 1993; Barroul and Kern 1996; Zucali et al., 2002; Imon et al., 2003; Ivankina et al. 2005; Díaz Azpiroz et al. 2007; Tatham et al. 2008; Gómez Barreiro et al. 2010a).
Figure 12. Pole figures from TOF-neutron diffraction analyses of ultramylonitic amphibolite.
Pole figures from TOF-neutron diffraction analyses of ultramylonitic amphibolite sample Equal area projection. Log contours: units in multiples of a random distribution (m.r.d.). Reference system as in Fig. 4.
Plagioclase: Pole figures in albite are complex and depict some degree of monoclinicity. Main features include the cluster of [010] around X-axis (lineation), while [100] and [001] appear projected close to Z-axis (~20-35º; Fig. 12). This phase represents about 14-20% by volume in the ultramylonitic domain.
Epidote: with about 20% volume fraction of the sample, this mineral has a moderate texture (3.78 m.r.d.). Pole figures symmetry are somewhat monoclinic with respet to the mylonitic foliation (Sm). The [010] axis appears parallel to the lineation, while (100), and (001) plot close to the pole of the foliation.
Quartz: this phase is present in about 5-10% in ultramylonitic domains, and shows a weak to moderate texture (2.11 m.r.d.), with basically orthorhombic pole figures, where (0001) poles define a strong máximum parallel to the foliation plane (Z), and a submaximun parallel to the lineation. The (11-20) plane and positive and negative rombs, plot accordingly (Fig. 12)
Titanite and Ilmenite: The volume fraction of these phases is low, but diffraction experiment returned some workable diffraction peaks, resulting in reasonable textures which correlate well with microscopic observations. Preferred orientation of titanite and ilmenite reproduce the orientation of individual grains, with their c-axis parallel to the lineation. A relatively strong minimum in titanite (0.87 m.r.d.) indicates that there is a large number of crystals randomly oriented.