Dihedral Angles in Non-Equilibrated Rocks
The effect of deformation on dihedral angles
While the distribution of liquid under hydrostatic conditions is controlled by the equilibrium dihedral angle (with complete interconnectivity of liquid in channels along 3-grain junctions for angles below 60˚), melt films on grain boundaries may develop during ductile deformation (Borsch and Green, 1990; Jin et al. 1994; Bai et al., 1997; Hier-Majumder and Kohlstedt, 2006). These melt films are only stable under static conditions if the dihedral angle is zero, and this is not the case for geological materials. Thus the effective dihedral angle is zero during the deformation. Once deformation has ceased, the melt will regain its equilibrium geometry (c.f. Parsons et al., 2008).
Jin et al. (1994) and Bai et al. (1997) found this wetting effect only with recrystallisation-accompanied dislocation creep, suggesting that the deformation mechanism is important in determining the melt geometry. However, this is not universal: Gleason et al. (1999) found that melt-solid-solid dihedral angles in experimentally deformed quartzo-feldspathic aggregates were similar to those present during hydrostatic annealing. Neither Dimanov et al. (1998) nor Hirth and Kohlstedt (1995a, b) found melt films, in deformed synthetic labradorite and olivine respectively, regardless of deformation mechanism. The controls on melt film formation are as yet not understood.
Deformation may also affect the topology of the fluid phase if overpressure leads to hydrofracture. Grain boundaries can be temporarily wetted (i.e. an effective dihedral angle of zero) but these continuous films neck down into isolated pores once deformation has ceased (e.g. Kostenko et al., 2002).
Dihedral angles during prograde events
Microstructures formed during reaction (or deformation) are likely to have been overprinted during uplift. The most obvious example of this is in rocks that have undergone partial melting during regional metamorphism: such rocks (migmatites) are now fully solidified with loss of the original melt-bearing microstructures during crystallization (Sawyer, 1999). We can infer what they might have looked like using experiments (Mehnert et al., 1973) or examples of rapidly-cooled partially melted rocks (e.g. Cesare et al. 1997; Holness et al., 2005b) but much of the following is based on inference from fully solidified rocks.
Melt-solid-solid dihedral angles
Where the reaction overstep is significant, the driving force for chemical equilibration will be larger than that driving textural equilibration: melt distributions and the melt-solid-solid dihedral angle population will therefore be controlled by reaction kinetics rather than interfacial energies. It is only when the overstep is small that the rates of reaction are sufficiently slow for the texture to remain in equilibrium. This is illustrated by a series of heating and cooling experiments in the system diopside-anorthite, in which significant hysteresis was observed in the diopside-melt dihedral angle (Ikeda et al. 2002). Under isothermal conditions the dihedral angle decreases with temperature (due to changes in the melt composition). However, during heating the angle decreases below equilibrium values, and during cooling the angle increases beyond the equilibrium value. The extent of departure from the equilibrium values increases as the rate of temperature change increases. This hysteresis is explained by the development of compositional boundary layers around the diopside grains that are either enriched (during heating) or depleted (during cooling) in the diopside component thus leading to angles either lower or higher than those expected for equilibrium. Ikeda et al. (2002) point out that this hypothesis necessitates significant mass transport within the boundary layer either towards or away from the melt-solid-solid junction, although they provide no information about changes in curvature of the interfacial boundaries near the junctions. If correct it may have important implications for melt-bearing systems: this type of problem warrants further investigation.
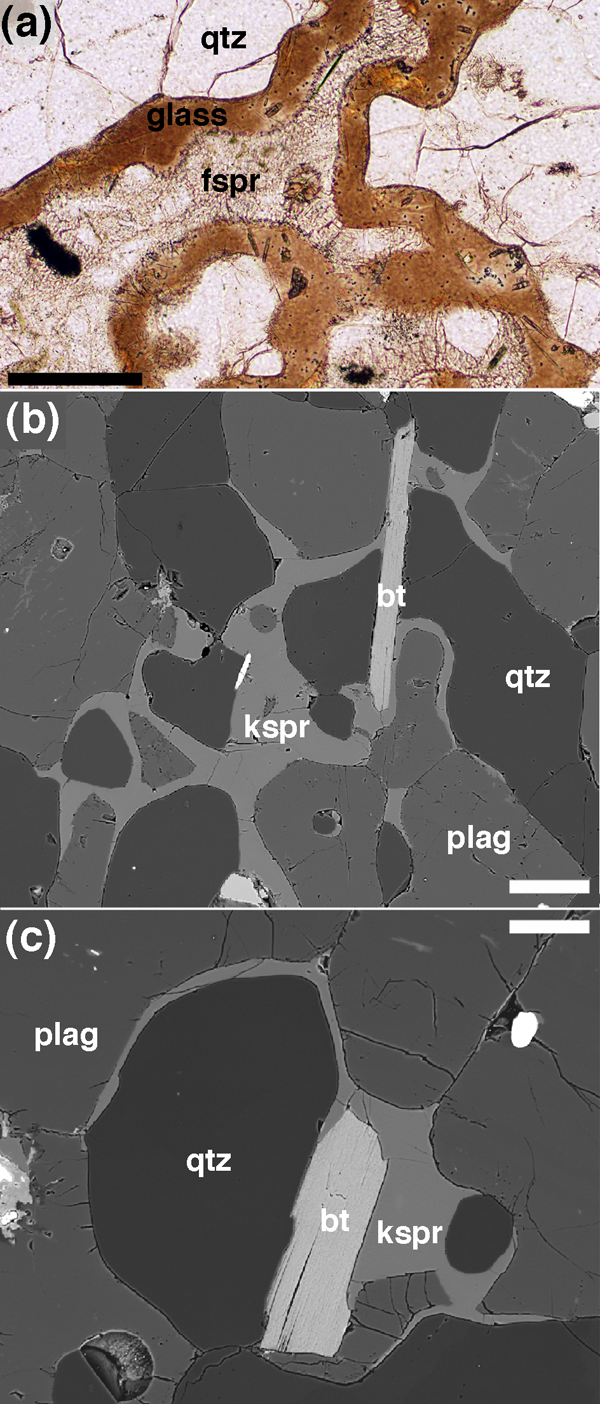
In the case of a previously melt-free rock such as a migmatite, experimental studies and observation of rapidly quenched pyrometamorphic rocks show that in the earliest stages of melting melting on grain boundaries between the reacting phases forms a generally parallel-sided liquid film (Mehnert et al., 1973; Holness et al., 2005b). Grain boundaries intersect the melt film at ~ 180˚ (Figure 4a). Some melting reactions involve three phases and in this case the melt film may propagate along grain boundaries with a correspondingly small angle at the tip (Figure 4b; Holness and Sawyer, 2008).
Figure 4. Melt-solid-solid dihedral angles in melting rocks
Melt rims from the aureole of the Glenmore plug, Ardnamurchan, separating polycrystalline quartz patches from partially melted (sieve-textured) feldspar (Holness et al., 2005b). There are no indentations where any of the quartz-quartz grain boundaries meet the melt film; the effective dihedral angle is 180˚. Scale bar is 200 μm long. (b) and (c) Migmatite from the Ashuanipi Province, Quebec (sample number DL97-1006A), in which the melt (formed by the reaction biotite + plagioclase + quartz = orthopyroxene + melt; Sawyer, 2001) has been pseudomorphed by K-feldspar. Note how the melt films separate reacting phases, foming low dihedral angles where the propagating melt films pinch out. Scale bar 50 μm long in both images.
Solid-solid-solid dihedral angles
The variation of solid-state angles during prograde events is a relatively neglected topic, despite its potential for constraining thermal history (e.g. Harker and Parker, 1945) and its importance in interpreting the effects of recrystallisation and over-printing of microstructures formed in the presence of melt. During reaction in the solid state (i.e. metamorphic reactions forming new solid phases) one might expect the dihedral angles between grains of the product phases to be formed by the expediencies of crystal growth and replacement: angles will be determined more by the easiest crystal faces to grow, rather than by interfacial energies (Figure 5). This is borne out by variations in the population of true dihedral angles at three-grain junctions in quartzites. Voll (1969) measured quartz-quartz-quartz junctions in sedimentary rocks and found that they varied considerably (<60 – 180˚, as reported by Leibl et al., 2007) about the median value of 120˚. The spread of angles decreases during metamorphism: triple junction angles in deformed quartz aggregates which have undergone dynamic recrystallisation and annealing have a narrower spread of 65 - 178˚ (Leibl et al., 2007), and this is reduced to 97 – 144˚ in texturally equilibrated granulites (Vernon, 1968). This reduction of the spread is likely to reflect an approach to equilibrium of an initially non-equilibrated distribution and has potential for quantification of thermal histories.
The morphology of forsterite grains formed as a result of contact metamorphism of silicic dolomites by the Beinn an Dubhaich granite changes as a function of distance from the forsterite-in isograd. Grains at the isograd are commonly cuspate and irregular, while those closer to the granite are rounded. This change in morphology is accompanied by an increase in median (apparent) dihedral angle from 105˚ to 165˚ (Holness et al., 1989). The low median values near the isograd have been interpreted as a consequence of the olivine pseudomorphing an original fluid-filled porosity (Holness et al., 1989; Holness et al., 1991) although it is possible that they preserve an early disequilibrium population formed during rapid reaction. The variation of angles towards the contact is interpreted as progressive textural equilibration, and analysis of the variation suggests the data are consistent with equilibration via a diffusive process (Holness et al., 1991).
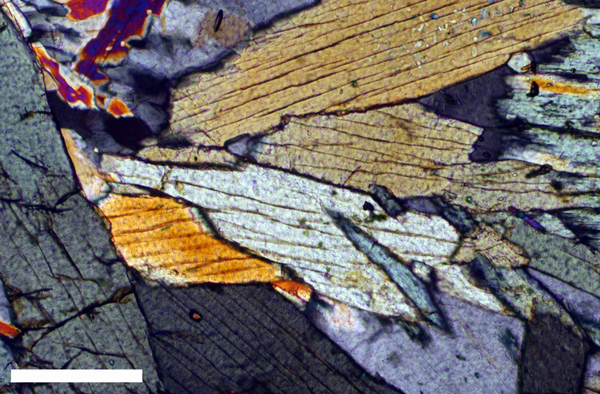
Figure 5. Solid-solid-solid dihedral angles during metamorphic reaction
Glaucophane eclogite, Syros. The angles formed at three-grain junctions are created during reaction and have no bearing on the balancing of interfacial energies. Sample 97666 from the Harker collection, Cambridge University. Scale bar is 200 μm long.
Dihedral angles during retrograde events
We need to consider both the melt-solid-solid dihedral angle and the solid-solid-solid dihedral angles. Consideration of the latter is important because we are generally presented with a fait accompli in that all plutonic rocks, and many volcanic rocks are completely crystalline – we need to be able to interpret the record left in the dihedral angles. For this we need to understand how three-grain junctions are formed during solidification.
Melt-solid-solid dihedral angles
Melt-solid-solid angles in actively crystallizing systems generally vary between the two end-points of impingement (Elliott et al., 1997; Holness et al., 2005a) and equilibrium (Figure 6). During active crystallization, the random impingement of planar-sided grains results in a melt-solid-solid dihedral angle population with a high standard deviation (20-30˚) and a median of ~ 60˚ (since the internal angles of a triangle sum to 180˚). The angle distributions of samples K96-006 and Kameni (Figure 2, Table 2) are typical of impingement textures, and are distinct from those in equilibrated rocks (c.f. Figure 3). Holness et al. (2005a) demonstrate that the dihedral angle populations in a single suite of crystal-rich enclaves form a continuum between the two endpoints during textural equilibration of the sub-volcanic crystal mush. The population of dihedral angles varies smoothly from the original impingement texture to equilibrium (typically 20-30˚ with low standard deviation) in a continuous progression. The angle population therefore gets narrower as it approaches equilibrium. Exactly where an individual enclave sits on this spectrum depends on the relative rates of crystal growth and textural equilibration - this has not yet been quantified.
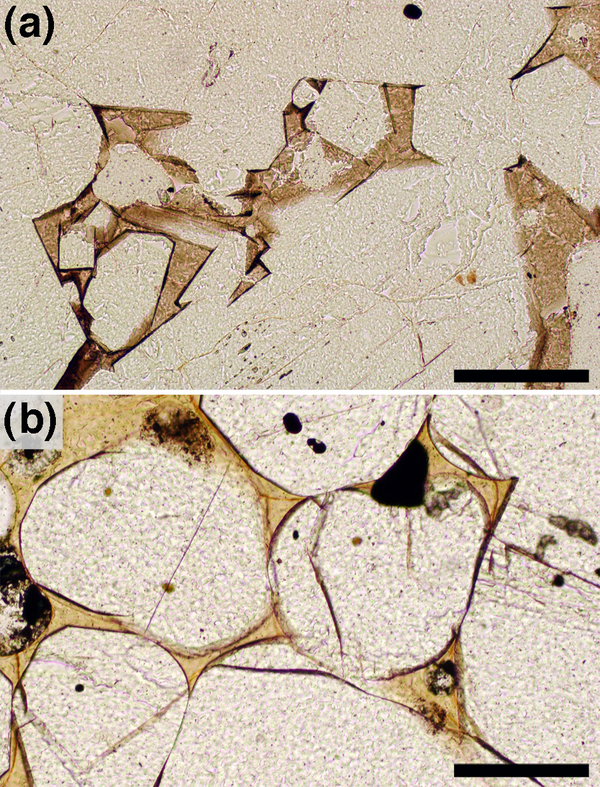
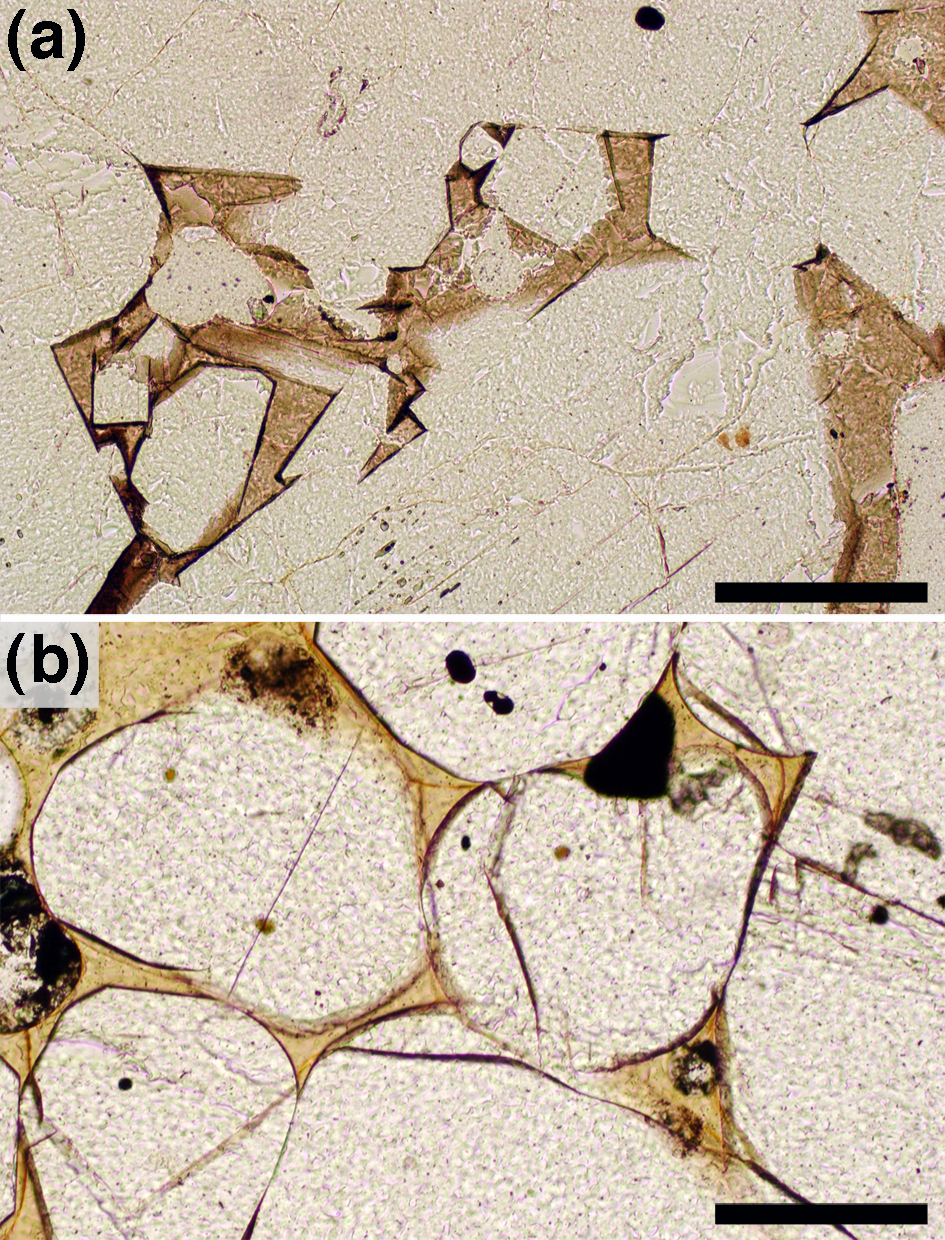
Figure 6. Impingement vs. equilibrium in glassy nodules
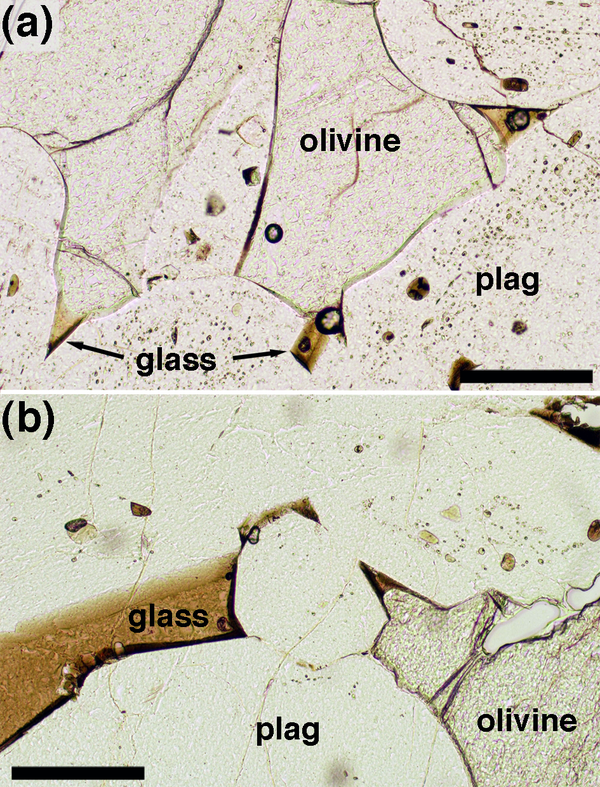
(a) glassy gabbroic nodule entrained in a basaltic lava flow, Iceland. The plagioclase crystals (clear) are randomly juxtaposed, with their planar growth faces making widely varying angles at the corners of the melt-filled pores (brown glass). Scale bar is 200 μm long. (b) Glassy nodule entrained in basaltic flow, Hawaii. The olivine grains (clear) are rounded, with smoothly curved interfaces against the melt (brown glass). The equilibrium melt-olivine-olivine dihedral angle is developed at pore corners. Scale bar is 200 μm long.
Consideration of melt-solid-solid dihedral angles must take into account the possibility that diffusion-limited growth may significantly modify the geometry of pore corners. During active growth within a crystal framework the rate of growth of the solid phase near pore junctions decreases as the nearby melt becomes depleted in the necessary chemical components. This limitation is less marked for those parts of the grain further from the junction – these can therefore continue to grow. The effect of this localized diffusion-limited growth is to create curved solid-melt interfaces and a lower dihedral angle (Figure 7). The angle distribution is indistinguishable from those formed by progressive textural equilibration in melt-bearing enclaves (Holness et al., 2005c). The two processes of textural equilibration and diffusion-limited growth can be distinguished if the pore walls display evidence of growth instabilities and protuberances characteristic of diffusion-limited growth.
Figure 7. The effects of diffusion-limited growth at pore corners
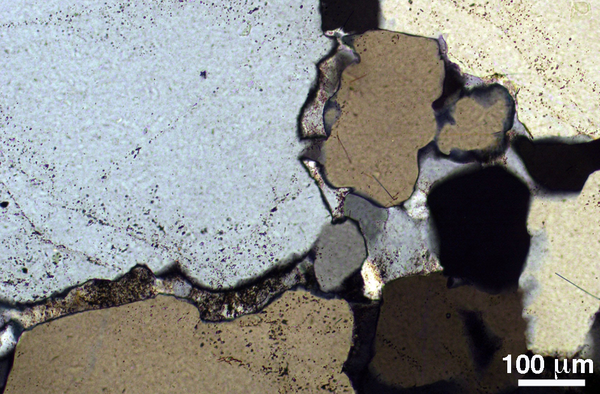
Detail of the junction between two plagioclase grains in a glassy nodule from the Kameni Islands, Santorini. Note the progression of the growth faces, marked by faint lines in the margins of the plagioclase grains. Progressive starvation of the plagioclase grains in the immediate vicinity of the two-grain junction, due to the limitations imposed on growth by diffusion in the melt, have resulted in curvature of the plagioclase-melt interface. A distinction can be made between this and true textural equilibration because here diffusion-limited growth has also resulted in destabilization of the plagioclase-melt interface, leading to growth of protuberances. The scale bar is 200 μm long.
Solid-solid-solid dihedral angles
Solid-solid-solid dihedral angles formed during cooling of melt-bearing rocks are formed during solidification. Microstructures in solidified igneous rocks have been the subject of considerable attention and depend on cooling rate and the order in which the liquid becomes saturated in the various solid phases (e.g. Wager et al., 1960; Hunter, 1987; 1996; Vernon, 2004). The simplest system (although not widely applicable) is that in which only a single phase nucleates and grows – here solidification involves growth and impingement of individual crystals. Elliott et al. (1997) investigated the angle distribution formed by the growth and impingement of isotropic single-phase aggregates using computer simulations. They demonstrated that the population of apparent angles measured in a 2-D section through an artificially grown aggregate has a median of 120˚ and a spread very similar to that of a normal distribution of true angles with a standard deviation of 20˚. They did not present the populations of true angles so their results cannot be compared directly with those of Voll (1960).
In systems in which more than one phase crystallizes, the phase arriving first on the liquidus generally forms grains with a shape controlled variably by kinetic constraints (leading to growth facets) or minimization of interfacial area (leading to shapes with variable proportions of curved and planar surfaces, depending on the degree of anisotropy of interfacial energy). The balance between these two end-members depends on the relative rates of crystal growth and textural equilibration – this has not yet been quantified but has potential to constrain cooling rates of phenocryst-bearing magmas. If sufficient grains accumulate they may aggregate to form a framework before the next phase arrives on the liquidus. In such a case the second phase nucleates and grow in the pore spaces. Clearly, as more phases are added to the liquidus assemblage solidification progressively involves simultaneous growth of an increasing number of phases. Elimination of the remaining melt between grains, and therefore the establishment of the initial solid-solid-solid dihedral angle, is a complex interaction between the competing phases at the junction and involving transfer of unwanted chemical species to other growth sites (Figure 8). The details of this process are currently poorly understood.
To date all attention has been focused on slowly cooled melt-bearing rocks, primarily perhaps because the grain size is sufficiently large that meaningful observations can be easily made. It is clear that in many rocks formed by solidification over long time scales (i.e. plutonic igneous rocks and regional migmatite terrains) microstructures are typified by low solid-solid-solid dihedral angles.
Much of the published work on dihedral angles in igneous rocks has been concentrated on augite-plagioclase-plagioclase junctions in gabbros (e.g. Holness et al., 2007a; Holness and Winpenny, 2009). The angle populations in shallow crustal mafic intrusions are generally far from equilibrium, with medians as low as 65-70˚ and standard deviations of the order 25˚. These low angles are explained as a consequence of the augite infilling and pseudomorphing the original melt-filled porosity, inheriting the impingement texture (Figures 9a, b, c; Holness et al., 2005a). Gabbros containing angles with a higher median and lower standard deviation (Figures 9d, e, f) are thought to have undergone significant sub-solidus textural re-equilibration of the augite-plagioclase-plagioclase junctions (Holness et al., 2005a). An alternative possibility is that slower cooling resulted in simultaneous growth of plagioclase and augite at the junction (e.g. Figure 8a) and hence a higher angle.
The other type of slowly cooled rock that has been studied extensively is migmatite. Solidified melt pools in migmatites are typified by cuspate grains with low dihedral angles (Figure 10) thought to have formed by pseudomorphing of an original melt-filled pore by phases crystallizing from the melt (e.g. Platten, 1981; Harte et al., 1993; Sawyer, 1999; Clemens and Holness, 2000; Holness and Sawyer, 2008). The current explanation for this phenomenon is based on the effect of pore size on crystal nucleation and growth.
Figure 8. The infilling of melt-filled pores during solidification
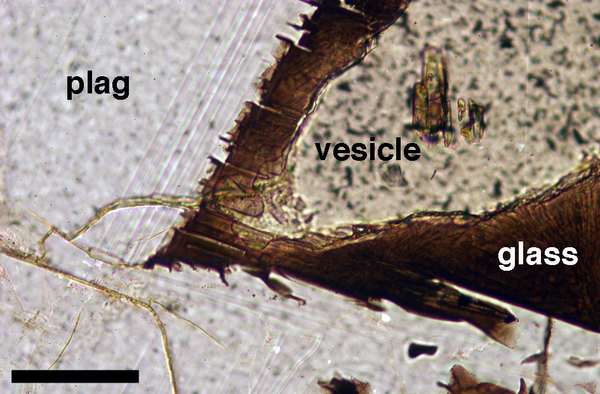
Glassy olivine gabbro nodules entrained in a lava flow, Iceland, illustrating the details of melt pockets partially infilled by olivine. Scale bars in both images are 200 μm long. (a) Note how the olivine-plagioclase grain boundaries curve towards the planar-sided pockets of melt (now glass), indicating simultaneous growth of both phases. (b) The olivine grain appears to be growing towards the plagioclase-plagioclase junction with little or no associated growth of the plagioclase. If this were to continue to completion, the olivine would inherit the impingement angle.
Figure 9. Textural progression in gabbros
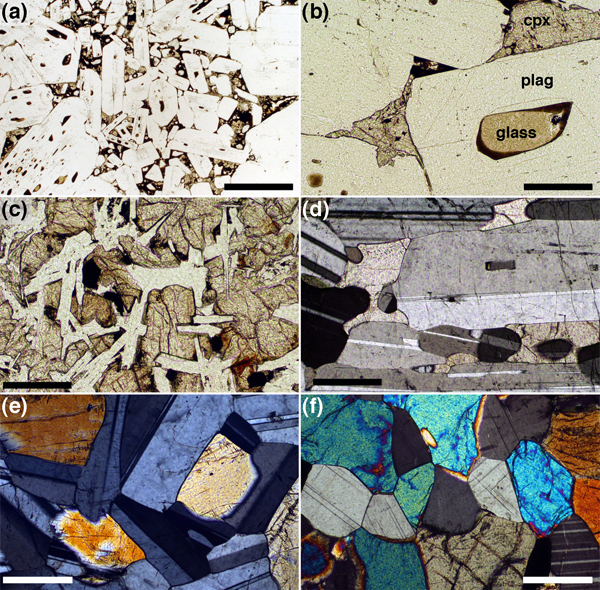
Images of gabbros showing the progression from the melt-bearing stage with active solidification and crystal growth to solid-solid-solid textural equilibrium. (a), (b) and (c) Glassy gabbro nodules entrained in basaltic lava flow, Iceland. (a) Impingement texture formed by random juxtaposition of plagioclase primocrysts. The spaces between are filled variously with glass, vesicles and augite. Scale bar is 1 mm long. (b) Detail of gabbro nodule showing augite partially infilling the space between the plagioclase grains, inheriting the impingement angle in three places, while melt remains at the fourth. Scale bar is 200 μm long. (c) Almost fully solidified gabbroic clot in basaltic lava. Note the randomly oriented plagioclase grains and the impingement angles inherited by the augite. Scale bar is 200 μm long. (d) Troctolitic gabbro from the Eastern Layered Series, Isle of Rum, with interstitial augite. This is sample A041 from the Unit 9 allivalite, subjected to metasomatic infiltration of primitive melt (Holness, 2005; Holness et al., 2007b). The median augite-plagioclase-plagioclase dihedral angle in this sample is 84˚. Scale bar is 200 μm long. (e) Gabbroic cumulate, Rum, in which the augite-plagioclase-plagioclase dihedral angle is intermediate between that of impingement and solid-solid textural equilibrium. Scale bar is 200 μm long. (f) Granulite, sample 11787 from the Harker Collection of Cambridge University. The augite-plagioclase-plagioclase dihedral angle population in this sample is in textural equilibrium (see Table 2 for details). Scale bar is 200 μm long.
Figure 10. Cuspate grains in migmatite
Quartz-feldspathic migmatite from the aureole of the Ballachulish Complex, Scotland. The (dusty) feldspar forms cuspate grains on quartz-quartz grain boundaries and at quartz three-grain junctions, indicative of crystallization from a melt phase.
Because the free energy of an interface is a function of its curvature, the supersaturation required to stabilize a small grain growing from a liquid is greater than that required for a larger grain (Cahn, 1980; Adamson, 1990). This effect is what drives Ostwald ripening during initial growth of crystals in a liquid, and means that solidification of a melt phase in a small pore occurs at a lower temperature (i.e. a greater undercooling) than that in a large pore (e.g. Bigg, 1953; Melia & Moffitt, 1964; Cahn, 1980; Scherer, 1999; Putnis and Mauthe, 2001; Cesare et al., 2009). It means that the continued growth of the olivine grains into the melt-filled pockets shown in Figure 8 requires greater and greater departures from equilibrium (i.e. undercooling) since this growth requires the reduction of the radius of curvature of the olivine-melt interface. The consequence of this delay in crystal growth in the smallest pores means that instead of the simultaneous growth of several phases seen in the larger pores (and as described by the equilibrium phase diagram), small pores tend to crystallise by initial overgrowth of the pore walls followed by nucleation and growth of another phase in the remaining pore space (Holness and Sawyer, 2008). If there is sufficient delay before the pore is pseudomorphed, textural equilibration may occur, leading to the pseudomorph inheriting a low dihedral angle and thus the cuspate grain shape so typical of migmatites (Figure 11).
Figure 11. Sequential crystallization in poly-saturated melts
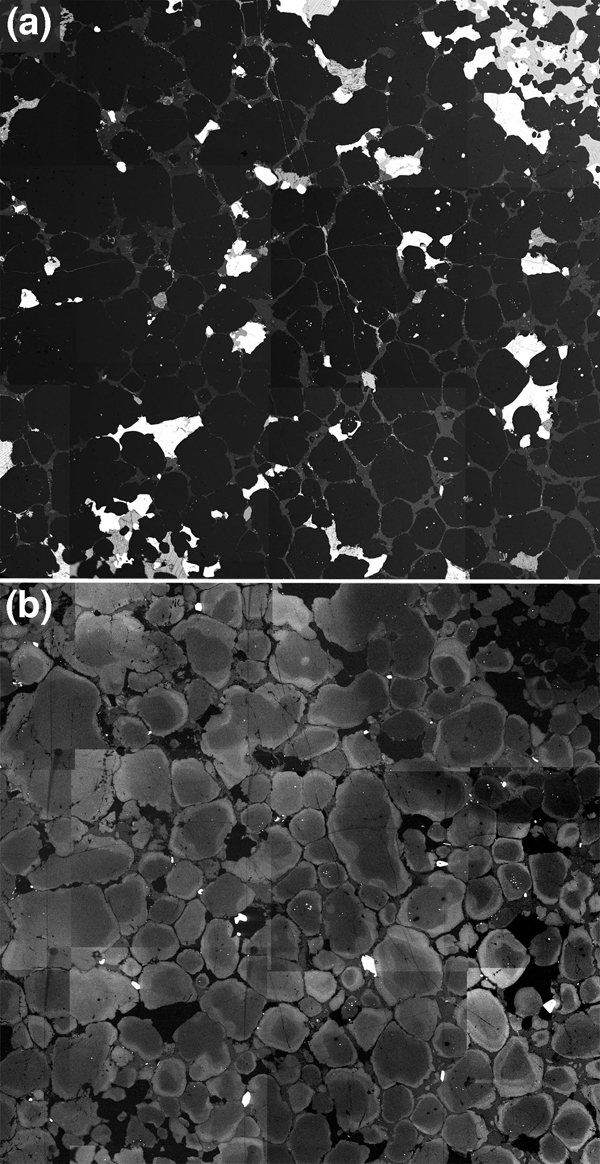
(a) BSE image and (b) CL image of a sample of Fe-oxide, plagioclase and amphibole bearing quartzite from the Biwabik Formation, metamorphosed at 2kbar in the western part of the aureole of the Duluth Igneous complex, Minnesota. The BSE image shows the distribution of the plagioclase (pale grey) and the rounded quartz grains (dark grey), with oxide and amphibole grains (white). Note how the morphology of the plagioclase mimics that expected for a texturally equilibrated melt phase. (b) The same area imaged in CL. As an approximate guide, the brightness of the quartz in CL correlates with the temperature at which it crystallized. Thus the dark cores are restitic while the bright rims crystallized at high temperatures. From this it becomes clear that the quartz component of the melt phase has overgrown the restitic quartz grains, leaving the plagioclase to crystallise and pseudomorph the remaining porosity. Both images are 1cm across.
Does rock fabric have an effect on disequilibrium dihedral angle populations?
Figure 12. The effects of fabric on dihedral angles
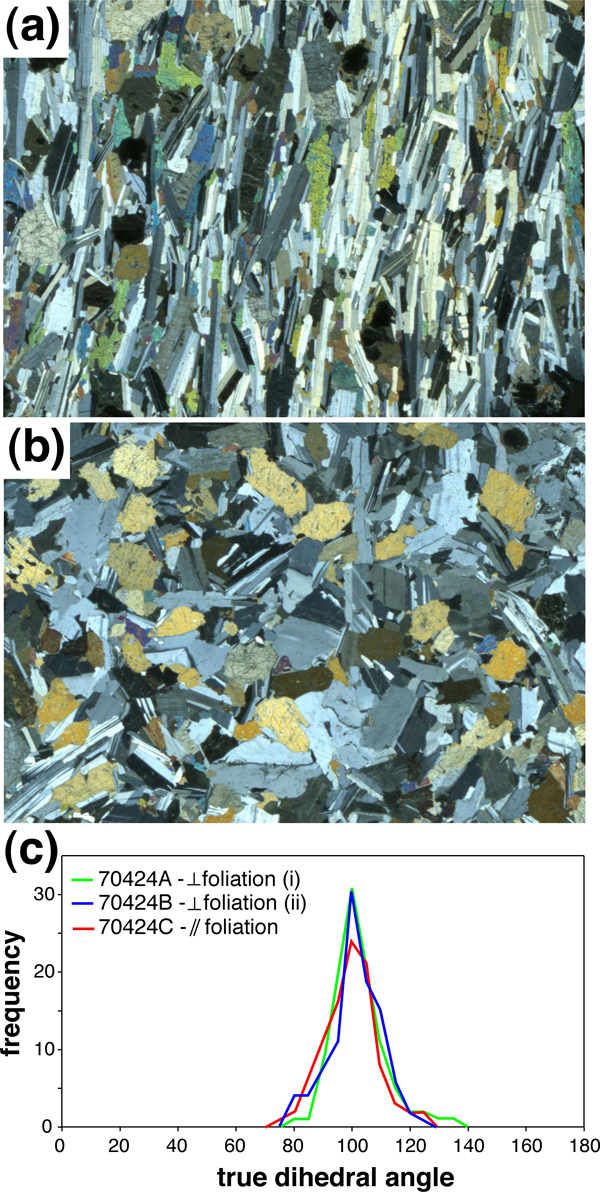
(a) Foliated gabbro from the Stillwater Intrusion, Montana, cut perpendicular to foliation (sample 70424A). (b) The same sample, cut parallel to the foliation (sample 70424C). Both images are 24mm across. (c) Frequency of true augite-plagioclase-plagioclase dihedral angles in three mutually orthogonal thin sections of sample 70424. See Table 6 for statistical analysis of the results.
It is well understood that the melt topology and permeability of melt-bearing texturally equilibrated rocks with a strong fabric (a preferred mineral orientation) can be strongly anisotropic if one or more of the minerals in the rock is anisotropic with respect to interfacial energies (Waff and Faul, 1992; Laporte and Watson, 1995). However, the question of whether such an effect also exists in a non-equilibrated rock with a strong fabric has not yet been properly addressed. A preliminary attempt was made to investigate this, using a strongly foliated two-pyroxene gabbro from the Stillwater Intrusion Montana (sample 70424 from the Cambridge Harker Collection). Three mutually orthogonal sections were cut from this rock, two perpendicular to the foliation and one in the plane of the foliation. Up to 100 measurements were made of augite-plagioclase-plagioclase dihedral angles in each section (Figure 12). The median and standard deviations for these three populations are shown in Table 2, with errors on the median determined according to the method of Stickels and Hücke (1964). The median is the same within error for the three samples, and the standard deviation is also very similar.
Determination of whether two populations taken from different specimens differ significantly requires a nonparametric method if we don’t know the distribution functions of the angles in the two samples. Several of these exist, including Mood’s median test (now commonly regarded as obsolete), the Kolmogorov-Smirnov test and the Mann-Whitney U test.
The Kolmogorov-Smirnov test examines the maximum difference, D, between two data sets on a cumulative frequency plot and calculates the probability, P, that they come from the same underlying population. According to this test, the two datasets from the sections perpendicular to the foliation are more similar to each other than they are to the population of angles measured parallel to the foliation (Table 6). This result is backed up by the Mann-Whitney U test. The values of U for the pair of samples oriented perpendicular to the foliation are close to that expected for the null hypothesis (i.e. the hypothesis that the two populations are the same), while that for the pairs of samples each containing one perpendicular and one parallel to the foliation are further from that expected for the null hypothesis (Table 6). The (two-tailed) probability that the two samples perpendicular to the foliation are the same is higher than that for the other two pairings. However, the probabilities are all sufficiently high that the null hypothesis is still likely to be true (i.e. P >> 0.05).
These two statistical tests demonstrate measurable differences between the dihedral angle populations measured perpendicular and parallel to the foliation in this Stillwater gabbro, even though the median and standard deviations are indistinguishable. Although the observed effect is not important enough to affect studies based on comparisons of the median values (e.g. Holness et al., 2007a), the differences warrant further work to obtain a full understanding of the effects of crystalline anisotropy on disequilibrium dihedral angle populations.
Table 6. Comparison of augite-plagioclase-plagioclase dihedral angle populations
| Kolmogorov-Smirnov test | Mann-Whitney U test | |||||
|---|---|---|---|---|---|---|
| Statistical data for the comparison of augite-plagioclase-plagioclase dihedral angle populations measured in three mutually orthogonal thin-sections of a foliated gabbro from the Stillwater Intrusion, Montana. Sections A and B were cut perpendicular to the plane of the foliation while C was cut parallel to the plane of the foliation. | ||||||
| D | P | U for null hypothesis | Two-tailed probability P | |||
| A : B | 0.1 | 0.677 | UA = 5069 | UB = 4931 | 5000 | 0.865 |
| A : C | 0.149 | 0.208 | UA = 4268 | UC = 5432 | 4850 | 0.1471 |
| B : C | 0.127 | 0.384 | UB = 4269 | UC = 5431 | 4850 | 0.1471 |