Methodologies
Fission-track analysis
Fission tracks in apatite and zircon have been used in a wide range of studies in basin analysis since the early ’80, when many analysts moved from an absolute dating approach to a detailed definition of time-temperature paths (“thermochronology”). The most important difference with other low temperature indicators it that this methodology provides both temperature and time information. In fact, the annealing of fission tracks, particularly in apatite, can be used to reconstruct the thermal history of basins, from deposition and burial of sediments through subsequent cooling related to uplift and erosion. It is possible also to define localized temperature anomalies, such as those related to intrusions and to high-temperature fluids.
Fission-track dating is very similar to the other isotopic dating methods based on the decay of an unstable parent to a stable daughter atom. The age is function of the proportion between the abundance of the new stable isotope and the parent unstable atom. In fission-track dating methodology, these two quantities are substituted by the number of observable tracks and the amount of uranium present in the sample. Actually, the uranium content is determined through irradiation of sample with thermal neutrons in a nuclear reactor. Irradiation induces the artificial fission of 235U whose relative abundance in respect of 238U is constant in nature.
Both experimental data and the analyses on natural conditions have shown that tracks are shortened with increasing temperature (annealing process). The temperature range in which reduction of lengths occurs is known as Partial Annealing Zone (PAZ; Wagner and Van den Haute, 1992). According to this concept, temperatures of any geological setting are divided into three zones in respect to fission-track annealing:
• total annealing zone, in which the latent tracks are immediately erased after any fission event;
• partial annealing zone, where the ratio r/r0 increases from 0 to 1 with the decrease of temperature;
• stability zone, where tracks are stable.
Temperatures at which annealing actually occurs depend on the rate of the geological process and the PAZ temperature range can not univocally defined. For apatite, temperatures between 140 and 120°C are cited for the bottom whereas 70 to 40°C for the top of the PAZ. More precisely, Gleadow and Duddy (1981), on the basis of data obtained from drill holes samples in the Otway basin, suggest a PAZ between 145 and 80°C for heating events 1 Ma long, and between 110 and 45°C for events 1 Ga long.
Since the tracks are used as a dating methodology, the cooling range in the PAZ have to be necessarily “simplified” in a single temperature value, to which the age has to be referred, defined by Dodson (1976) as the closure temperature. Wagner and Reimer (1972) suggest that the closure temperature corresponds to the temperature at which 50% of the tracks are retained. As for the annealing boundaries, closure temperature is function of the cooling rate but it can be reasonably estimated only if a sample cools monotonically through the PAZ. Using Dodson's (1979) equation, Brandon et al., (1998) could calculate the following values: 128°C, 112°C, 98°C and 85°C for cooling rates of 100°C/Ma, 10°C/Ma, 1°C/Ma and 0.1°C/Ma respectively.
PAZ and closure temperature for zircon are not so well defined. However, a closure temperature of about 204°C is assumed for most common radiation-damaged zircon at cooling rates of 10°C/Ma (Reiners and Brandon, 2006).
Most data presented in this paper have been produced in the last fifteen years at Bologna University and CNR in Florence according to the following procedures. For details on analytical procedure see Zattin et al. (2002) and Balestrieri et al. (1996).
Apatite (U-Th)/He dating
Radiogenic He accumulated in apatite is lost by diffusion at even lower temperatures than the annealing of fission-tracks in the same mineral. Extrapolation of laboratory He diffusion experiments in apatite to geologic time (Farley, 2000), supported by evidence from borehole data (House et al., 1999), show that He begins to be measurably lost above about 45°C, and entirely lost above about 85°C for a typical grain with radius of 60±20 µm (Wolf et al., 1998). This range of temperatures - labelled the helium partial retention zone - is analogous to the apatite fission track partial annealing zone (e.g., Gallagher et al., 1998; Reiners and Brandon, 2006; Wagner and Van den Haute, 1992). The closure temperature for He in apatite of typical grain radius is ~70°C at a cooling rate of ~10°C/Ma (Farley, 2000).
Most data presented in this paper have been produced in the last fifteen years at Yale University according to the following procedures. Dated crystals were handpicked and inspected under a high-powered binocular microscope with cross-polarization to eliminate grains with inclusions. Suitable grains were then measured in two orientations for later alpha-ejection correction, and loaded either as single or multiple grains into 1mm Pt tubes. Degassing of He was achieved by heating with a Nd-YAG laser in a high-vacuum laser cell connected to the He extraction and measurement line. Concentration of 4He was determined by spiking with a known volume of 3He and analyzing the isotope ratio in a quadrupole mass spectrometer according to the procedure outlined in Reiners et al. (2003). For U and Th analysis, degassed apatite grains were dissolved in situ from Pt tubes in HNO3 and spiked with a calibrated 229Th and 233U solution. U and Th concentrations were determined by inductively coupled plasma mass spectrometry. Alpha ejection was corrected using the formula of Farley (2002). Based on the long-term reproducibility of Durango apatite standard analyses at Yale University, an analytical uncertainty of 6% (2σ) was applied to the apatite (U-Th)/He age determinations.
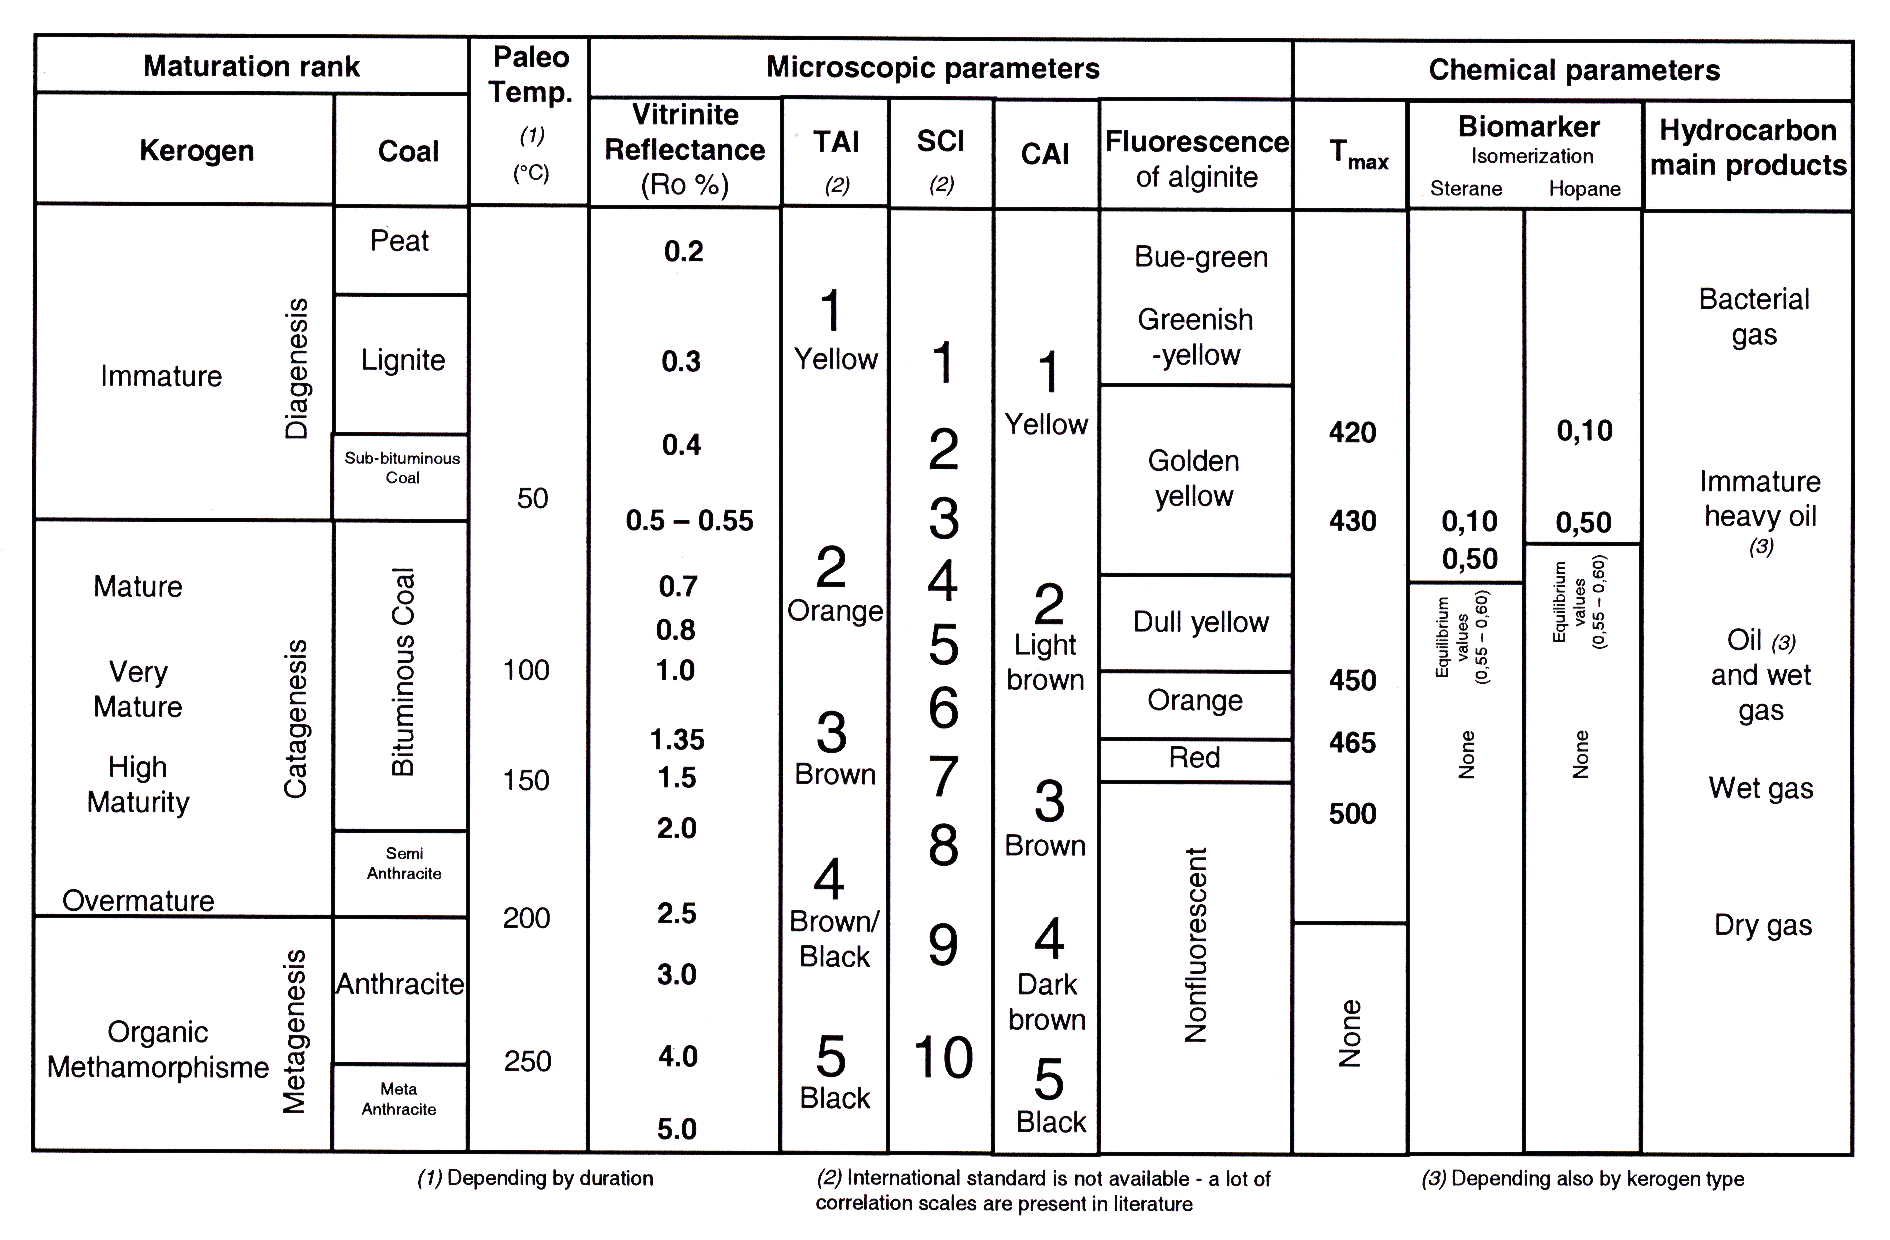
Figure Table 1.

Correlation chart among organic maturity parameters. It is an update of the one proposed by us in the previous edition, a simplification (modified) of the one proposed by Hunt (1995), that is in its turn an adaptation of those of Staplin (1969), Teichmüller (1974), Pearson (1990) and Mukhopadhyay (1994). After Scotti (2003), redrawn.
Vitrinite reflectance
Vitrinite derives from the thermal degradation of lignin and cellulose, and can be found in kerogens rich in high plants fragments. Furthermore vitrinite is an important “maceral” group occurring in coals (Stach et al., 1982). As the maturity increases, a progressive ordering takes place in the vitrinite molecular structure which determines an increasing reflection capacity of incident light. This parameter (vitrinite reflectance) strictly depends on the thermal evolution of the hosting sediments and is correlated to the stages of hydrocarbon generation, coal rank and other thermal parameters in sedimentary environments (Durand, 1980). Thus it is the most widely used parameter to calibrate basin modelling in hydrocarbon exploration (Dow, 1977; Mukhopadhyay, 1994). The ranges defining the different maturity levels of kerogen are shown in Table 1; a correlation with further maturity parameters derived from both optical and chemical analyses, indicative paleotemperatures and coal ranks are shown besides.
Vitrinite reflectance becomes anisotropic from maturity levels in the oil window (about 1%) and increases with increasing maturity. Thus, in organic diagenesis and catagenesis random reflectance (Ro%) is generally used whereas from metagenesis onward Rmax is generally preferred to describe levels of coalification.
Most data presented in this paper have been produced in the last fifteen years at Roma Tre University and ENI Labs according to the following procedures. Samples were prepared according to standardized procedures described in Bustin et al., (1990). Random reflectance was measured under oil immersion with a Zeiss Axioplan microscope, in reflected monochromatic non-polarised light. On each sample, at least twenty measurements were performed on vitrinite or bitumen unaltered fragments never smaller than 5 μm and only slightly fractured. Mean reflectance values (Ro for vitrinite and Rb for bitumen) were calculated from the arithmetic mean of these measurements. Rb values were converted into vitrinite equivalent reflectance data (Roeq) using Jacob’s formula (Jacob and Hiltman, 1985). Rmax values are provided for metamorphic units (e.g. Alpi Apuane).
Clay mineralogy
Clay minerals in shales and sandstones undergo diagenetic and very low-grade metamorphic reactions in response to sedimentary and/or tectonic burial. Reactions in clay minerals are irreversible under normal diagenetic and anchizonal conditions, so that exhumed sequences generally retain indices and fabrics indicative of their maximum maturity and burial. The parameters generally used to provide information on the thermo-baric evolution of sedimentary successions are the Kübler and Árkai indices (Kübler, 1967; Árkai et al., 1995), as well as the b0 value of K-white mica and the variation in the relative ratio between the discrete phases that form mixed layered minerals. In particular, mixed layers illite-smectite (I-S) are widely used in petroleum exploration as a geothermometer and, thus, as indicators of the thermal evolution of sedimentary sequences (Hoffman and Hower, 1979; Pollastro, 1990). The identified changes comply with the following scheme of progressive thermal evolution that has been correlated to the stages of hydrocarbon generation: di-smectite - disordered mixed layers (R0) [1] - ordered mixed layers (R1 and R3) - illite - di-octahedral K-mica (muscovite). Although the conversion to paleotemperatures depends on more than one factor (e.g., temperature, heating rate, protolith, fluid composition, permeability, fluid flow), Pollastro (1990; 1993) summarized the application of two simple time-temperature models for I-S geothermometry studies based primarily on the duration of heating (or residence time) at critical I-S reaction temperatures. The first model was developed by Hoffman and Hower (1979) for long-term, burial diagenetic settings that can be applied to most geologic and petroleum studies of sedimentary rocks and basins of Miocene age or older. In this model the major changes from R0 to R1 and from R1 to R3 occur in the temperature range of about 100-110°C and of 170-180°C respectively (Hoffman and Hower, 1979). The second model, which was developed for short-lived heating events, applies to young basins or areas characterized by relatively recent thermal activity with high geothermal gradients, or to recent hydrothermal environments. Such settings are those where relatively young rocks were subject to burial temperatures in excess of 100°C for <2 Ma. In this model the conversion from R0 to R1 and from R1 to R3 ordering occurs at about 130-140°C and 170-180°C respectively (Jennings and Thompson, 1986). In this paper, we applied the first model, as it is clearly the most appropriate to the study areas.
Another parameter successfully applied worldwide for determining the grade of diagenesis and very-low metamorphism of clay-rich and clastic sedimendary rocks is the Kübler index (KI). In the last four decades it has commonly been used as an empirical measure of the changes in sharpness of the X-ray 10 Å basal reflection of illite-dioctahedral K-white mica. The 10 Å peak width at half-peak-height is commonly considered to be primarily a function of illite crystallite thickness normal to (001). Several authors have shown how KI values decrease as metamorphic grade increases. The limits of metamorphic zones are as follows: KI = 0.42 °Δ2θ for the diagenetic zone to low anchizone boundary and KI = 0.25 °Δ2θ for the high anchizone to epizone boundary (Merriman & Frey, 1999).
Each sample was prepared according to the procedures of Giampaolo and Lo Mastro (2000) and following Moore and Reynolds’ (1999) recommendations. X-ray powder diffraction analyses have been carried out with a Scintag X1 Diffraction system (CuKα radiation) at Roma Tre University. Oriented slides (<2 μm grain-size fraction) were prepared by the pipette-on-slide method, keeping the specimen thickness as constant as possible, within the range of 1 to 3 mg of clay per cm2 of glass slide. Air-dried mounts were scanned from 1 to 48 °2θ with a step size of 0.05 °2θ and a count time of 4 s per step at 40 kV and 45 mA. The presence of expandable clays was determined for samples treated with ethylene glycol at 25°C for 24h. Ethylene-glycol solvated samples were scanned at the same conditions as air-dried aggregates with a scanning interval of 1-30 °2θ. Diffraction peaks were analyzed using the X-ray system associated program by first removing a linear background level and then fitting them using a Pearson VII function. Data and X-ray diffraction patterns are available from the authors.
[1] The term R expresses the probability, given a layer A, of finding the next layer to be B. The R parameter may range from 0 to 3. R=0 means that there is no preferred sequence in stacking of layers and illite and smectite layers are stacked randomly along the c-axis; R=1 indicates that a smectite layer is followed by an illite layer and order in stacking of layers appears in the interstratification sequence; R=3 indicates long-range ordering and that each smectite layer is surrounded by at least three illite layers on each side.