Results
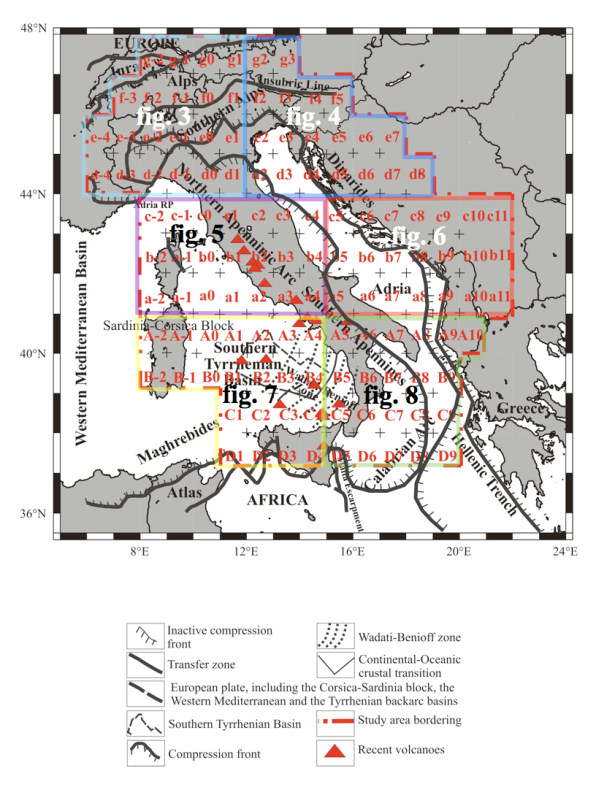
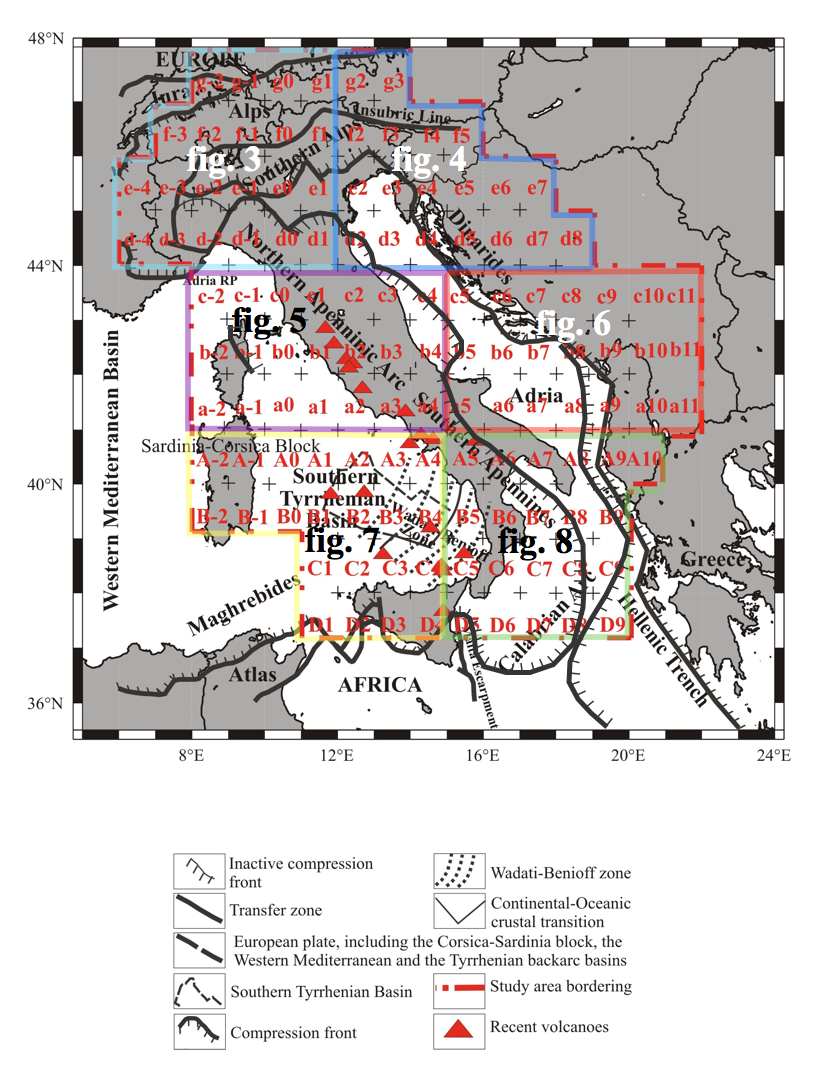
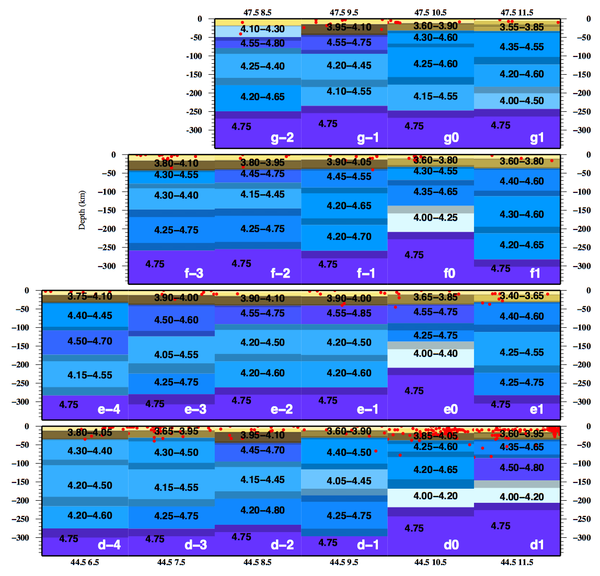
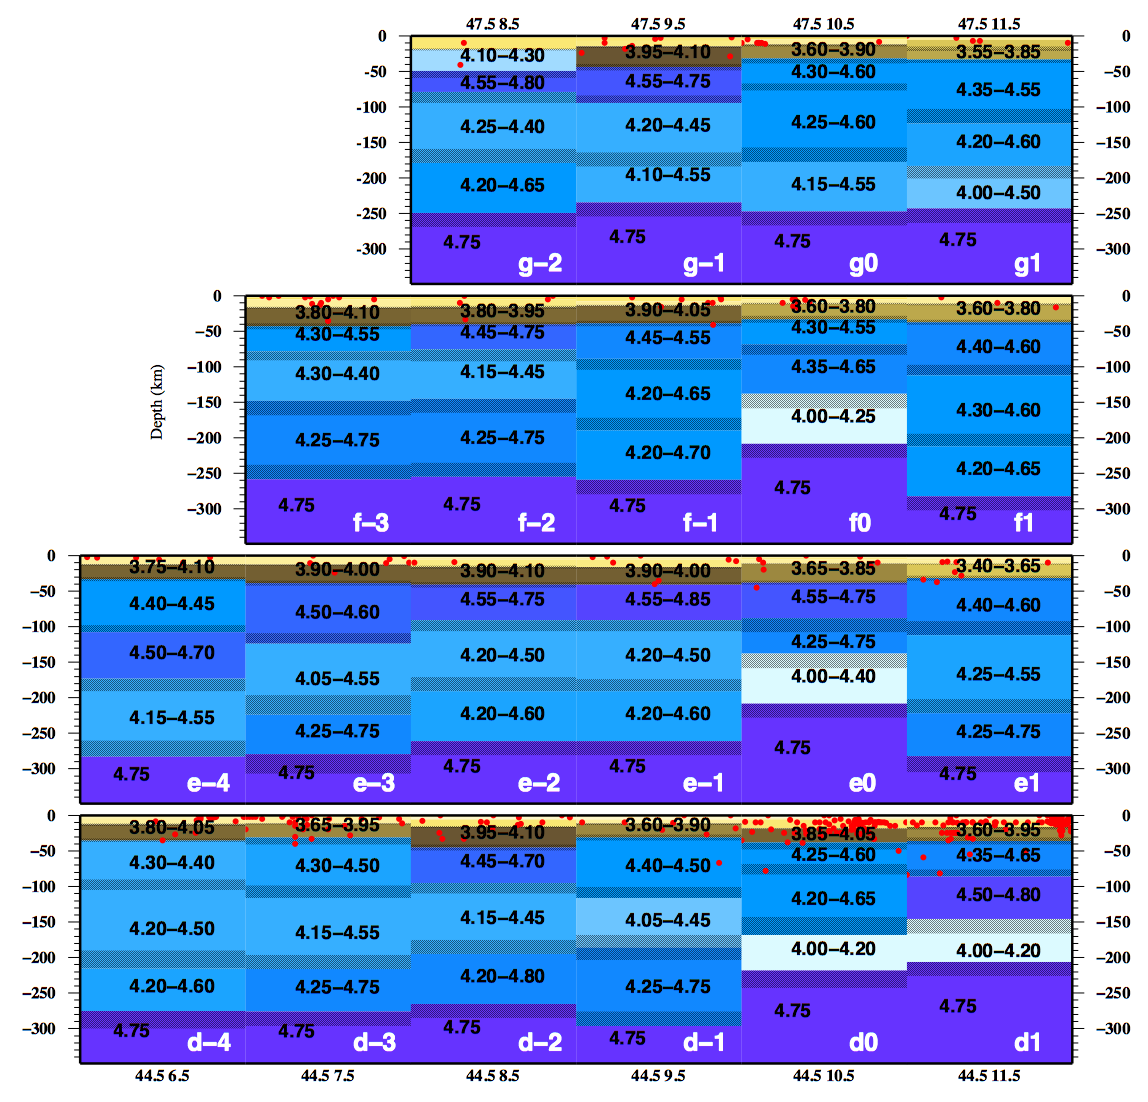
The study region is presented in Figure 2 and the obtained representative 125 cellular solutions are shown in Figures 3-8. The cellular models are presented as VS-depth distributions. The values of VS are color-coded and the uncertainty range for each of the parameterized layers is given. Some values of the VS are omitted in the figures but full models are listed in Appendix B. The uncertainty of the layer’s thickness is given by hatched rectangles. The cellular seismicity (magnitude ≥ 3.0, ISC, 2007) is indicated by red dots. The cell’s alphanumerical label is given at the bottom of each model.
Several definitions are used in the following description of the VS structures: i) lithospheric mantle (LID); ii) soft mantle lid; iii) asthenospheric low velocity zone (LVZ); iv) mantle wedge. The LID is the portion of the mantle with high seismic wave velocity and high density. It still has brittle behavior (VP between 7.5 and 8.6 km/s; VS lower than 4.9 km/s and generally higher than 4.35 km/s; density between 3.0 and 3.4 g/cm3). The soft mantle lid is a layer of lithospheric mantle material with anomalous behavior and low seismicity, found right below the Moho discontinuity; this material is partially molten, with low VS and relatively high density values. The origin of this high-percentage melt layer is not limited, nor directly bound, to subduction areas (VP between 6.9 and 8.2 km/s; VS lower than 4.35 km/s; density between 3.0 and 3.3 g/cm3). The LVZ is an asthenospheric layer with low seismic wave velocity; it is present right below the LID or deeper, under faster asthenospheric layers (VP between 7.9 and 8.6 km/s; VS between 4.0 and 4.4 km/s; density between 3.1 and 3.5 g/cm3). The mantle wedge is the portion of mantle material found between a subducting slab and the overriding lithosphere where plastic deformation occurs; in absence of this geodynamic setting mantle material with similar physical behavior has been simply described as “soft mantle”. In this region, according to Van Keken (2003), hydrothermal uprising flow causes partial melting of subducting slab material due to dehydration.
Figure 2. The studied region.
The Italic region with studied cells sized 1°x1°. The main tectonic features and volcanoes are indicated. The colored polygons indicate the grouping of cells which VS models are presented in Figs. 3-8.
LSO structural model of Italic region
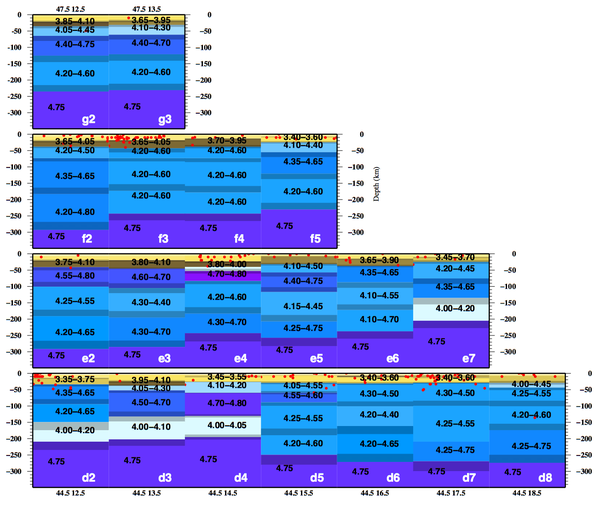
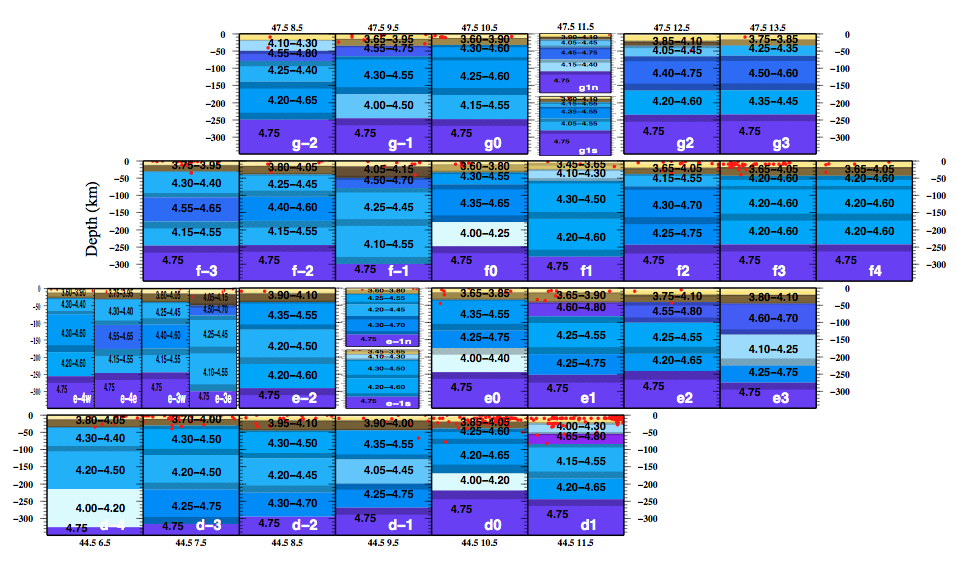
Starting from the north-western margin (Fig. 3) of the study region we face a prominent crustal thickening from cell g-2, with a low VS crust of 20 km depth lying on a 30 km thick soft mantle lid (VS about 4.20 km/s) to cell g-1, where a fast crust (VS about 4.10 km/s) extends down to 40 km depth. In both cells the underlying mantle is characterized by a 30-50 km thick lid (VS about 4.65 km/s), lying above an asthenospheric layer extended from 90 to 160 km depth (VS about 4.30 and 4.35 km/s respectively). In cells g0 and g1 a crust about 30 km thick (VS about 3.70 km/s) lies above two lithospheric mantle layers (VS about 4.40-4.45 km/s) extended down to 160-180 km of depth. Below them, an asthenospheric layer is present in both cells (VS about 4.35 and 4.25 km/s respectively) down to 250 km depth.
To the east (Fig. 4), in cells g2 and g3, the crust is about 30 km thick and lies on a 40-50 km thick soft mantle layer (VS about 4.25 and 4.20 km/s, respectively). Below this layer we find in both cells a lid about 50 km thick (VS about 4.55 km/s) down to a depth of about 130 km, lying on an asthenospheric layer (VS about 4.40 km/s) down to a depth of about 230 km.
The cells f-3, f-2 and f-1 (Fig. 3) are characterized by a crust about 40 km thick. In the f-3 and f-2 the asthenospheric top is clearly individuated at about 80 km depth (VS about 4.35 and 4.30 km/s, respectively), underlying a lid about 40 km thick (VS about 4.45 and 4.60 km/s). In the cell f-1 the asthenospheric top is not clearly seen, probably lying at 180 km depth (VS about 4.45 km/s), under two lithospheric layers of VS about 4.50 and 4.45 km/s, respectively. In cells f0 and f1 a crust about 30 km thick lies on a lithospheric mantle respectively extended down to 140 and 190 km (VS about 4.45-4.50 km/s). In the former the asthenospheric top is well marked by a low velocity layer (VS about 4.00 km/s) extended between 140 and 210 km of depth, while in the latter it is not clearly seen, possibly lying at about 200 km of depth (VS about 4.45 km/s).
In the Eastern Alps, in cells f2 and f3 (Fig. 4) the crust gradually thickens from about 30 to 40 km. The underlying mantle in cell f2 is characterized by velocities gradually increasing down to 280 km of depth (from VS about 4.35 to 4.50 km/s), while in cells f3 constant velocity layers (VS about 4.40 km/s) extend down to 250 km depth. The same mantle velocity structure characterizes the cell f4, where the crust is thinner (35 km) than in cell f3. In the cell f5 we find an even thinner crust (about 25 km) than in the previous cell, lying on a soft mantle layer extended down to about 60 km depth (VS about 4.25 km/s). Below this layer a lid about 60 km thick is present (VS about 4.50 km/s), while the asthenospheric top (VS about 4.40 km/s) is detected at a depth of 120-130 km.
In the Western Alps, cell e-4 (Fig. 3) is characterized by a crust about 30 km thick, lying on two lithospheric layers of increasing velocity (VS about 4.45 and 4.60 km/s) extended down to a depth of about 190 km, where the asthenospheric top is located (VS about 4.35 km/s). To the east, cells e-3, e-2 and e-1, are characterized by a crust about 40 km thick, lying on a lid extended down to about 120 km in cell e-3 and down to about 90 km in cells e-2 and e-1, with velocities increasing from west to east (VS about 4.55 to 4.75 km/s). The asthenospheric top is located below the lid, emerging eastward from about 120 to 90 km (VS about 4.30 and 4.35 km/s respectively). Cell e0 presents a crust of about 40 km thickness lying on two layers of lithospheric mantle extended down to about 140 km depth (VS about 4.65 and 4.50 km/s). At this depth a marked LVZ individuate the asthenospheric top (VS about 4.00 km/s). Cells e1 (Fig. 3), e2 and e3 (Fig. 4) present a crust of increasing thickness from about 30 to 45 km depth, below which a lid extended to about 100 km and gently thickening eastward is present, with also eastward increasing velocities (VS from about 4.50 to 4.65 km/s). The asthenospheric top is detected at about 100 km of depth (VS about 4.40 km/s in cells e1 and e2, 4.35 km/s in cell e3). In cell e4 we find a crust about 39 km thick lying on a soft mantle layer (VS about 4.00 km/s) extended down to about 53 km depth. Here a fast lid extends down to about 90 km (VS about 4.80 km/s). At this depth the asthenospheric top is probably located, with a layer that extends down to about 160 km (VS about 4.40 km/s). Cell e5 is characterized by a crust about 30 km thick lying on two lithospheric layers with increasing velocities (VS about 4.30 and 4.55 km/s, respectively) extended to about 110 km of depth, where the asthenospheric top is detected (VS about 4.30 km/s). Cells e6 and e7 are characterized by a crust of about 35 and 25 km thickness, respectively. In cell e6, right below the Moho, a lid extends down to about 90 km of depth (VS about 4.50 km/s ) where an asthenospheric layer is located (VS 4.35 and 4.20 km/s, respectively). In cell e7 two lid layers extend from about 25 to about 135 km depth (VS about 4.35 and 4.50 km/s), where a marked LVZ likely represents the asthenospheric top (VS about 4.00 km/s).
Figure 3. Western Alps cellular model.
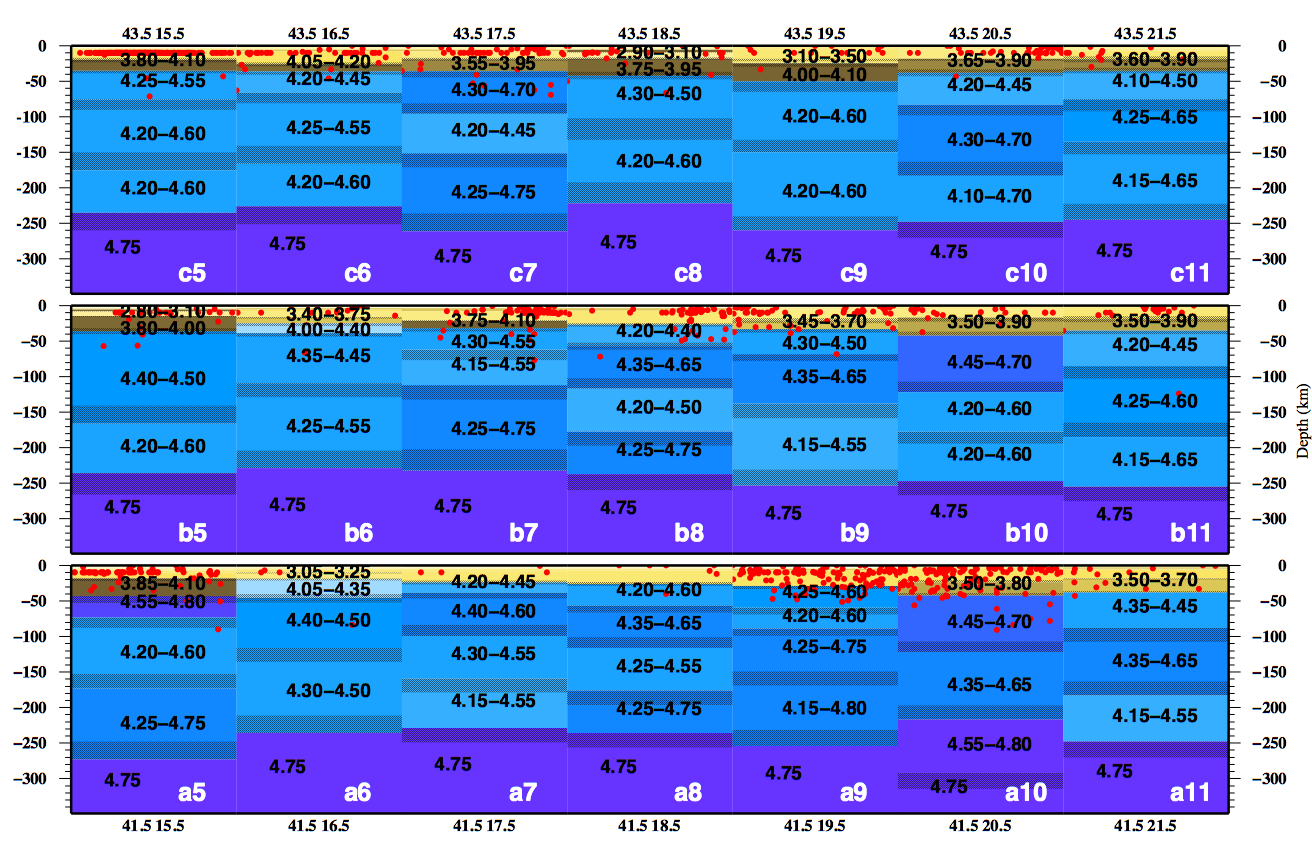
Cellular structural model extended down to 350 km depth for the western Alps area. Yellow to brown colors represent crustal layers, blue to violet colors indicate mantle layers. Red dots denote all seismic events collected by ISC with magnitude greater than 3 (1904-2006). For each layer VS variability range is reported. For the sake of clarity, in the uppermost crustal layers the values of VS are omitted. The uncertainty on thickness is represented by texture. All the values are given in Appendix B.
Figure 4. Eastern Alps cellular model.
Cellular structural model extended down to 350 km depth for the eastern Alps area. Yellow to brown colors represent crustal layers, blue to violet colors indicate mantle layers. Red dots denote all seismic events collected by ISC with magnitude greater than 3 (1904-2006). For each layer VS variability range is reported. For the sake of clarity, in the uppermost crustal layers the values of VS are omitted. The uncertainty on thickness is represented by texture. All the values are given in Appendix B.
In the Western Alps, cells d-4 and d-3 (Fig. 3) present a crust about 30 km thick. The underlying mantle is characterized by a gradual increase in velocity down to a depth of 280 km (VS from about 4.35 to 4.40 km/s) in the cell d-4 while in cell d-3 a lid about 70 km thick underlies the crust (VS about 4.40 km/s), followed by an asthenospheric layer starting at about 100 km depth (VS about 4.35 km/s). Cells d-2 and d-1 present a crust of about 40 and 30 km thickness respectively, lying on a lid extended down to about 100 km depth (VS about 4.60 and 4.45 km/s, respectively). At this depth the asthenospheric top is marked by a low velocity layer (VS about 4.30 and 4.25 km/s, respectively). To the east, cells d0, d1, and d2 are characterized by a gently thinning crust going from the Apennines to the Adriatic, from 40 to 30 km thickness. The underlying mantle presents two lithospheric layers, thickening westward down to a depth of about 150 in cells d2 and d1 (VS about 4.50 and 4.70 km/s) and 160 in cell d0 (VS about 4.70 km/s). Below, a well defined LVZ is extended down to depths of 210-220 km (VS about 4.00 km/s).
The cells d3 and d4 (Fig. 4) are characterized by a crust of about 25 km thickness, lying on soft mantle material extended down to about 60 km (VS about 4.10 and 4.15 km/s). Below a lid of about 60 km thickness (VS about 4.60 and 4.70 km/s, respectively) extends down to about 130 km depth, where the top of asthenosphere is well marked by a LVZ (VS about 4.00 km/s). Cells d5, d6 and d7 present a crust about 30 km thick. Below, a lithospheric mantle with increasing velocity in cell d5 (VS from about 4.30 to 4.60 km/s) and constant velocity in cells d6 and d7 (VS about 4.40 km/s) extends down to about 90 km depth. The asthenospheric top is detected at this depth in cells d5 and d6 (VS about 4.40 and 4.30 km/s, respectively), while in cell d7 it is not resolved. In cell d8 we find an even thinner crust (about 25 km) than in cell d7, lying on a soft mantle layer (VS about 4.20 km/s) of about 15 km thickness. Below, an increasing velocity mantle is found down to about 260 km depth (VS from about 4.40 to 4.50 km/s).
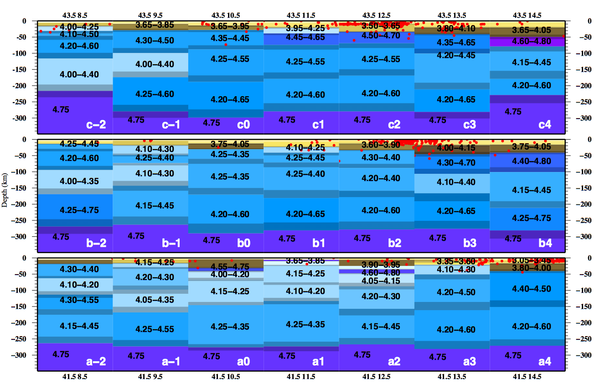
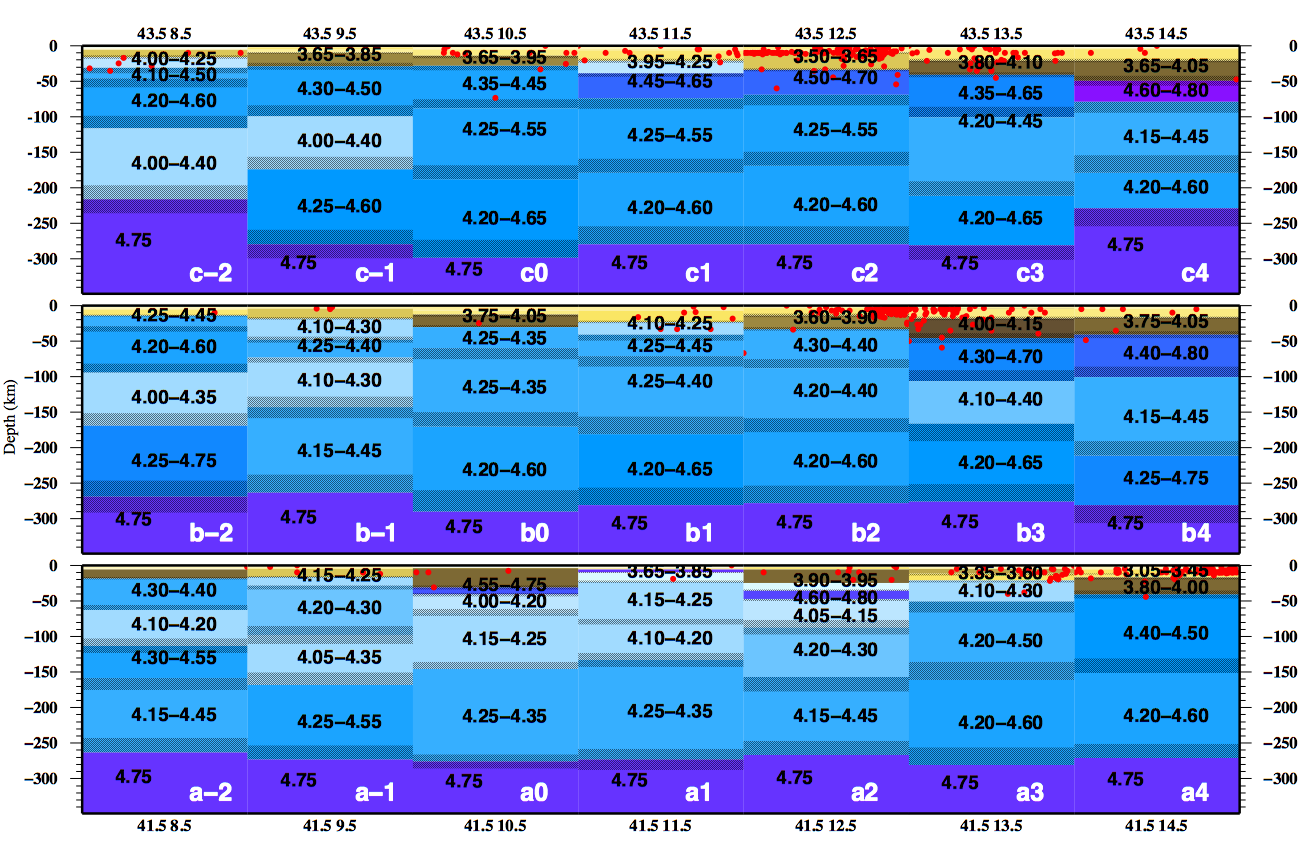
In cells c-2 and c-1 (Fig. 5), Ligurian Sea, the crust is about 18 and 25 km thick, respectively. In the former a soft mantle layer extends for 20 km below the crust (VS about 4.10 km/s), lying on a lid extended down to a depth of about 110 km (VS about 4.40 km/s). In the latter the lid starts below the Moho down to about 100 km depth (VS about 4.40 km/s). In both cells the top of asthenosphere is detected at depth of 100-110 km (VS about 4.15 and 4.20 km/s, respectively). Cell c0 is characterized by a crust about 30 km thick, lying on a slightly increasing velocity mantle (VS from about 4.40 to 4.45 km/s), extended down to a depth of 270-300 km. The crust in cell c1 is relatively thin (about 20 km) and it is followed by a mantle wedge layer about 20 km thick (VS about 4.10 km/s). Below, a lid layer extends down to about 80 km depth (VS about 4.55 km/s), where the top of the asthenosphere is probably located (VS about 4.40 km/s). In cells c2 and c3 both crust and lithosphere slightly thicken eastward through the Apennines, the former ranging from about 35 to 40 km thickness, the latter ranging from about 80 to 90 km thickness (VS about 4.60 and 4.50 km/s, respectively). The asthenospheric top (VS about 4.40 and 4.35 km/s, respectively) is located at about 80-90 km of depth. In cell c4, offshore Adriatic sea, a still thick crust (about 40 km) lies on a fast lid (VS about 4.80 km/s) extended down to about 80 km depth. Below this depth two asthenospheric layers (VS about 4.30 km/s) are present.
The cells c5, c6 and c7 (Fig. 6) are characterized by a crust of about 35 km thickness. The underlying mantle presents an almost constant velocity sequence down to about 230 km (VS about 4.40 km/s) in cells c5 and c6, while in cell c7 a lid about 50 km thick (VS about 4.50 km/s) extends below the Moho down to about 90 km depth, where the asthenospheric top is likely located (VS about 4.30 km/s). Cells c8 and c9 present a thick crust (40 and 50 km, respectively) that lies on a mantle with constant VS of about 4.40 km/s extended down to about 210 – 250 km of depth. Cells c10 and c11 present a crust of about 38 and 35 km, respectively. The underlying mantle in both cells is characterized by lithospheric layers with increasing VS from 4.35 to 4.50 km/s down to a depth of about 170 - 140 km respectively, followed by an asthenospheric layer with VS of about 4.40 km/s.
Cell b-2, in north-eastern Corsica (Fig. 5), is characterized by a thin crust (about 14 km) lying on a lid extended down to a depth of about 80 km (VS about 4.35-4.40 km/s). Below, the asthenospheric top is well marked by a LVZ of about 60 km thickness (VS about 4.15 km/s). Cell b-1 presents a crust of about 18 km thickness that lies on a soft mantle layer (VS about 4.20 km/s) extended down to about 50 km depth. Here a shallow asthenosphere layer (VS about 4.30 km/s) is extending down to a depth of 90 km, followed by a LVZ of about 60 km thickness (VS about 4.20 km/s). In cell b0 a 30 km thick crust seems to lie directly on a shallow asthenosphere or soft mantle layer (VS about 4.30 km/s). In cell b1 a 20 km thick crust lies on a soft mantle layer (VS about 4.20 km/s) of about 25 km thickness. Below a shallow asthenosphere (VS about 4.35 km/s) extends down to a depth of 280 km. In cell b2 a 30 km thick crust lies on a 50 km thick lithospheric layer (VS about 4.35 km/s) extended down to a depth of about 80 km. At this depth the asthenospheric top is found (VS about 4.30 km/s). In cells b3 and b4 a crust about 35 km thick lies on a westward thickening lid extended to depths of about 90 km (VS about 4.55 and 4.60 km/s, respectively). Below the asthenospheric top is well marked by a relative low velocity layer (VS about 4.20 and 4.30 km/s, respectively) with thickness of 60 km in cell b3 and 100 km in cell b4.
To the east, offshore Adriatic Sea (Fig. 6), cell b5 present a crust about 35 km thick. The underlying mantle in cell b5 is characterized by a lithospheric layer (VS about 4.45 km/s) down to a depth of about 140 km, where an asthenospheric layer is present (VS about 4.40 km/s), extended down to about 240 km depth. In cell b6 a thin crust (about 25 km) overlies a soft mantle layer (VS about 4.20 km/s) that extends below the Moho for a 10 km thickness. Below, a lithospheric layer (VS about 4.40 km/s) extends down to a depth of about 110 km, where the asthenospheric top is located (VS about 4.40 km/s). In cell b7 a 35 km thick crust lies on a 40 km thick lid (VS about 4.40 km/s). The asthenospheric top is located at about 75 km depth (VS 4.35 km/s). In cells b8 and b9 a gradually thickening crust (from about 30 to 35 km) lies on a eastward thickening lid (VS increasing from about 4.30 to 4.50 km/s) extended down to a depth of about 150 km. Below the asthenospheric top is clearly detected (VS 4.35 km/s). In cells b10 and b11 a crust of about 35 km is present. In cell b10 a lid (VS about 4.60 km/s) extends down to about 130 km, where the asthenospheric top (VS about 4.40 km/s) is located. In cell b11 a gradually increasing velocity mantle (VS from 4.35 to 4.45 km/s) extends down to about 170 km, where the asthenospheric top is located (VS about 4.40 km/s).
Figure 5. Northern Thyrrenian cellular model.
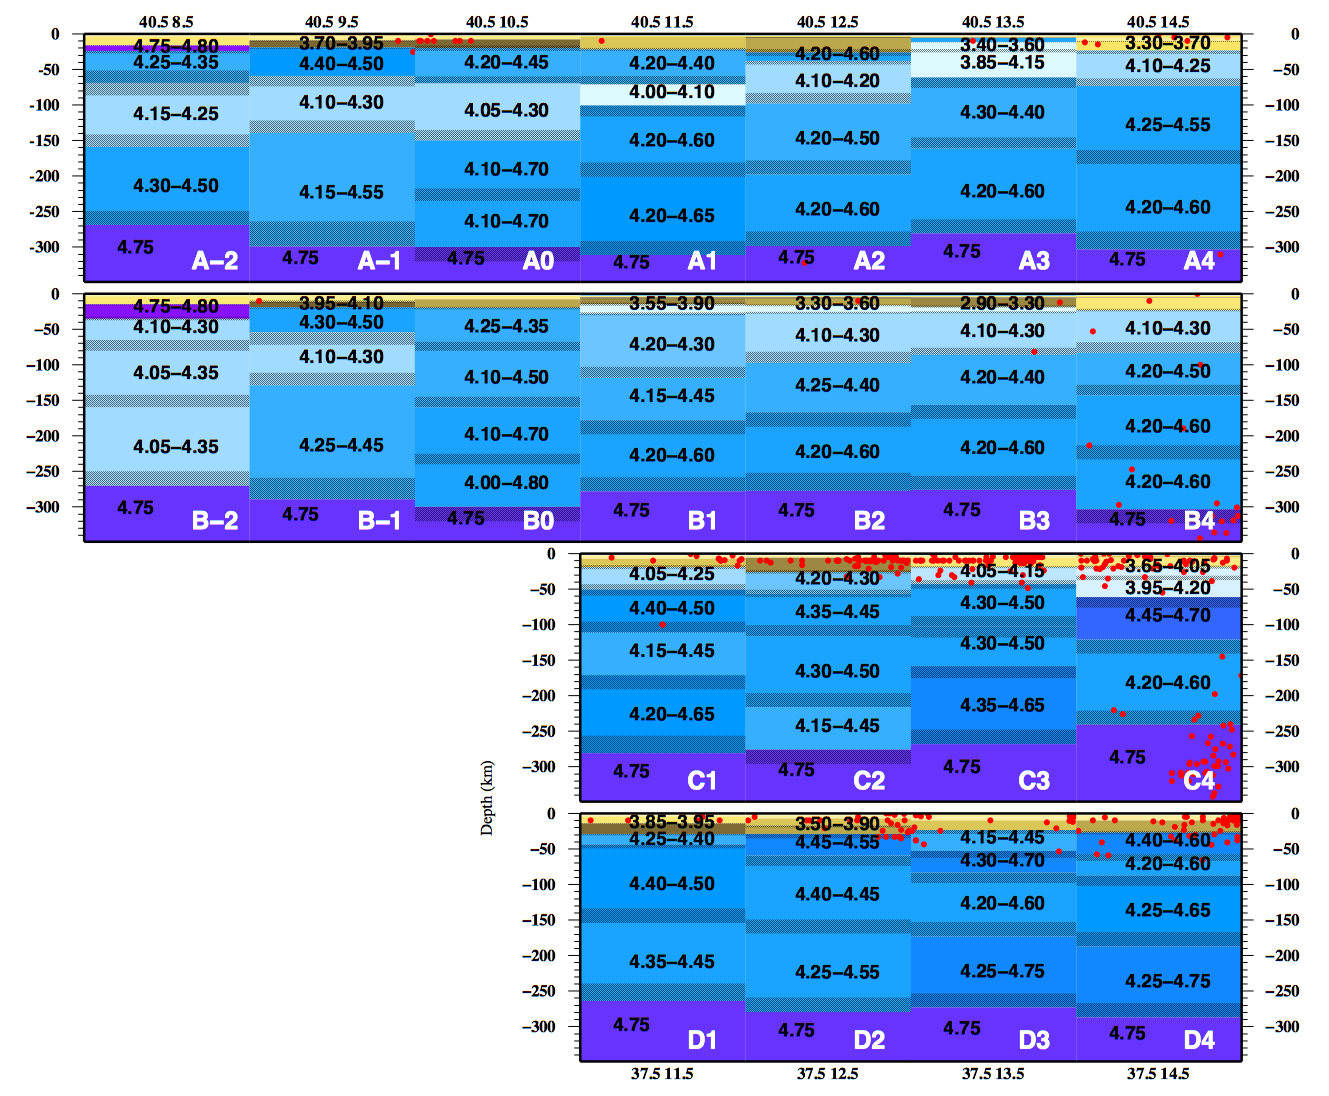
Cellular structural model extended down to 350 km depth for the northern Tyrrhenian area. Yellow to brown colors represent crustal layers, blue to violet colors indicate mantle layers. Red dots denote all seismic events collected by ISC with magnitude greater than 3 (1904-2006). For each layer VS variability range is reported. For the sake of clarity, in the uppermost crustal layers the values of VS are omitted. The uncertainty on thickness is represented by texture. All the values are given in Appendix B.
Cell a-2 (Fig. 5), in south-western Corsica, presents a crust of about 20 km thickness lying on a lid (VS about 4.35 km/s) that extends down to about 60 km depth. Below, the top of the asthenosphere is well marked by a LVZ (VS about 4.15 km/s) of 50 km thickness. Cell a-1 presents a slightly thinner crust (about 18 km) than cell a-2, under which a shallow asthenosphere is detected (VS about 4.20 km/s). In cell a0, offshore Tyrrhenian, a crust of about 30 km thickness lies on a thin fast lid (VS about 4.65 km/s) extended down to about 40 km depth, where the asthenospheric top is located (VS about 4.10 km/s). In cell a1 a very thin crust (about 6 km) lies on a thin fast lid (VS about 4.75 km/s) extended down to about 11 km depth. Below, a soft mantle layer (VS about 3.75 km/s) extends down to about 21 km depth, where the top of asthenosphere is likely located (VS 4.20 km/s). In cell a2 a crust of about 25 km thickness lies on a thin hot mantle layer (VS about 3.90 km/s) that reaches the depth of about 38 km. A fast lid (VS about 4.70 km/s) follows, that is extended down to about 50 km depth. Below, the asthenospheric top is well marked by a LVZ (VS about 4.10 km/s). The structure in this cell is obtained after analysis of the seismicity-depth distribution and it is discussed in details in Panza et al. (2007a) and Panza and Raykova (2008). In the Lazio region, cell a3 presents a crust about 25 km thick lying on a soft mantle layer (VS about 4.20 km/s) that extends down to about 60 km depth, where asthenospheric material is likely to be present (VS about 4.35 km/s). In cell a4 a crust about 40 km thick lies on a lid layer (VS about 4.45 km/s) that extends down to about 90 km depth, where the top of asthenosphere is likely to be located (VS about 4.40 km/s).
Figure 6. Dinarides cellular model.
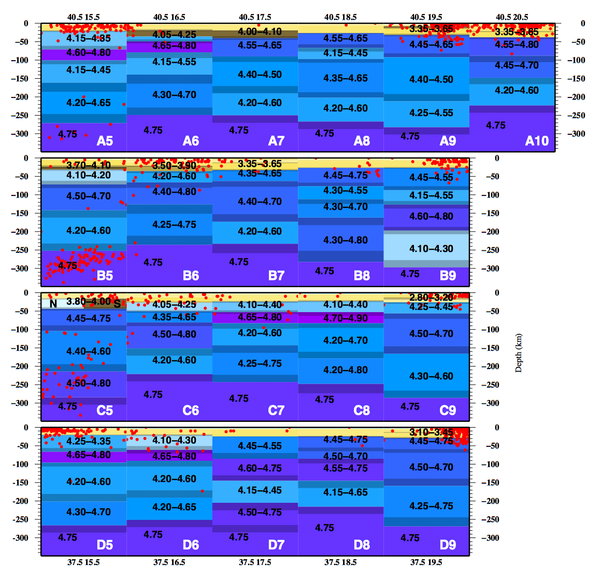
Cellular structural model extended down to 350 km depth for the Dinarides area. Yellow to brown colors represent crustal layers, blue to violet colors indicate mantle layers. Red dots denote all seismic events collected by ISC with magnitude greater than 3 (1904-2006). For each layer VS variability range is reported. For the sake of clarity, in the uppermost crustal layers the values of VS are omitted. The uncertainty on thickness is represented by texture. All the values are given in Appendix B.
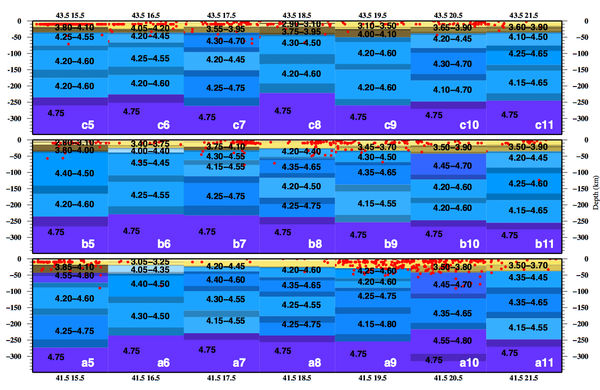
Figure 7. Southern Thyrrenian cellular model.

Cellular structural model extended down to 350 km depth for the southern Tyrrhenian area. Yellow to brown colors represent crustal layers, blue to violet colors indicate mantle layers. Red dots denote all seismic events collected by ISC with magnitude greater than 3 (1904-2006). For each layer VS variability range is reported. For the sake of clarity, in the uppermost crustal layers the values of VS are omitted. The uncertainty on thickness is represented by texture. All the values are given in Appendix B.
Across Apennines, cell a5 (Fig. 6) presents a crust about 50 km thick lying on a fast lid (VS about 4.70 km/s) extending down to about 90 km depth, where an asthenospheric layer is likely to be present (VS about 4.40 km/s). To the east, offshore Adriatic Sea, cells a6, a7 and a8 present a gently eastward thickening crust (from about 20 to 30 km). In cell a6 the crust lies on a soft mantle layer (VS about 4.40 km/s) of about 25 km thickness, below which a lid layer (VS 4.45 km/s) extends down to about 120 km depth, where asthenospheric top is likely to be located (VS about 4.40 km/s). In cells a7 and a8 the crust lies directly on a lid layer (VS about 4.35 and 4.50 km/s) extending down to 90-110 km depth, where the asthenospheric top is likely to be present (VS about 4.40 km/s). In cells a9 and a10, across Dinarides, an eastward thickening crust (from about 30 to 40 km) lies on a lid (VS about 4.45 and 4.55 km/s, respectively) extending down to about 70 and 120 km respectively, where the top of asthenosphere is likely to be located (VS about 4.40 and 4.50 km/s respectively). In cell a11 a crust about 40 km thick lies on a lid that extends down to about 170 km (VS about 4.40 and 4.50 km/s), where the top of the asthenosphere is likely to be present (VS about 4.35 km/s).
Figure 8. Ionian cellular model.
Cellular structural model extended down to 350 km depth for the Ionian area. Yellow to brown colors represent crustal layers, blue to violet colors indicate mantle layers. Red dots denote all seismic events collected by ISC with magnitude greater than 3 (1904-2006). In cell C5 seismicity is projected on a north-south axis, according to split crustal layer. For each layer VS variability range is reported. For the sake of clarity, in the uppermost crustal layers the values of VS are omitted. The uncertainty on thickness is represented by texture. All the values are given in Appendix B.
Figure 9. Alpine refined cellular model.

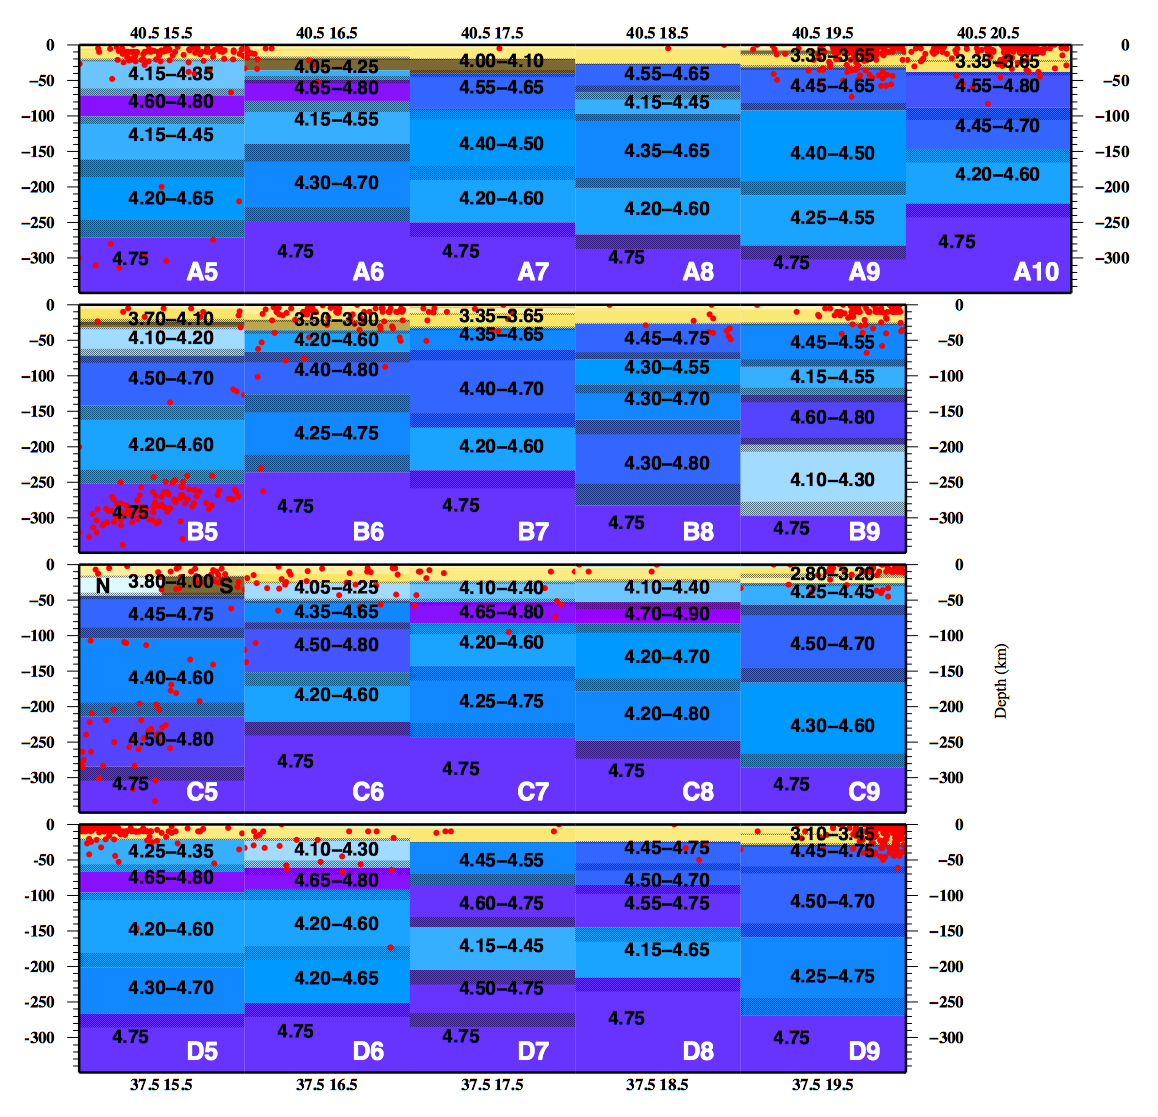
Cellular structural model extended down to 350 km depth for the Alpine area, refined with GSO and GFO optimization algorithms, with splitting of some cells to 1°x0.5° or 0.5°x1.0°, along profiles where additional crustal information were available. Yellow to brown colors represent crustal layers, blue to violet colors indicate mantle layers. Red dots denote all seismic events collected by ISC with magnitude greater than 3 (1904-2006). For each layer VS variability range is reported. For the sake of clarity, in the uppermost crustal layers the values of VS are omitted. The uncertainty on thickness is represented by texture. All the values are given in Appendix C.
In cell A-2 (Fig. 7), north-western Sardinia, a crust about 18 km thick lies on a 10 km thick fast lid (VS about 4.80 km/s). Below, another lid layer (VS about 4.30 km/s) extends down to about 60 km depth, where an asthenospheric LVZ starts (VS about 4.20 km/s), reaching the depth of about 150 km. Cells A-1, A0 and A1 are characterized by a crust about 20 km thick, lying on a lid layer (VS about 4.45 and 4.30 km/s, respectively) that extends down to about 60 km depth, where an asthenospheric LVZ of about 60-80 km thickness is likely to be present (VS about 4.20 and 4.00 km/s, respectively). In cell A2 a 25 km thick crust lies on an about 10 km thick lid (VS about 4.40 km/s). At about 40 km depth the asthenospheric LVZ is likely to be present (VS about 4.15 km/s), that extends down to about 100 km depth. In cell A3 a thin crust (about 6 km) overlies a lid about 8 km thick (VS about 4.40 km/s) which lies on a soft mantle layer (VS about 3.50 km/s) extended down to about 21 km depth, where an asthenospheric LVZ (VS about 4.00 km/s), that extends down to about 60 km depth, is likely to be present. In cell A4 a crust about 25 km thick lies on a soft mantle layer (VS about 4.20 km/s) that extends down to about 70 km depth. Below, two asthenospheric layers (VS about 4.40 km/s) extend down to about 300 km depth.
In cells A5 and A6, across the Southern Apennines (Fig. 8), an eastward thickening crust (about 25 km thick in A5 and 36 km thick in A6) overlies a thin mantle wedge with velocities 4.05-4.25 km/s and thickness about 50 km in A5 and 13 km in A6. A high velocity westward thickening lid (VS about 4.80 km/s) is extended down to about 100 km depth, where the top of the asthenosphere is likely to be present (VS about 4.30 and 4.35 km/s, respectively). In cell A7 a 40 km thick crust overlies a lid (VS about 4.60 km/s) that extends down to about 100 km depth. Below, an asthenospheric layer (VS about 4.45 km/s) extends down to about 250 km of depth. Across the Dinarides, in cells A8, A9 and A10, an eastward thickening crust (from about 25 to 40 km) lies on an eastward thickening lid (VS about 4.60 and 4.55 km/s, respectively) that extends down to depths of about 70, 90 and 150 km, respectively. Below, astenospheric layers (VS about 4.30, 4.45 and 4.40 km/s, respectively) extend down to about 290, 300 and 240 km of depth.
In cell B-2 (Fig. 7), south-western Sardinia, a crust about 18 km thick lies on a fast lid layer (VS about 4.80 km/s) that extends down to about 35 km depth. Here a marked asthenospheric LVZ (VS about 4.20 km/s) extends down to about 270 km of depth. Cell B-1 has a high-velocity crust about 20 km thick that overlies a lid (VS about 4.40 km/s) with thickness of about 40 km. The LVZ (VS about 4.20 km/s) below the lid has a thickness of about 60 km and it is followed by a layer with VS about 4.35 km/s extended down to about 290 km of depth. Cell B0 has a crust with a similar thickness as in cell B-1 but with lower VS. The following mantle layers have slightly increasing VS from 4.30 to 4.40 km/s down to about 300 km of depth. In cells B1, B2 and B3 a crust about 12 km thick lies on a very soft mantle (VS about 3.70, 3.45 and 3.10 km/s, respectively) of about 13 km thickness. The VS in the following mantle layers gradually increases with depth, from about 4.20 to 4.40 km/s, down to about 280 km depth. Offshore Calabria, in cell B4 (Fig. 7), a crust about 25 km thick lies on a soft mantle layer (VS about 4.20 km/s) that extends down to about 70 km depth. Below, slightly increasing velocity layers (VS from about 4.35 to 4.40 km/s) extend down to about 280 km of depth.
In cell B5 (Fig. 8) a crust about 30 km thick lies on a mantle wedge (VS about 4.15 km/s) extended down to about 70 km of depth. Below, a lid layer (VS about 4.60 km/s) extends down to about 150 km depth, where an asthenospheric layer begin (VS about 4.40 km/s). Across Calabria, in cells B6 and B7, a crust of about 35 km and 30 km thickness, respectively, overlies lid layers (VS about 4.40 and 4.60 km/s in cell B6, 4.50 and 4.55 km/s in cell B7) that extend down to about 150 km of depth. In both cells an asthenospheric layer is likely to be located at this depth (VS about 4.50 and 4.40 km/s, respectively) that extends down to about 230 km of depth. Offshore Ionian Sea, in cells B8 and B9 a crust about 28 km thick is present, lying on a lid layer (VS about 4.60 and 4.50 km/s, respectively) extended down to about 75 km depth. Below, in cell B8, an asthenospheric layer is likely to be present (VS about 4.45 km/s), while in cell B9 a likely asthenospheric layer of about 40 km thickness (VS about 4.35 km/s) lies on a fast layer (VS about 4.70 km/s) that extends down to about 200 km depth, where another asthenospheric layer is likely to be present (VS about 4.20 km/s).
Offshore Sicily (Fig. 7), in cells C1 and C2 a crust about 20 and 25 km thick, respectively, overlies a soft mantle layer (VS about 4.15 and 4.25 km/s, respectively). Below, a lid layer (VS 4.45 and 4.40 km/s respectively) extends down to about 100 km depth, where the asthenospheric top is likely to be located (VS about 4.30 and 4.40 km/s respectively). In cells C3 and C4 a crust of about 20 km thickness lies on a soft mantle layer extended down to 40-60 km depth, respectively. The underlying mantle layers present slightly increasing VS (from 4.40 to 4.50 km/s) down to the depth of 270 km in cell C3, while in cell C4 the VS decreases from 4.55 to 4.40 km/s down to the depth of about 240 km.
Toward Calabria (Fig. 8), the VS structure of cell C5 is obtained after the comparison with the distribution of the seismicity with depth (see section “Discussion” for details). The crust in the northern part of the cell is about 19 km thick and lies over a hot mantle layer (VS about 3.90 km/s and thickness of 20 km), followed by high velocity lid layers extended down to about 280 km of depth. The crust in the southern part of the cell is about 44 km thick and lies on a seismic lid with a VS about 4.60 km/s that extends down to about 280 km of depth. In cell C6 a crust about 25 km thick lies on a soft mantle layer (VS about 4.15 km/s) of about 25 km thickness. Below, two lid layers (VS about 4.50 and 4.65 km/s, respectively) extend down to about 160 km depth, where an asthenospheric layer (VS about 4.40 km/s) extends down to about 210 km of depth. Offshore Ionian Sea, cells C7 and C8 present a crust of about 25 km thickness lying on a soft mantle layer (VS about 4.25 km/s) extended down to about 50 km depth. Below, a fast lid layer (VS about 4.80 km/s) extends down to about 80 km depth, where the asthenospheric top is likely to be located (VS about 4.40 and 4.45 km/s, respectively). Toward the Hellenides, in cell C9 a crust of about 30 km thickness lies on lid layers (VS 4.35 and 4.60 km/s) that extends down to about 160 km, where the top of the asthenosphere is detected (VS about 4.45 km/s).
In cell D1 (Fig. 7), in the Sicily Channel, a crust about 30 km thick lies on lid layers (VS about 4.30 and 4.45 km/s) that extend down to about 130 km, where the asthenospheric top is likely to be present (VS about 4.40 km/s). In cells D2 and D3 an about 30 km thick crust lies on lid layers (VS about 4.50 km/s in cell D2 and about 4.30 and 4.50 km/s in cell D3) that extend down to about 70 and 90 km depth respectively, where the asthenospheric top is likely to be located (VS about 4.40 km/s). In cell D4 a crust about 30 km thick lies on two lid layers (VS about 4.50 and 4.40 km/s) extended down to about 100 km. The asthenospheric top is not clearly detected, possibly represented by a VS about 4.45 km/s layer between 100 and 170 km depth.
In cells D5 and D6 (Fig. 8), offshore Eastern Sicily, a 20 km thick crust lies on a soft mantle layer (VS about 4.30 and 4.20 km/s, respectively) that extends down to about 60 km depth. Below a fast lid (VS about 4.80 km/s) layer of about 30 km thickness extends down to about 100 km depth, where the asthenospheric top is detected (VS about 4.40 km/s). Toward the Hellenic Trench, in cells D7, D8 and D9 a gently thickening crust (from about 25 to 30 km) lies on a lid layer (VS about 4.50 and 4.75 km/s in cell D7, 4.60 and 4.75 km/s in cell D8, 4.60 km/s in cell D9) that extends down to about 150-160 km depth, thickening to the east. At this depth the asthenospheric top is likely to be detected (VS about 4.30, 4.40 km/s and 4.50 km/s, respectively).
GFO refined structural model of Alpine region
The hierarchical application scheme of optimization algorithms described in section “Methodology” is applied to the Alpine region, in order to refine the structural model obtained by LSO. Furthermore, additional constrains to the uppermost fixed crust, taken from seismic reflection experiments (i.e. CROP-ECORS, EGT and TRANSALP), have been used to perform the inversion on half cells, i.e. sized 1°x0.5° or 0.5°x1° (Farina, 2006).
The main features of the LSO structural model are preserved by the application of GSO and GFO, in particular concerning crustal thickness and velocities. The accordance with the values in the literature is improved only in cell f4, where LSO chooses a crust too thin for Eastern Alps (about 25 km), while GFO realistically indicates a crust of about 40 km.
The main differences emerging from the application of GSO and GFO are at mantle depths, in particular in the location of LVZ. In cell d-4, Western Alps, a LVZ (VS about 4.00 km/s) appears to extend between 215 and 320 km of depth, according to GFO, while LSO depicted in this cell a relatively fast asthenosphere (VS about 4.40 km/s). On the contrary, in cell d1, GFO depicts a relatively fast asthenosphere (VS about 4.45 km/s) between about 150 and 210 km of depth while LSO located a LVZ (VS about 4.00 km/s).
The inversion on half-cells allowed to gain details both on the crust and the underlying mantle structure. (Fig. 9) In the cell e-4, in the Western Alps, the thick lid depicted by the 1°x1° inversion results is present, but is limited to the eastern half part of the cell. Similarly an eastward thickening trend of crust is depicted by GFO results, according to independent data on Moho depth.
Latitudinal splitting of cell e-1, in the Ivrea Zone, allowed to define the crustal thickness of about 22 km in the southern half-cell and of about 30 km in the northern half-cell, respectively.
Latitudinal splitting of cell g1, along the TRANSALP profile, allowed a detailed definition of the asthenospheric top, located at about 150 km of depth with VS about 4.15 km/s in the northern half-cell and about 4.30 km/s in the southern one.