Crustal structure
Archaean shield lithospheres such as the Indian, possess specifically ordered geochemical and thermal structures that have resisted recycling by 3000 million years of mantle convection, and would yet determine the course of future geodynamics. On the basis of well constrained earthquake focal depths, McKenzie et al (2005) showed that beneath the continents, almost all recorded earthquakes lie within the crust, including the deep ones beneath Himalaya and Tibet which lie close to the Moho (Supriyo Mitra et al., 2005). Further, using the slab cooling model to determine the oceanic lithosphere geotherm, and nodule geochemistry for the continental, they showed that most earthquakes occur in materials colder than 600ºC, whether beneath continents or oceans. These results imply that the mechanical strength of the continental lithosphere must reside in the crust and that for it to be yet strong at 600ºC, it must be dry. This identification of the strong continental lithospheric layer with the crust is robustly constrained by an independent estimation (McKenzie and Fairhead, 1997) of the thickness of the elastic layer of the lithosphere found everywhere to lie within the seismogenic layer.
Broadband seismology by furnishing ground motion records over 3 orders of magnitude in frequency and 7 in amplitude, now enable one to map shear wave speed (Vs) variations in the lithosphere, with depth. This is accomplished by isolating fine structures of seismograms for specific analysis using appropriate digital filters. Since Vs is controlled principally by the temperature of the material rather than its composition, shear wave speeds determined from broadband seismograms, can be translated into thermal states at depth. The two most definitive ways to map shear wave speeds at depth, use multi-mode surface wave tomography and travel delays of converted shear waves generated by the first arriving longitudinal waves, at prominent discontinuities, such as the Moho. The latter constitute the Receiver function methodology yielding Moho depths with a resolution of 2-3km depending on the signal to noise ratio, as well as estimates of the average crustal Poisson’s ratio as a proxy for the petrological characeter of crustal materials
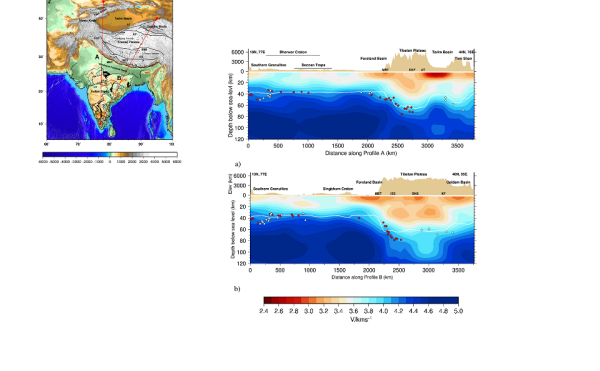
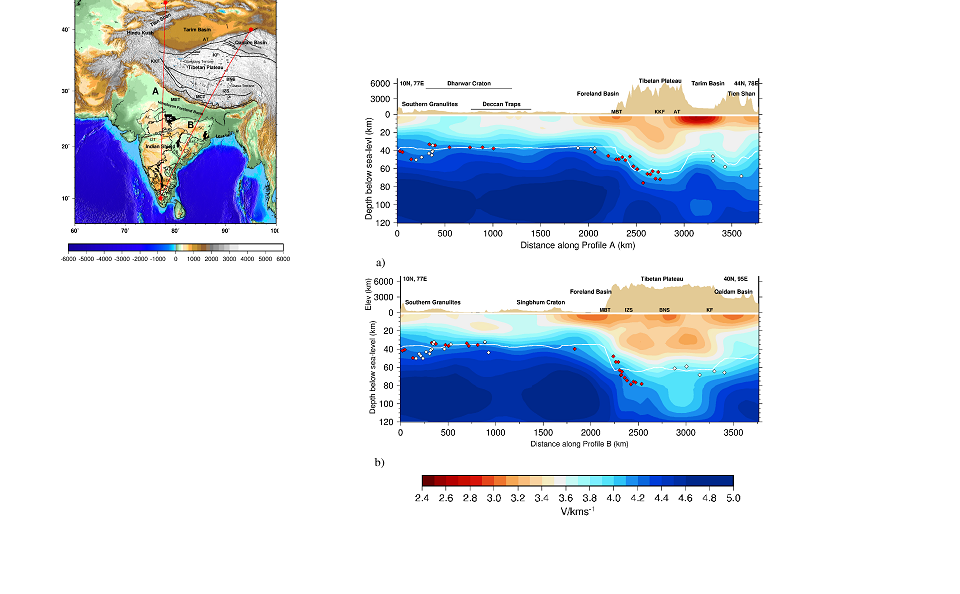
Motivated by these possibilities, experiments were designed (Rai et al., 2003, 2006), and (Mitra et al., 2005) to investigate the structure of the Indian shield units and especially its disposition beneath Himalaya and Tibet via their seismic characteristics. Recent reinterpretation (Charlotte Acton, 2009, Hazarika et al. 2009, Jagadeesh et al. 2009) of much of their data using joint inversion of receiver functions and 3-5º resolution surface wave dispersion data for 10-70 secs periods, discussed in the next section, have led to the best constrained seismic characteristic of the Indian continental crust so far, even as several parallel endeavours to further enhance their resolution and fill in critical gaps continue apace and have a long way to go. Inverted crustal structures from receiver functions and surface wave dispersion curves for a few representative regions of the Indian crust are shown in Figure 2, whilst a map of shear wave speed structure along two profiles from southern India to Tibet based on fundamental mode Rayleigh wave tomography, along with crustal depths inverted from receiver functions are shown in Figure 3.
Figure 3. Shear wave speed sections
Shear wave speed sections along profiles A and B respectively (top left), the topography plotted above being at a smaller scale. Red diamonds represent Moho depths from joint inversion of surface wave dispersion data and receiver functions, and the white represent Moho depths obtained by grid search stacking of receiver functions or simple depth migration. The white lines mark the crustal thickness estimate from isostasy (sm = 3.3 Mg/m3, and sc = 2.8 Mg/m3 (Charlotte Acton, 2009)
Significant results of these investigations include the following:
that the crustal structure of the various shield areas of the continent are intermediate between that of the eastern Dharwar craton and the western.
that the eastern Dharwar craton from Bangalore in the south to Hyderabad at ~17ºN, including several off profile sites has a seismically transparent crust with a typical crustal thickness of 32-38km, an average crustal shear wave speed of ~3.7km/s and Vp/Vs of 1.7. It is also characterized by the absence of any seismically distinguishable high speed layer in the lower crust.
The western Dharwar crust beneath the 3.4 Ga greenstone belts, by contrast, has a thickness of 48-52km, an abrupt increase across the longitudinally stretching Closepet gramite, which occurs largely within a 50km wide transitional region to its west. The western Dharwar crust is thickest around Mysore but decreases to ~40km towards the western coast. It has a uniformly higher average shear wave speed of ~4km/s, and a persistent intra-crustal feature varying between 10 and 20km below which the shear velocity is even higher. Remarkably, however, the crustal structure beneath the Deccan basalt cover to the north of the western Dharwar craton, is similar to that of the easten Dharwar with a simple transparent seismic structure, an average crustal shear wave speed of 3.74km/s and Moho depths varying from 36-38km.
The crustal structure beneath the 550 Ma Pan African Madurai granulites and Kerala khondalites, which are distinguished from the 2500 Ma Dharwar craton Granulites, lying north across the E-W Noyil-Kaveri high strain zone, albeit inadequately sampled, is typified by those beneath Trivandrum on the southwest coast and Kodaikanal at 2300 metres, east of the southern stretch of western Ghats. The average crustal thickness beneath Trivandrum is ~36km and a shear wave speed of 3.83km/s whilst those beneath Kodaikanal are 46km and a somewhat higher speed of 3.9km/s. The lower crust of Kodaikanal, however, has high, mafic type, shear wave speed of 4.0-4.2km/s. One seismic station at Metupalyam that samples the foot of the Nilgiri hills has similar crustal shear wave speed but has a much thicker crust equal to 54km. On the other hand, the crust beneath the highland complex of central Sri Lanka, also a part of the Pan African terrane, sampled by just one seismic station at Pallekele, is similar to that of Trivandrum, with a crustal thickness of 40km and an average shear wave speed of 3.88km/s which is intermediate between that of Trivandrum and Kodaikanal.
The two east coast cratons of Bastar and Singhbhum largely remain terra-incognita save some disjointed results. A single seismic station SNI on the Bastar craton yielded a crustal thickness of 40km and a shear wave speed of ~3.5km/s
North of the CITZ, the Bundelkhand craton also has a simpler crust with an average shear wave speed of 3.7km/s and crustal thickness of 38km beneath Jhansi, thickening to 46km beneath Allahabad ~300km to the east, on the southern edge of the foredeep.
A single seismic station at Mount Abu shows the crust, just west of the Mewar craton, to be 44km with an average wave speed of 3.77km/s. This being similar to the crust at Rohtak and substantially different from that ~50km to its east at Delhi (~36km and 3.67km/s) strongly argue for the Mount Abu-Rohtak Aravalli ridge to be a divider of crustal types.
The Proterozoic Godavari and Vindhyan basins have thicker (40-44km) crust and an average shear wave speed of 3.8km/sec., but are underlain by a higher speed (4.4km/s) basal layer. The crust is much thicker (48-50km) beneath the Narmada Son lineament.
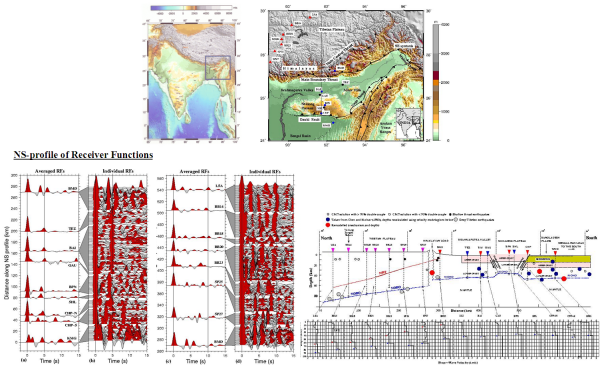
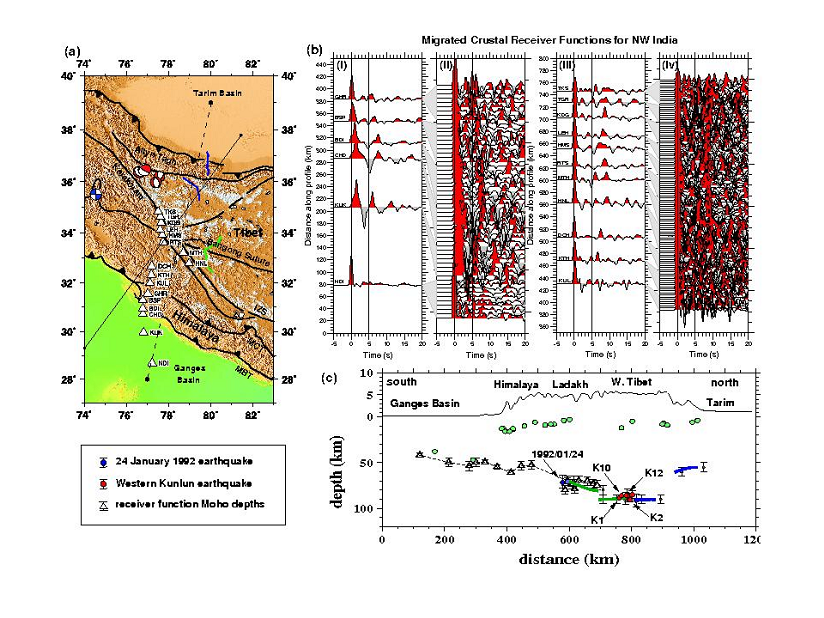
Crustal structures beneath the western, eastern and central Lesser Himalaya (Manali, Almora, Gangtok and Bomdila), show a gently northward dipping Moho, except beneath Sikkim where it dips towards the south (Charlotte Acton, 2009), overlain by a complex structure representative of the shaved off upper crust of the Indian plate over-thrust upon itself. Two seismic profiles traversing the Himalaya, map the Indian Moho right through the Himalaya and the suture zone into southern Tibet as far north as Lhasa in the east and Karakoram in the west. These are respectively shown in figures 4 and 5.
Figure 4. Northeastern Himalayan collision zone
Showing the crustal structure (bottom right) along a 700km long profile across the northeastern Himalayan collision zone from the Bengal basin to Lhasa, based on joint inversions of both receiver functions (bottom left) and surface wave dispersion curves (not shown); the Indian Moho is seen to have penetrated right through the Himalaya to Lhasa. Seismic stations locations are show on the top right (Mitra et al., 2005)
Figure 5. Northwestern Himalayan collision zone

Showing the crustal structure (bottom right) along a 700km long profile across the northwestern Himalayan collision zone from Delhi on the north Indian shield to Taksha on the Karakoram fault, zone, based on joint inversions of both receiver functions (top right) and surface wave dispersion curves (not shown); the Indian Moho is seen to have penetrated right through the Himalaya to Karakoram. Seismic stations locations are show on the top left (Rai et al., 2006 )
Data along the eastern profile also show that whilst the crustal structure in northeastern India is broadly similar to that of the eastern Dharwar craton, the crust beneath the Shillong plateau is thinner by ~4km compared with that of the Brahmaputra valley requiring the ~1km high uncompensated Shillong plateau crust to be upthrust along mantle reaching faults. This as well as the better constrained focal depths of earlier located upper mantle earthquakes beneath Shillong, which are all found to lie within the lower crust demonstrate that the plateau’s lower crust is at least as strong as its underlying mantle, refuting the validity of the long held sandwich model of crustal rheology in this part of the globe (Mitra et al., 2005).