Results
The fieldwork revealed that fault scarps are clear in the landscape, and appear as limestone fault planes offsetting slopes that formed during the last glacial maximum (12-18 ka) (Fig. 2). The slopes are covered in tephra deposits derived from eruptions of volcanoes on the west coast of Italy (see Roberts and Michetti 2004 for a review of dates that confirm the last glacial maximum age of the landforms), and the fault planes themselves have been dated using 36Cl exposure dating (Palumbo et al. 2006); dates confirm the scarps are 12-18 ka. These observations, together with palaeoseismological trench investigations (e.g. Pantosti et al. 1996, Michetti et al. 1996), and historical reports of earthquake surface ruptures (e.g. see Serva et al. 1986), reveal that earthquakes rupture the ground surface during events >Ms 5.5, with vertical surface displacements of c. 1 metre (depending on magnitude; Wells and Coppersmith 1994). Thus, scarps that are metres to tens of metres high record the cumulative effect of numerous palaeoearthquakes, and this is confirmed by 36Cl exposure dating that has revealed 5-7 metre-scale surface exposure events on one fault that are interpreted as palaeoearthquakes (Palumbo et al. 2006).
The key observation in this paper is that such fault scarps can be seen clearly on SPOT images within Google Earth, and related to the larger-scale topography via observations of the DEM (Figure 3)and (Figure 4). The scarps appear as clear lines of limestone outcrop that occur where field observations confirm the existence of fault planes covered in striations and corrugations produced by frictional-slip during earthquakes (Roberts and Michetti 2004, Papanikolaou and Roberts 2007). The scarps commonly occur at the bases of oversteepened footwall escarpments (Figure 4), that in places show (1) triangular facets where spurs have been truncated by upward-propagating faults, and/or (2) incised drainage where fault slip has lowered the base-level of rivers, driving fluvial incision (Figure 3).
In places limestone outcrops along fault scarps visited during fieldwork are clear on the SPOT images and have clear oversteepened escarpments, triangular facets and incised drainage, but elsewhere scarps may not be obvious due to tree cover or lithologies that do not preserve surface displacements. Google Earth allows notes to be added facilitating documentation of the attributes that define interpretation of individual examples of scarps. Thus, some scarps are clearer than others, and this is indicated in the accompanying "kmz" file.
The exact positions of faults can be extracted from the “paths” defined in Google Earth, allowing precise x-y coordinate data to be made widely-available (e.g. Figure 5).
Mapping in this paper is limited to the area between the SE tip of the Pollino fault and the NW tip of the Rieti Fault. Other active faults are well-known to the NW and SE of this area but their traces are not shown here due to lack of fieldwork by the authors in these locations. Also, faults shown in red on Figure 1b have been visited in the field by the author, whilst those shown in white have not; the traces of faults shown in white, although constrained be geomorphic features visible in Google Earth, are therefore less certain than those shown in red.
The mapping reveals a regional pattern of active fault scarps that are sub-parallel to the length of the Italian Peninsula (Figure 1), but the faults are closer to the western coast in the south. Scarps are localised within the high mountains of the Apennines, and it is clear within Google Earth that no such scarps occur west or east of the reported examples, consistent with existing fault mapping (Valensise and Pantosti 2001, Roberts and Michetti 2004, Papanikoloau and Roberts 2007, Galadini and Galli 2000, Guidoboni et al. 2007, Ithaca Project 2007). In central Italy, up to 6-7 active normal faults faults exist on SW-NE traverses across the Apennines. There appear to be less faults in southern Italy, with a maximum of 2-3 faults on SW-NE traverses across the Apennines.
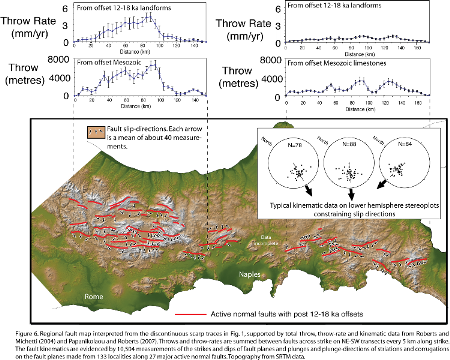
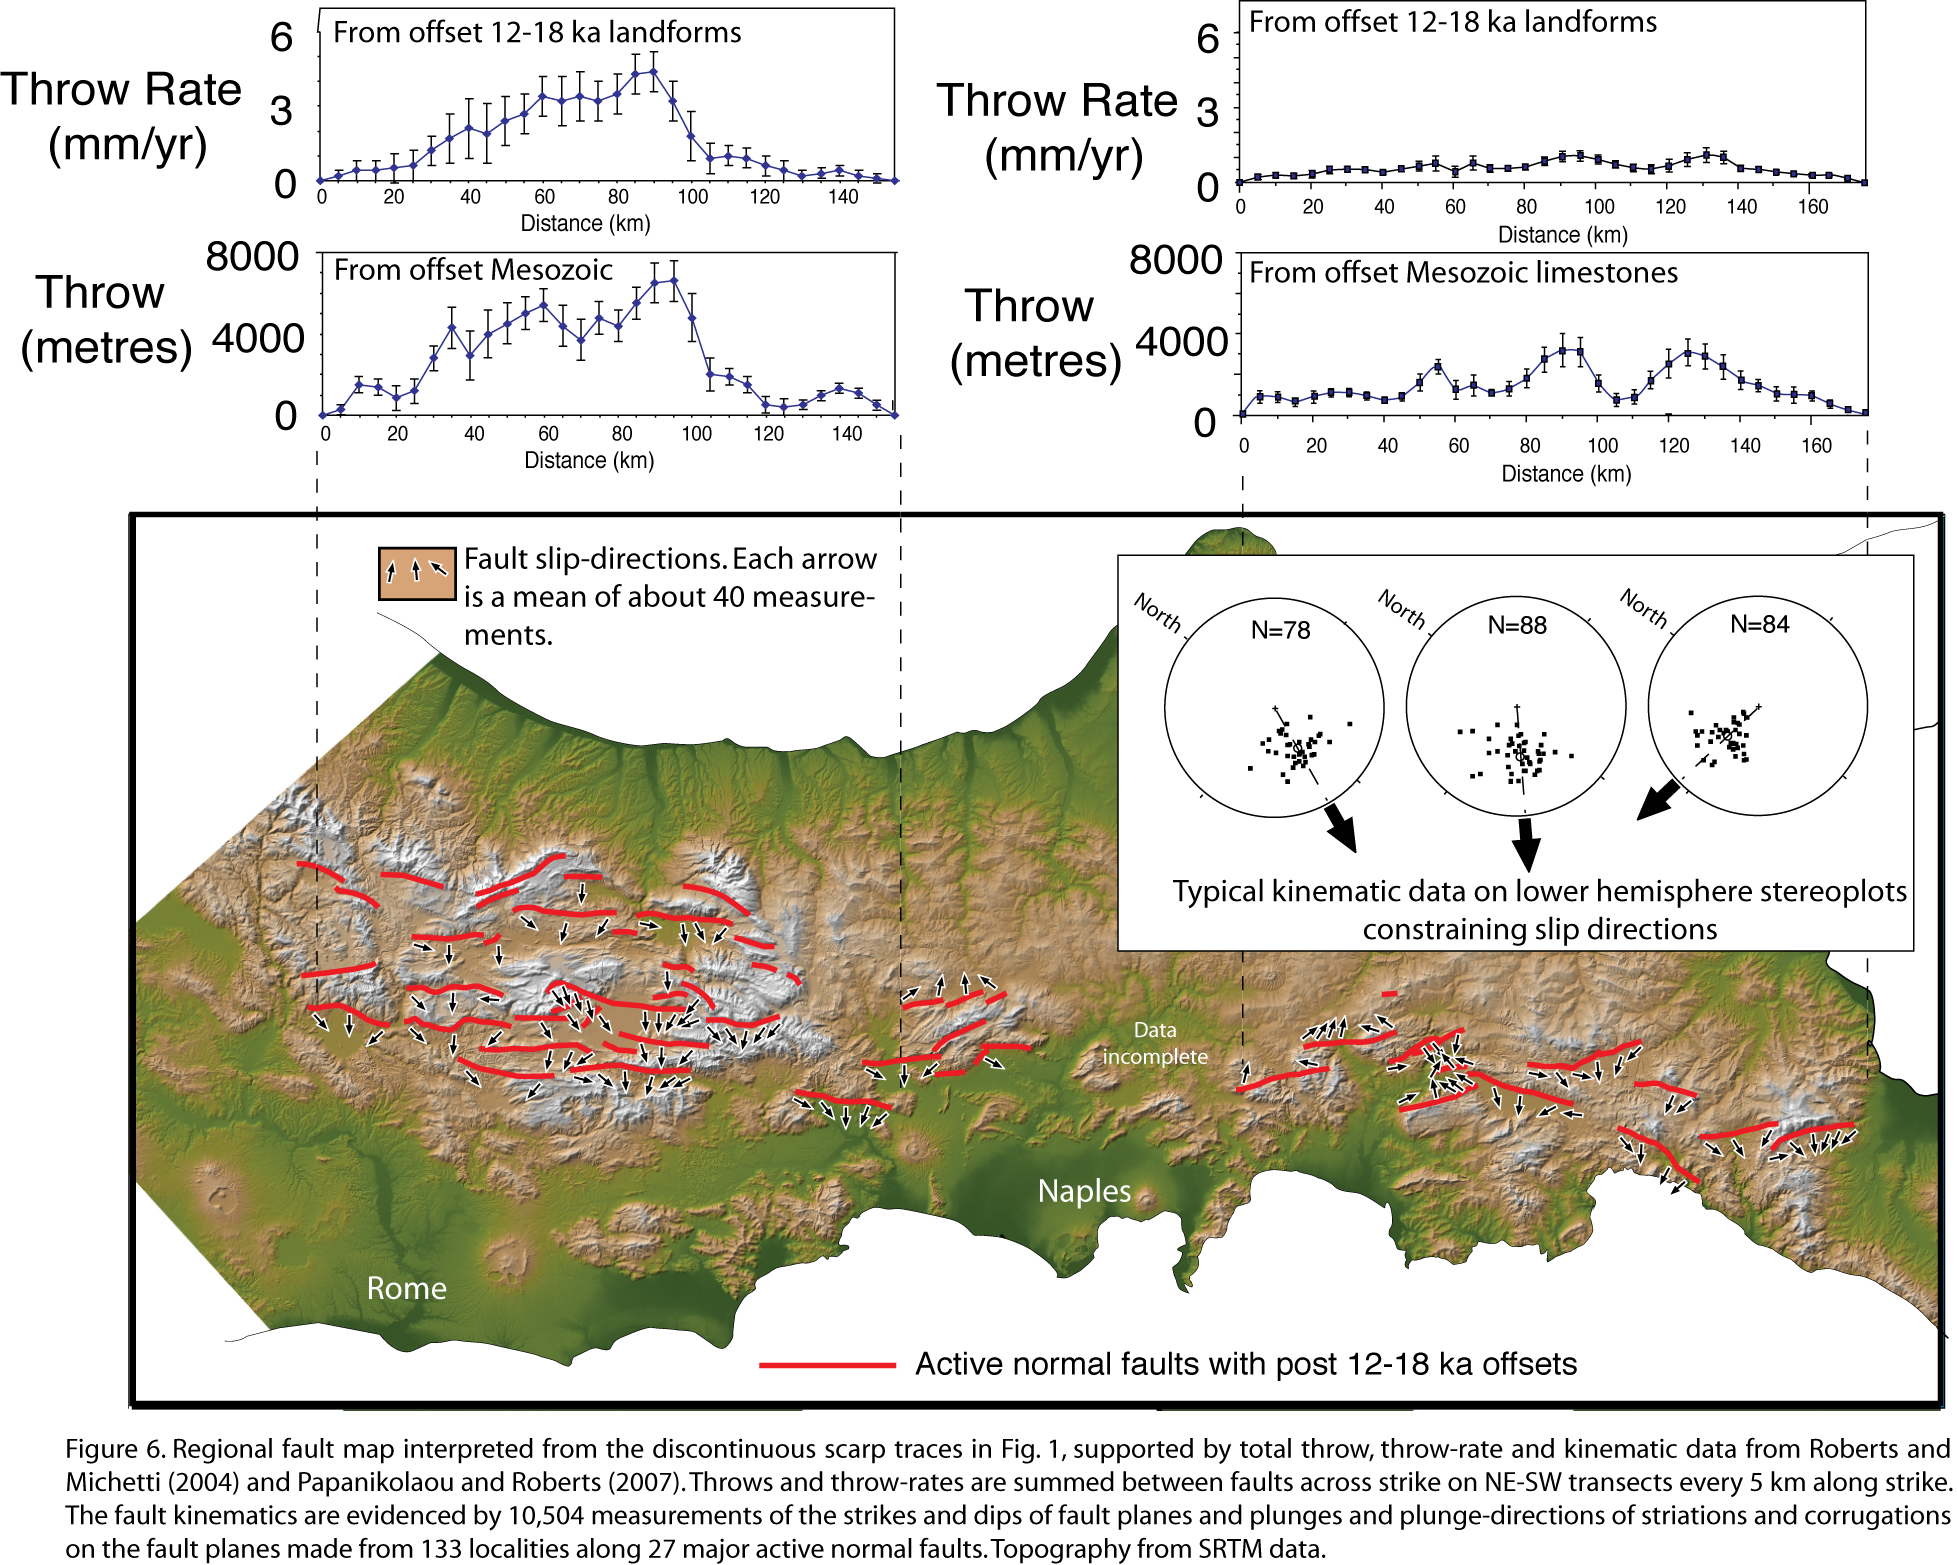
The traces of the faults appear discontinuous on Figure 1, with lines of scarps 20-40 km in length defined by shorter lines that are in places only a few kilometres in length. This does not reflect the actual displacement patterns on the faults, because Roberts and Michetti (2004) and Papanikolaou and Roberts (2007) show that total throws across the faults show offset profiles that decrease from maxima at fault centres to minima at lateral tips over distances of c. 20-40 km (Figure 6).
Figure 6. Regional fault map
Regional fault map interpreted from the discontinuous scarp traces in Fig. 1, supported by total throw, throw-rate and kinematic data from Roberts and Michetti (2004) and Papanikolaou and Roberts (2007). Throws and throw-rates are summed between faults across strike on NE-SW transects every 5 km along strike. The fault kinematics are evidenced by 10,504 measurements of the strikes and dips of fault planes and plunges and plunge-directions of striations and corrugations on the fault planes made from 133 localities along 27 major active normal faults. Topography from SRTM data.
Consistency between along-strike stretching of the ground surface due to these throw variations and fault kinematics is recorded by 10,504 measurements of the strikes and dips of fault planes and plunges and plunge-directions of striations and corrugations on the fault planes made from 133 along 27 major active normal faults (summarised in Figure 6). Convergent patterns of fault-slip on individual faults occurs on the same length scale as throw variations indicating that structural segmentation of the fault system occurs at the 20-40 km lengths scale. These interpreted faults, along with their throw patterns, throw-rate patterns and kinematics are summarised on Figure 6. The discontinuities on the scale of a few kilometres do reflect the discontinuous visualisation of the scarps allowed by forest cover (where trees can be higher than scarps and hence obscure their traces on SPOT images), and lack of scarp preservation where the bedrock shows a high propensity to erosion and mass transport. Thus, comparison of Figure 1 and Figure 6 allow visualisation of the positions of faults scarps that are clear in the geomorphology along longer faults.
Segmentation defined in this way, with 20-40 km faults, reveals that the fault system is composed predominantly of soft-linked faults arranged in both en echelon and end-on geometries. Faults are separated by relay-ramps that in places contain dip-slip release faults allowing extension along strike due to throw-gradients on the main NW-SE faults. However, no examples of strike-slip transfer faults linking displacements on one NW-SE fault are, in the opinion of the author, clear in the geomorphology. This lack of transverse strike-slip lineaments is real because in many instances, the ground in these relay zones is extremely well-exposed, and it is not feasible that scarps would not be seen on the available SPOT images. Segmentation at this crustal scale is characterised by along-strike fault overlaps across relay zones of less than a few tens of percent of fault lengths and across strike distances across relay zones of 5-15 km.