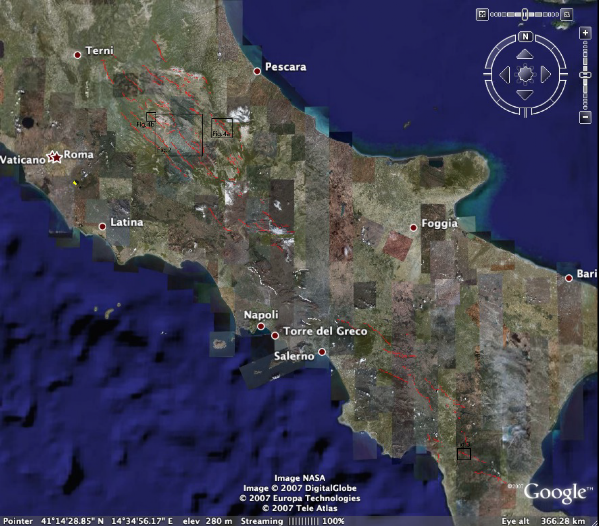
Introduction
The Italian Apennines suffers devastating earthquakes related to the ongoing crustal extension in this part of the convergent boundary between the African and European tectonic plates (e.g. 1915 Fucino Earthquake Ms 6.9, 33,000 deaths; Margottini and Screpanti 1988, Anderson and Jackson 1987) (Figure 1a).
Figure 1. Active faults of the Italian Apennines
Map of active faults for the Italian Apennines. Active faults are defined by clear structural offsets that have formed since 12-18 ka. These offsets are evidenced by limestone bedrock fault scarps offsetting landforms from 12-18 ka that can be seen clearly on Google Earth. Such offsets are accompanied by landforms that can be seen on Google Earth such as incised of footwall drainage, triangular facets, and oversteepened bases to footwall fault escarpments. See the accompanying “kmz” file to zoom into this view and visualise the landforms. Red lines show faults visited in the field. White lines show faults not visited in the field but with relatively clear geomorphic expression as seen on Google Earth. Figure 6 shows an interpretation of the lateral continuity of active faults, where the view in this figure has been combined with structural measurements such as total throw, throw since 12-18 ka, and kinematic data revealing the slip-directions associated with the extensional tectonics. More active faults exist to tthe northwest and southeast of the area considered in this paper. Boxes locate Figures 2, 3 and 4. Precise geographic coordinates for the fault scarps can extracted from the “paths” in the “kmz” file (e.g. Fig. 5).
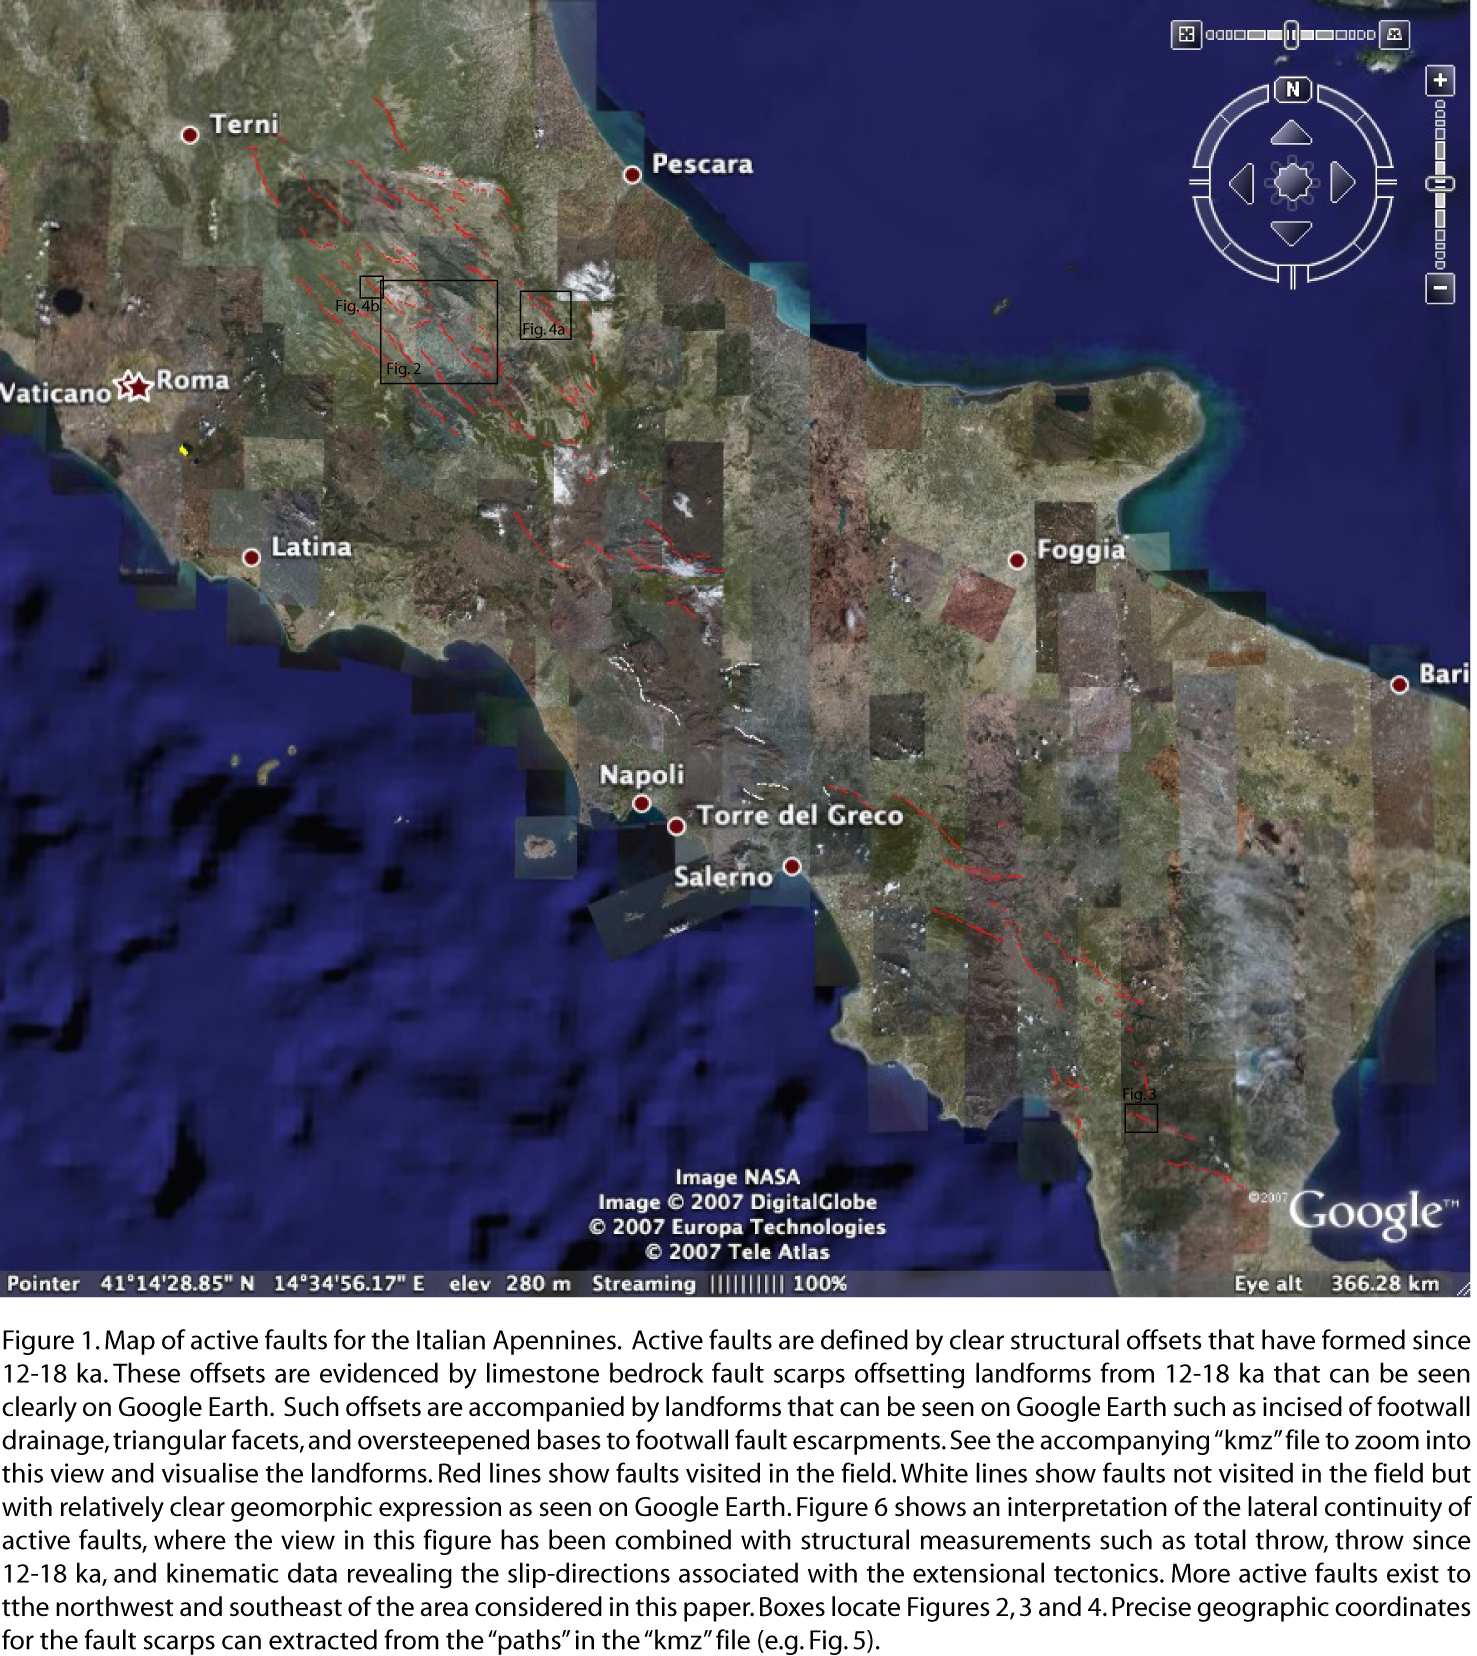
Such earthquakes produce surface ruptures that are 15-20 km in length and have surface offsets of about 1 metre along pre-existing faults (Serva et al. 1986, Wells and Coppersmith 1994). The historical earthquake catalogue for the Apennines records events that have damaged Rome back to Roman times, and the catalogue is thought to be complete for large magnitude events (>Ms 6.0) since 1349 A.D.. However, the recurrence times for such large earthquake are 500-3000 years, recorded through palaeoseismological trench investigations (e.g. Michetti et al. 1996, Pantosti et al. 1996), so a longer record of fault slip is needed to assess the relationship between long-term strain release recorded in the geomorphology (104 years) and short-term strain release recorded by earthquake catalogues and geodesy (102-3 years). A key observation is that the cumulative effect of such earthquakes over 104 year timescale has been preserved due to the fact that the rate of vertical offset of the ground surface across faults (0.2-2.0 mm/yr; Roberts and Michetti 2004, Papanikoloau and Roberts 2007) is higher than erosion and sedimentation rates since the last glacial maximum (12-18 ka) (Figure 1b). The timing of surface offsets for this 12-18 ka timescale have been constrained by palaeoseismological trench investigations (Michetti et al. 1996, Pantosti et al. 1996), tephrachronology (e.g. Giraudi 1995), and 36Cl cosmogenic surface exposure dating of fault planes that emerge out of the ground along the scarps during earthquakes (Palumbo et al. 2006) (Figure 2a) and (Figure 2b).
Figure 2a. Fault scarps on SPOT images
Examples of fault scarps visible at outcrop and on SPOT images (a) Overview locating the Velino and Parasano fault scarps. (b) Google Earth view of the Velino fault scarp. The fault separates Mesozoic limestones from Quaternary colluvium, and this is responsible for the vegetation change at the scarp. Note that incised drainage and triangular facets terminate at the fault scarp. (c) Outcrop photo showing the incised footwall drainage and 36Cl sample site on the Velino Scarp. (d) Google Earth 3D view of the Velino Scarp. (e) Detail of the Velino fault scarp showing the 36Cl sampling site from Palumbo et al. (2006). (f) View of the fault plane exposed along the fault scarp. The white line is 36Cl sample site.
Figure 2b. Fault scarps on SPOT images (cont.)
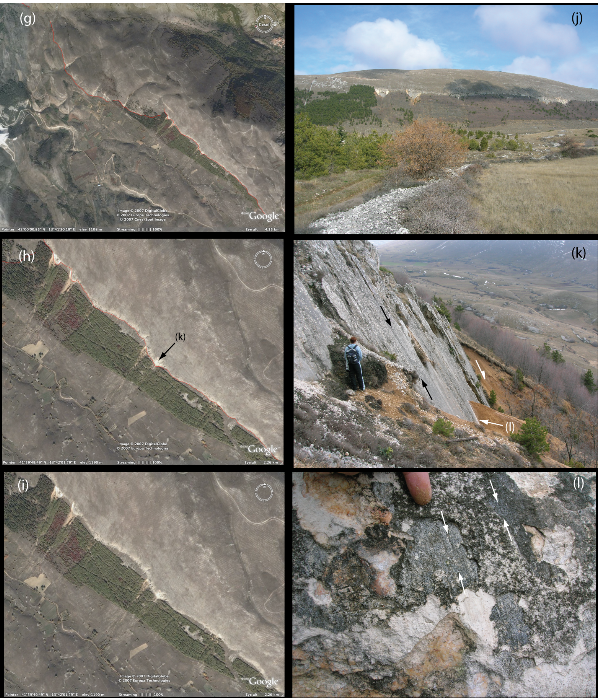
(g) Overview of the Parasano Scarp. (h) Interpretation of the Parasano fault scarp. The prominent white outcrops are the exposed fault plane along the fault scarp. (i) same view as (h) with no interpretation. (j) Outcrop view of the Parasano Scarp. Note the mass movement scars in the hangingwall, shown in more detail in (k) and located in (h). (k) view of the Mesozoic limestone fault plane exposed in a mass movement scar. View is in February, so the trees in the distance do not have leaves (compare with Google views). Black arrows show corrugations recording the movement direction on the fault. The half white arrow shows the downthrow of the Quaternary colluvium in the hangingwall. (l) Close up of the fault plane located in (k) showing frictional wear striae (white arrows) recording the movement direction across the fault. Finger for scale.
However, Roberts and Michetti (2004) and Papanikoloau and Roberts (2007) who mapped the geometry, kinematics and rates of deformation due to earthquakes since 12-18 ka show that spatial variation in fault slip occurs at a scale of tens of kilometres, whilst fault scarps have offsets of <30-40 metres and a geomorphic expression that can only be visualised on topographic images and photographs with spatial resolution at the metre-scale. The difference in scale between the observations and spatial variation, makes it difficult to visualise the deformation using conventional geological and topographic maps. As a result, there remains debate concerning the exact positions of active fault scarps (e.g. compare the fault maps of Valensise and Pantosti 2001, Roberts and Michetti 2004, Papanikoloau and Roberts 2007, Galadini and Galli 2000, Guidoboni et al. 2007, Ithaca Project 2007). This debate needs to be finalised because these earthquake-prone active faults are in an economically developed country with high population density, and the positions and dimensions of the active faults are necessary inputs into seismic hazard assessments (Pace et al. 2002, Roberts et al. 2004).
In this paper, Google Earth is used to map the positions and dimensions of active fault scarps at a regional scale (Figure 1b). The key features that allow recognition of active scarps in Google Earth that have previously been mapped in the field - that is, (1) SPOT images of the scarps themselves (Figure 2a) and (Figure 2b), (2) incised drainage in the uplifted footwalls of the scarps (Figure 3),
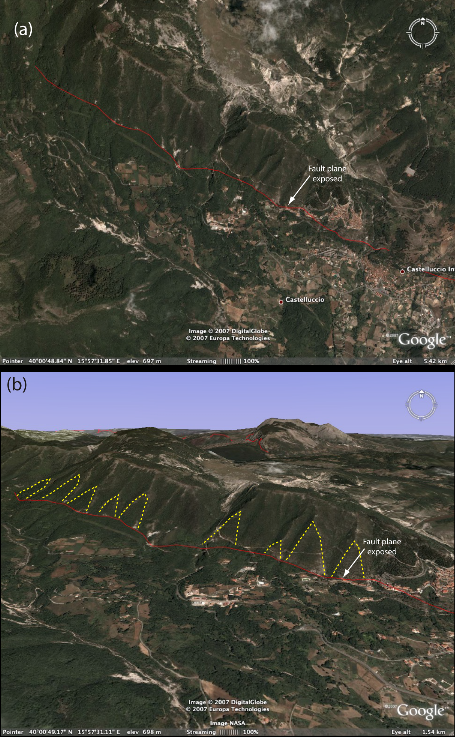
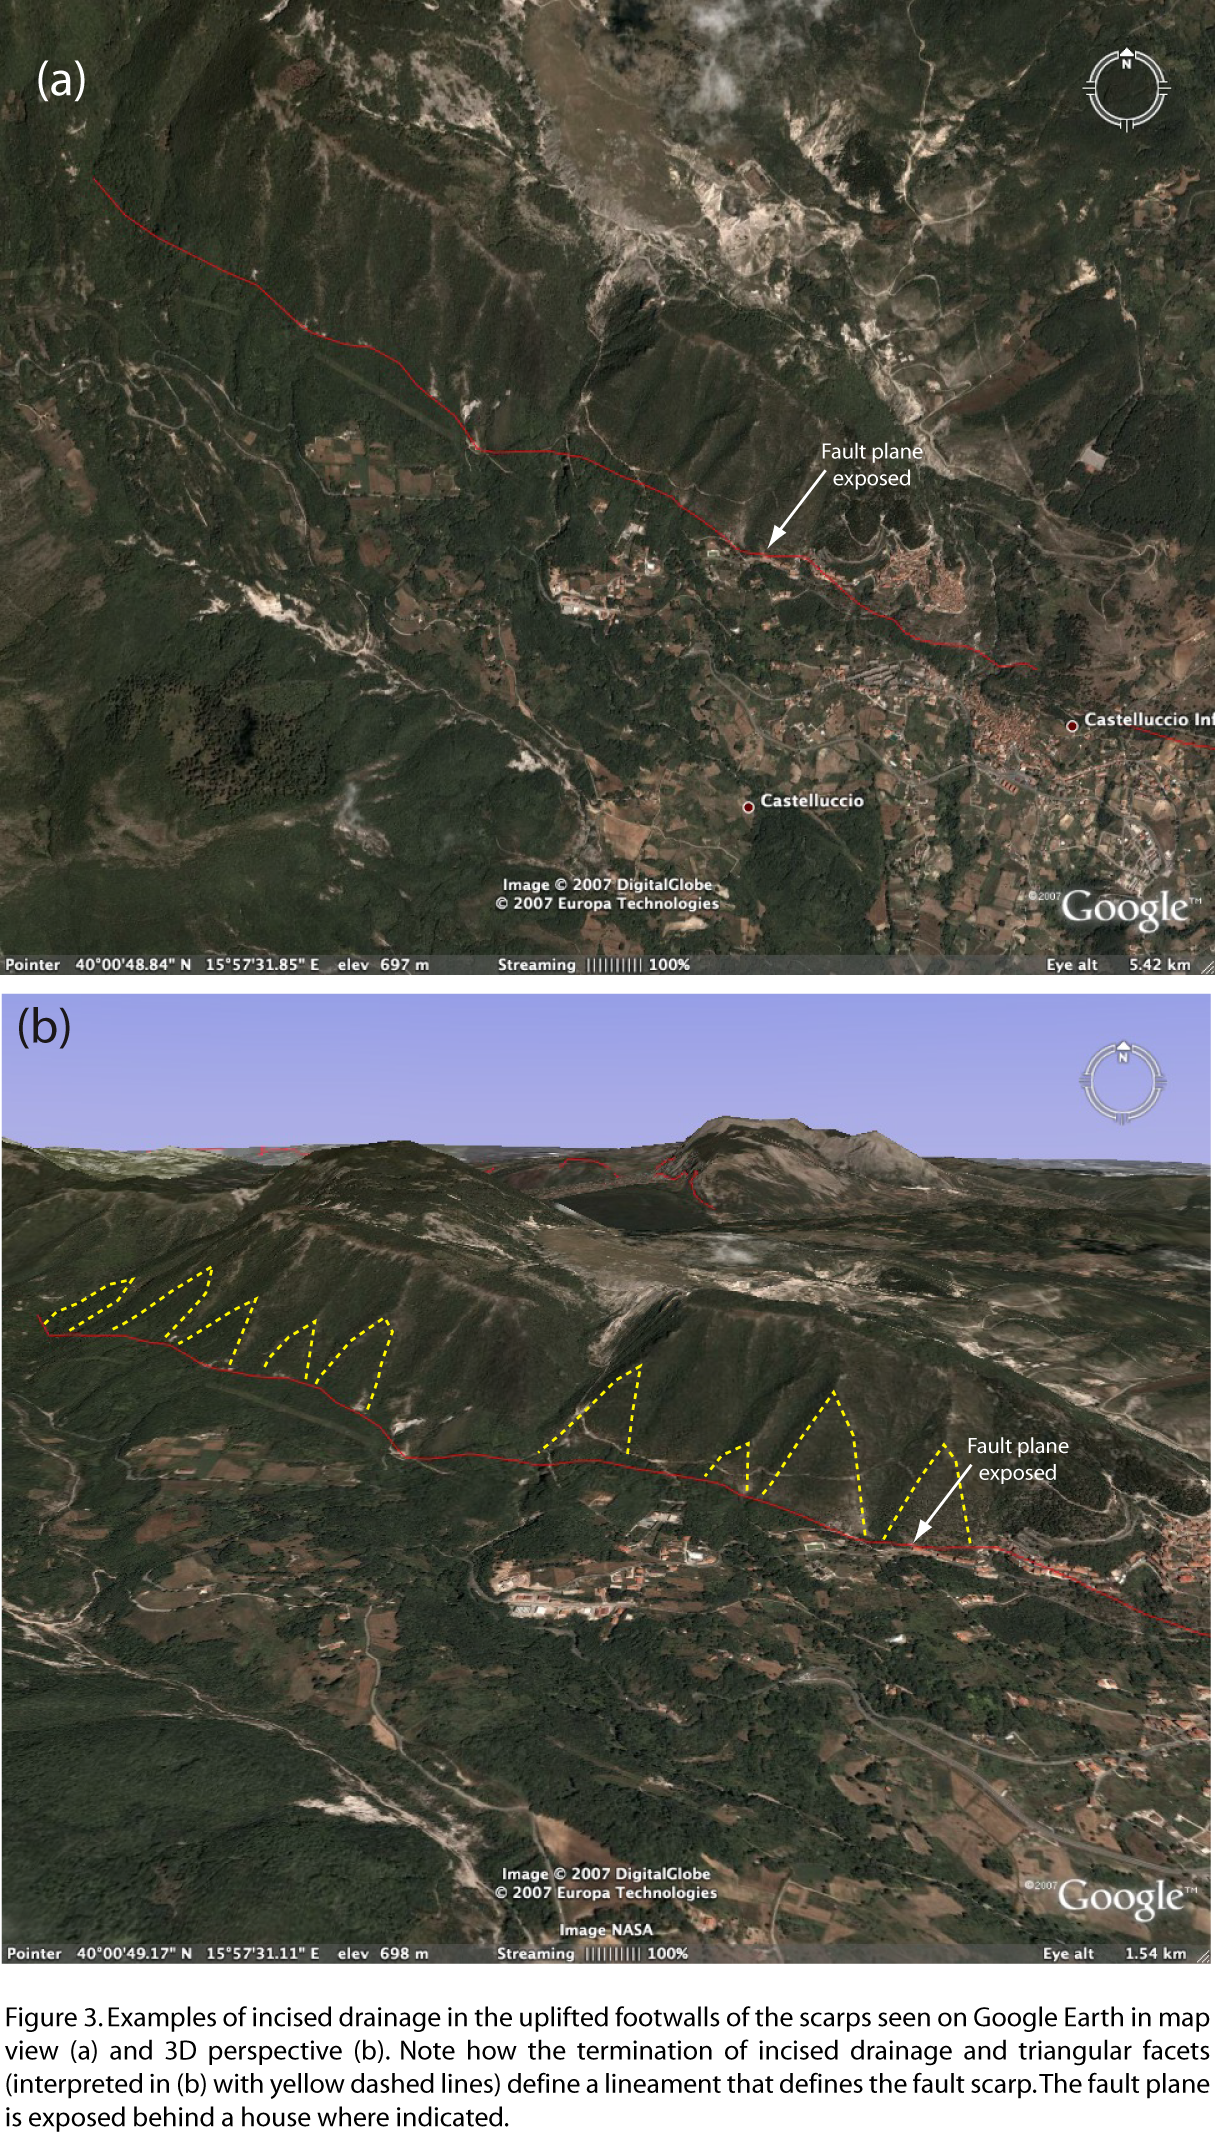
Figure 3. Examples of Incised Drainage
Examples of incised drainage in the uplifted footwalls of the scarps seen on Google Earth in map view (a) and 3D perspective (b). Note how the termination of incised drainage and triangular facets (interpreted in (b) with yellow dashed lines) define a lineament that defines the fault scarp. The fault plane is exposed behind a house where indicated.
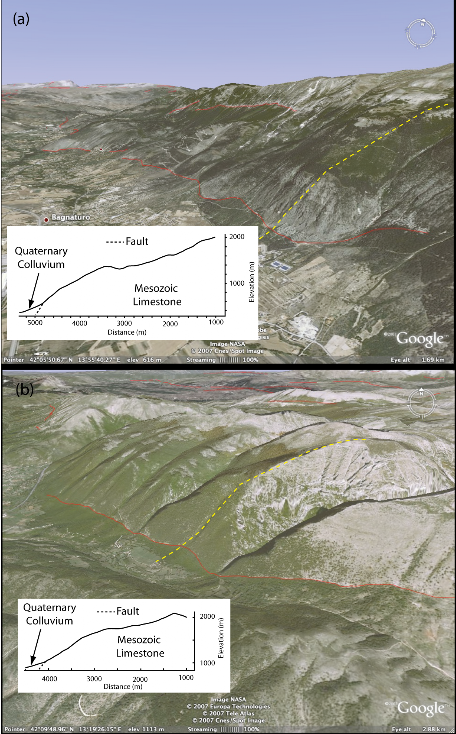
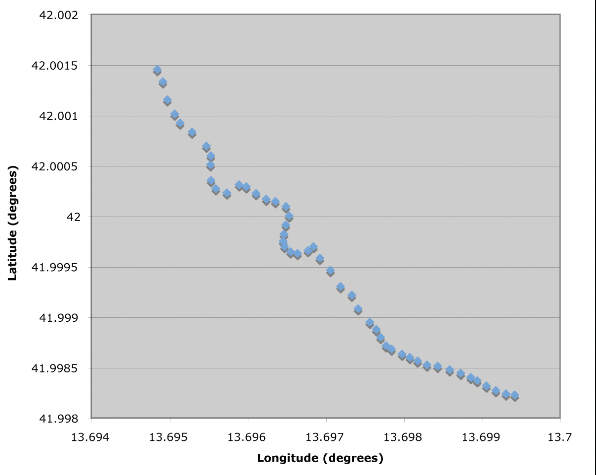
(3) oversteepened bases to escarpments in the footwall of the scarps (Figure 4) - can be visualised using the high photographic spatial resolution and the 3D rendition of the topography within Google Earth. The scarps can be digitised into Google Earth using a “path tool” (Figure 5). Extraction of precise latitudes and longitudes of paths that define the scarps could be used to assess the completeness and accuracy of existing maps of active faults (Valensise and Pantosti 2001, Roberts and Michetti 2004, Papanikoloau and Roberts 2007, Galadini and Galli 2000, Guidoboni et al. 2007, Ithaca Project 2007).
Figure 4. Oversteepened escarpments
Oversteepened base fault escarpments. (a) Sulmona Fault. (b) Velino Fault. Topography from SRTM data. Dashed yellow lines locate the topographic profiles shown as insets. The topographic slopes within 1-2 km of the active niormal faults show steep slope relative to those further into the footwall. This is a characteristic feature of active normal faults where erosion rates are lower than fault slip rates and cannot maintain an equilibrium conave upwards hill slope.
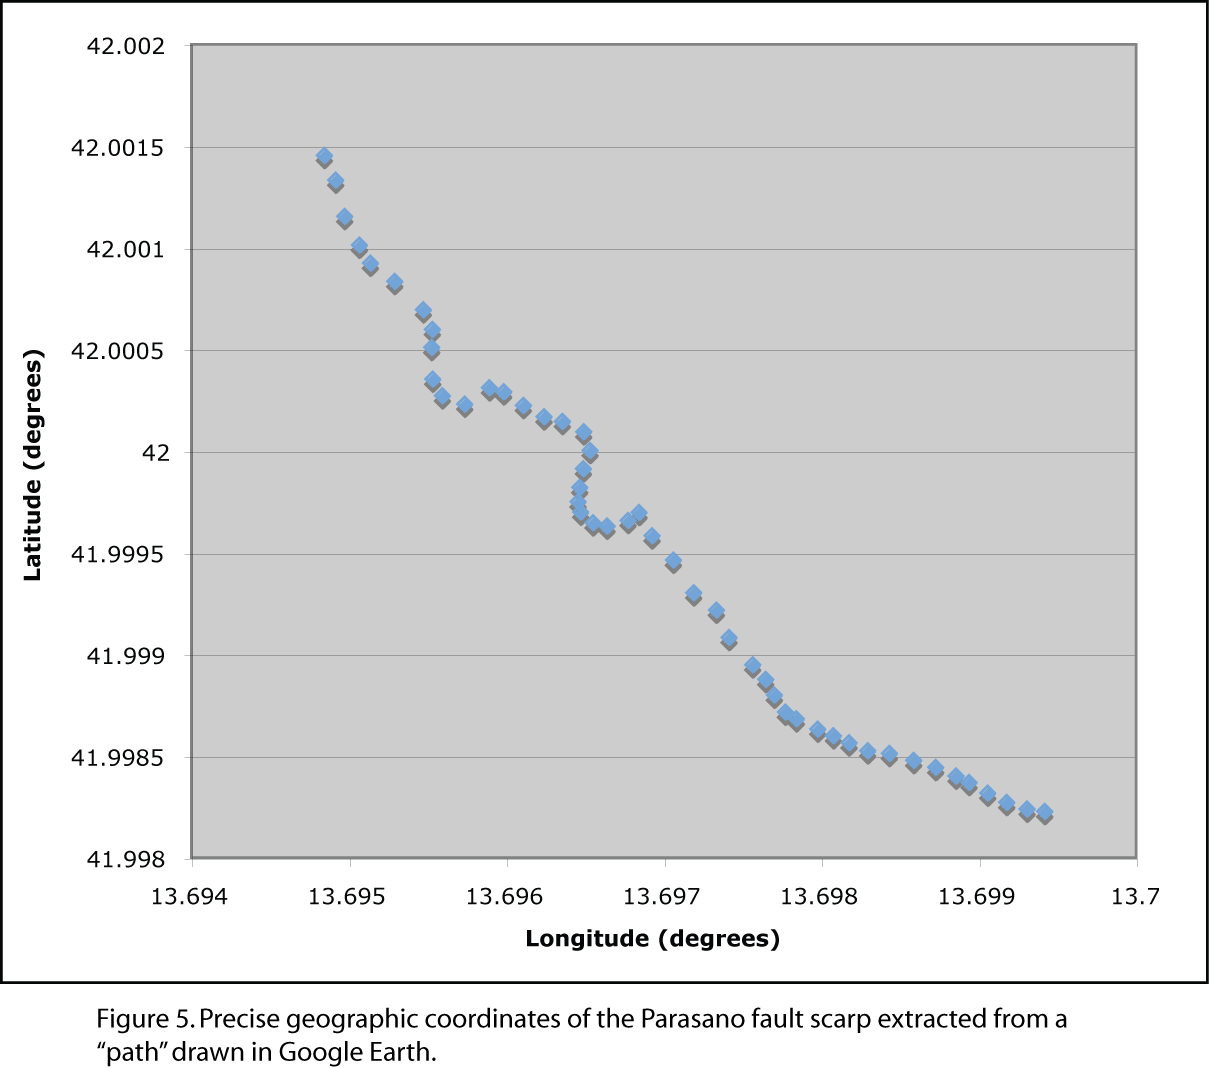
Figure 5. Parasano fault scarp
Precise geographic coordinates of the Parasano fault scarp extracted from a “path” drawn in Google Earth via a “kml file”.