One of the main purposes of using GIS is to generate different types of maps depending on the queries and analysis applied on the database. Arcview GIS refer it to layouts. Following few sample layouts along with their brief description/interpretation have been included in this paper to demonstrate the analytical capabilities of an integrated GIS developed for natural resource management of Pakistan.
The GIS lets the users to make quick and reliable analysis based on its attribute data. (Figure 4) shows districts of Pakistan, represented with different color shades depending upon the population density. Higher population is depicted by darker colors and vice versa. GIS analysis concluded that most of the population has been surrounded around different rivers and stream. With the exception of some areas, which are around the rivers and are not yet densely populated due to some reasons like remote areas, unavailability of roads and basic necessities etc. will become densely populated with passage of time according to the growth trend of population. The main purpose of this type of analysis is the better planning for future, which may include development of roads, railway tracks, housing schemes, drainage channels, drinking water availability and many other such things, which requires to be done before time. Another use of GIS includes the proper resource management for a department whose job is to divide the resources among the districts according to their population and quota. This requires statistical analysis for making decisions, which will lead that department in the right direction. This planning for the future can greatly increases such companies profit ratio.
(Figure 5) shows different metallic and non-metallic minerals of Pakistan associated with different active fault boundaries. All this data have been compiled from Kazmi and Jan (1997). This type of analysis helps the exploration companies to select prospective sites for the possible mineral exploration survey, to understand the mineral occurrence with respect to its tectonics and structural associations.
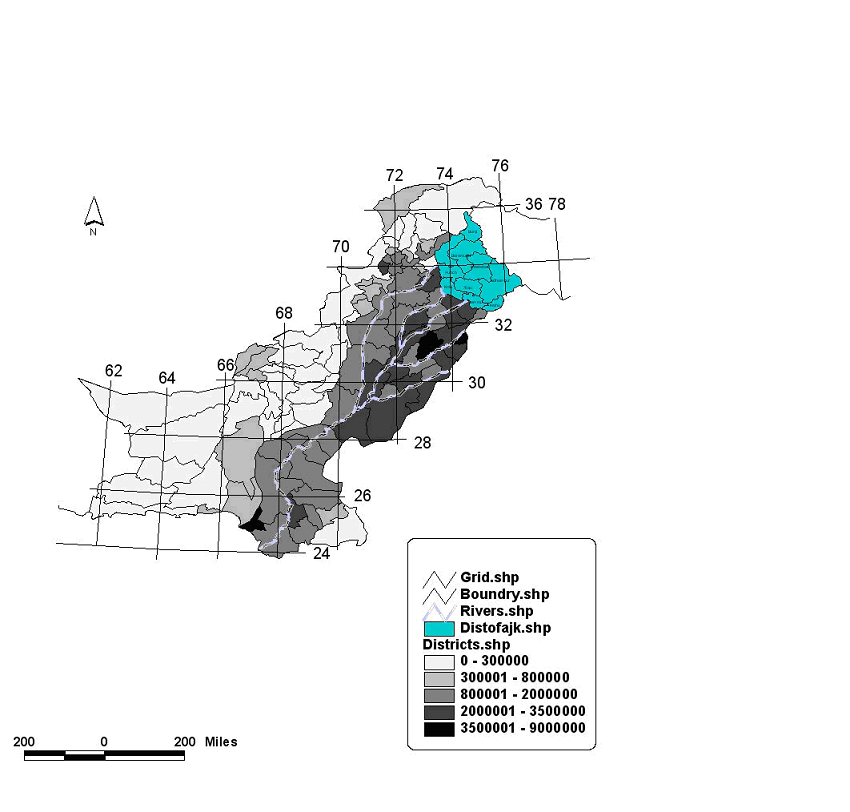
Figure 5. Metallic and non-metallic minerals
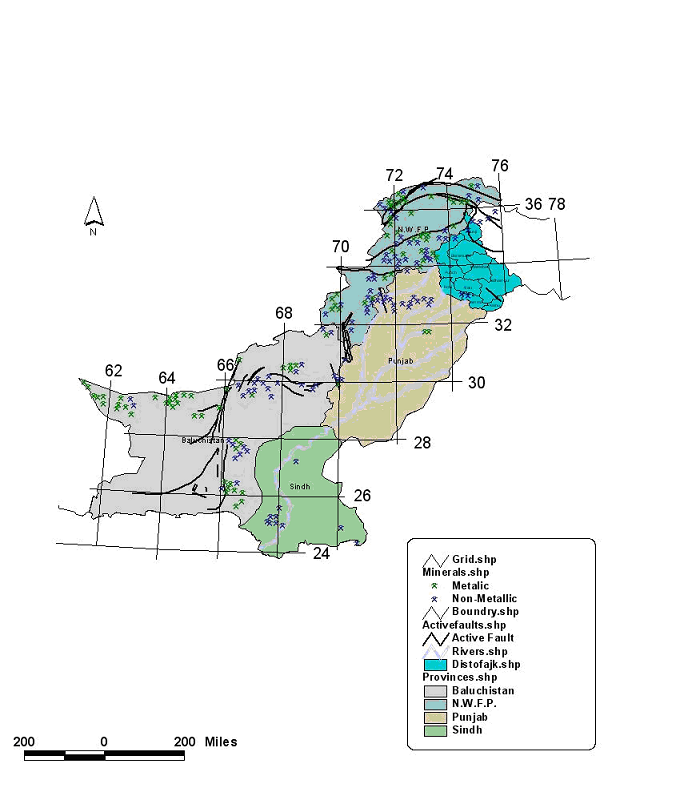
Map showing different metallic and non-metallic minerals of Pakistan associated with different active fault boundaries.
Figure 6 categorized the oil and gas wells drilled in 2004 on the basis of different exploration companies. Major advantage of this layout is to facilitate the foreign companies who are also interested in hydrocarbons exploration in Pakistan. That company, with the help of a GIS, can easily find about the current activities of exploration at a glance and about the companies that are more involved in exploration in that particular area. (Figure 7) shows different oil and gas wells drilled in 2004 with different target depth. This type of quick analysis revealed the trend of increasing target depth in the northern part of country and shallow target depths in the southern part of the country.
(Figure 8) represents moderate-to-major earthquake epicentres of Pakistan and associated areas that have been suffered intensely. This layout will be especially beneficial for engineers, geoscientist, town planners, planning departments, and rescue and relief teams etc. This type of analysis will help the engineers to construct structures like high-rise buildings, dams, bridges etc. according to the prevailing building codes. On the other hand it will also help a lot to minimize the human casualties and property losses.
(Figure 9) shows the distribution of major geological structures in provinces of Pakistan with highlighted active fault boundaries. This will inturn help to explore the minerals associated with different geological structures and hydrocarbon exploration. Furthermore, it will also help to plan better for new water reservoirs, bridges, high-rise buildings, and other mega structures etc.
Figure 6. Oil and gas wells drilled in 2004
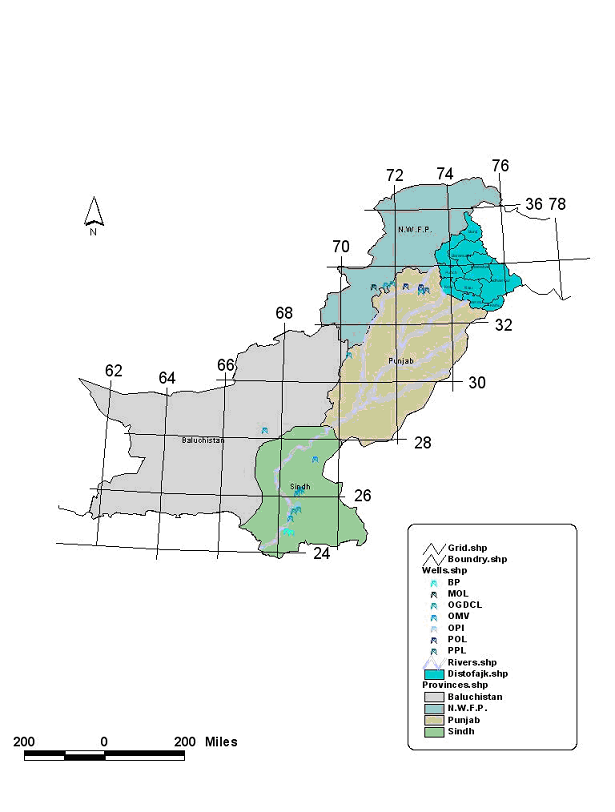
Map showing oil and gas wells drilled in 2004 on the basis of operating company as mentioned in the legend of map.
Figure 7. Oil and gas wells with different target depths
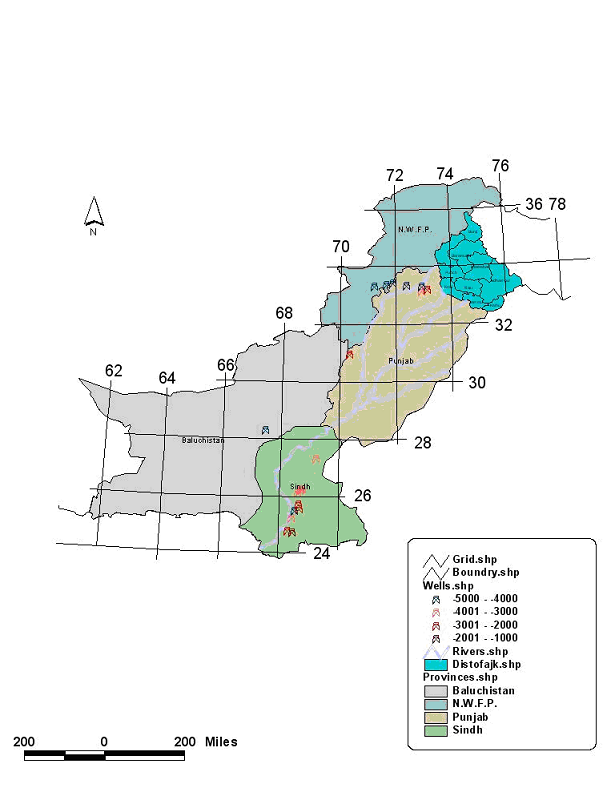
Map showing different oil and gas wells drilled in 2004 with different target depths as mentioned in the legend of map.
Figure 8. Earthquake epicenters

Map showing moderate-to-major earthquake epicenters and intensely suffered areas of Pakistan.
Figure 9. Active fault boundaries
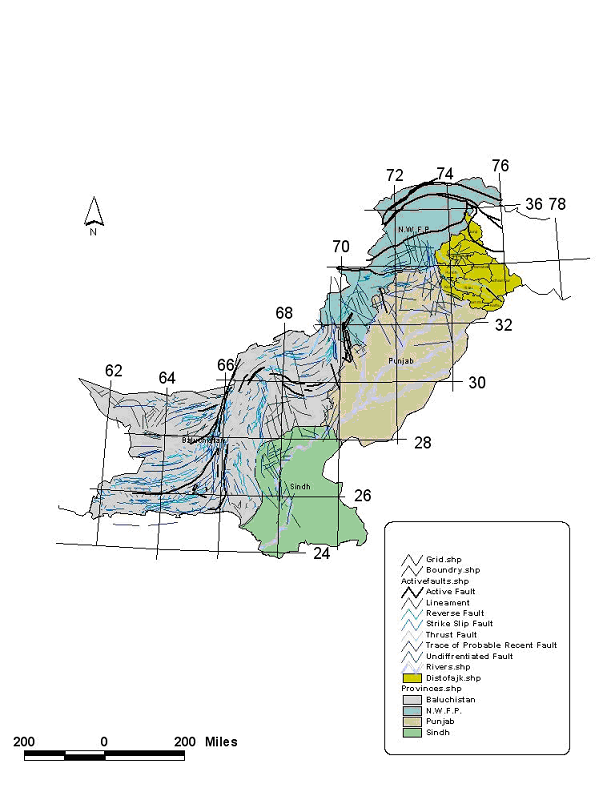
Distribution of major geological structures in provinces of Pakistan with highlighted active fault boundaries.