For sustenance of life water is most essential. The distribution of water on the earth is highly unbalanced. Nearly 97.41% of water is confined to the world’s oceans and are unsuitable for human and livestock consumption (Nath et al., 2000). Major portion of the remaining 2.59% is locked up in the glaciers (1.953%) and beneath the surface as groundwater (0.614%), thus leaving only a meager 0.015% in the rivers and lakes for consumption by terrestrial inhabitants. This quantity of water was enough to support civilization. But, in recent years due to population explosion and urbanization, water resources from rivers, ponds and lakes have become inadequate. Therefore, an urgent need has arisen for exploring and managing surface as well as groundwater resources for continuous and dependable water supply for the growing needs of population. There is need also to safeguard terrestrial habitation from the water inundation caused by natural calamities like floods, tsunamis, cyclones etc. These problems can only be tackled effectively by using the technological advancements that have been achieved by GIS and remote sensing.
The water regime of an area can be explained in terms of the interplay of four critical parameters, namely, rainfall, surface flow, evapo-transpiration by vegetative cover and finally, the infiltration capacity of the surface rocks. In order to manage and regulate water resources, the knowledge of these parameters is essential. These data can be collected through conventional methods like ground survey and by locating gauging stations. In recent times the potential of space borne sensors are also being employed quite effectively in eliciting some of this information.
GIS is built upon knowledge from geography, cartography, computer science and mathematics and can be applied in any field, directly or indirectly. The use of GIS in the natural resource industry is widely recognized and has been used extensively for the exploration of minerals (Ramadan et al., 1999 and 2003), hydrocarbon exploration (Williams, 2000; Porter et al., 2000; Shah, 2003 and Iqbal, 2004) and groundwater exploration and hyrdogeological investigations (Nath et al., 2000; Chi and Lee, 1994; Laurent et al., 1998; Gardino and Tonelli, 1983; and Gustafsson, 1993).
The use of GIS in groundwater investigations is growing tremendously in recent years. Currently, it is used for groundwater potential (Chi and Lee, 1994 and Krishnamurthy et al., 1996) and vulnerability assessment (Rundquist et al., 1991 and Laurent et al., 1998), groundwater modeling (Ross et al., 1991; Baker et al., 1993; Chieh et al., 1993 and Watkins et al., 1996) and management (Hendrix and Buckley, 1989). Using GIS one can play around with the data and generate themes as required for specific applications. Some other common uses of GIS in groundwater modeling have been described by Nath et al. (2000) are summarized in (Table 2).
Table 2. Common uses of GIS in groundwater modeling (after Nath et al., 2000).
| SR. No. | Common uses of GIS |
|---|---|
| 1. | Preparation of data for model input. Contours or Triangular Irregular Networks (TIN) created from point data coverages of aquifer properties are intersected with the model grid. Effective parameters for each cell are assigned automatically and systematically. |
| 2. | Assessment of the adequacy of the model input through the visual display and/or comparison of contour or TIN values (such as in making sure the top of the aquifer is not above the land surface). |
| 3. | Allocation of pumping and recharge rates to each grid cell. |
| 4. | Visual comparison of simulated and measured head or concentration values. |
| 5. | Interactive revision of parameter values and/or spatial discretion. |
| 6. | Display of model results such as contours of hydraulic head, flow vectors and water quality contours. |
GIS technologies greatly facilitate the development, calibration and verification of groundwater models, as well as the display of groundwater model parameters and results. Through the linking of a digital mapping system to database, GIS has the ability to integrate data layers and perform spatial operations on the data. Thus, GIS can automate many of the data compilation and management duties in groundwater modeling. Spatial statistics and grid design capabilities of GIS can improve the modeling effort and aid in reliability assessment. Furthermore, GIS have many visual display capabilities that can aid in calibration, verification and the production of final results (Watkins et al., 1996).
The utility of GIS in hydrologic parameter estimation is demonstrated by Bhaskar et al. (1992) by using 12 watersheds from eastern Kentucky, USA. A GIS database comprising the hydrography, soils, and land use of these watersheds was created. They found that GIS is capable of putting together the voluminous information typically required in hydrologic modeling. Compilation of various geomorphic properties of drainage basins like drainage densities and channel frequencies could also be efficiently done using the GIS.
Gardino and Tonelli (1983) used remote sensing to detect freshwater submarine springs in the coastal areas of Italy, Sicily and Sardinia. About seven hundred such springs have been studied along a coastline of 1500 km. Gustafsson (1993) used SPOT multi-spectral and panchromatic data to study hydrogeological properties of a large semi-arid region in southeastern Botswana.
Nath et al. (2000) used GIS and Remote Sensing tools and found them best suited for hydrogeological investigations. The study area was Midnapur District, West Bengal, India covering an area of 631 km2 with an average annual rainfall of 152cm and temperature of 31°C. It is a typical soft rock area with hydrogeological conditions favorable for shallow groundwater reserves. For groundwater investigations, thematic maps of surficial geology and drainage pattern were prepared from IRS-1B LISS-II data. The data has spatial and radiometric resolutions of 36m and 7 bits respectively. A thematic map of drainage pattern of the study area was prepared using False Color Composite (FCC) using bands 1, 2 and 3 (red, green and blue) of the image. The water bodies were identified by their blue tone and fine texture. A GIS package was used to digitize the rivers, streams and channels from the image. The evolved thematic model to assess the groundwater potential of a soft rock area by integrating seven geological and hydrogeological themes (lithology, geomorphology, soil, net recharge, drainage density, slope, and surface water body) is presented in (Figure 4). The field verification of this model undoubtedly establishes the efficacy of the GIS integration tool in demarcating the potential groundwater reserve in soft rock terrain.
Figure 4. Thematic map of geology and drainage pattern
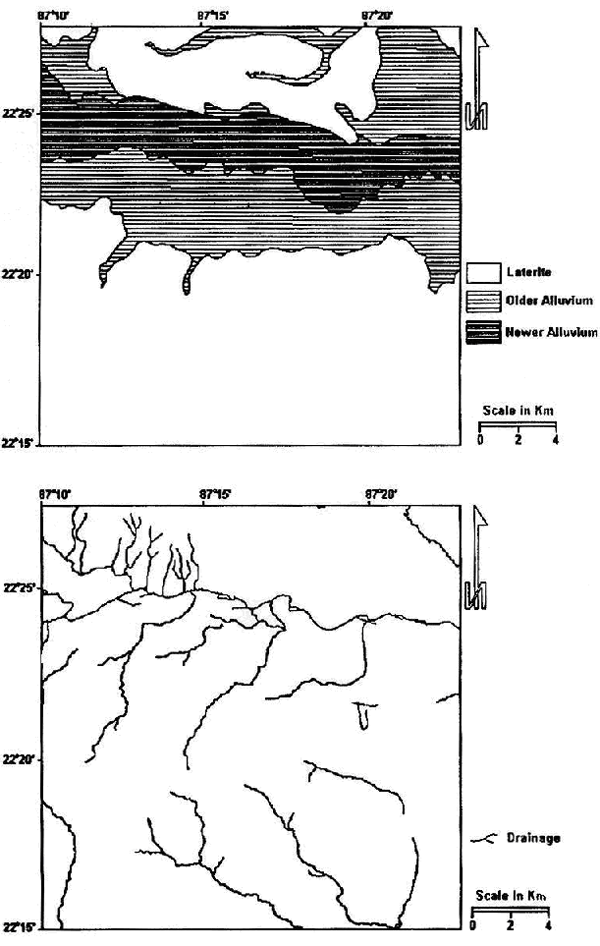
Thematic map of geology (above) and drainage pattern (below) generated from IRS-1B LISS-II data (after Nath et al., 2000).