We decided to adopt an XML data schema (see Castro 2001) because of the near-universality of extensible markup language and it easy extensibility to cover the needs of sub disciplines such as geophysics (De Paor 1999, De Paor et al. 2004, 2005, Babaie & Babaei, 2002, 2003a,b,c). XML data files can be created and edited with a text editor such as Microsoft Word™. The file must be saved in the same directory as the flash swf file, with the name "data.xml". XML data files are organized by tags. A tag in XML is a string of text surrounded by angle brackets. Tags often come in pairs, e.g. "<myTag>" and "</myTag>", in which case they affect the text that they enclose. Alternatively, such opening and closing tags may be combined into one tag in which the slash comes at the end. Tags may have one or more attributes, as illustrated by the "image", "circle", and "point" tags below. Note that white space is ignored and that the order of attributes is irrelevant (compare the last "point" tag the the preceding ones.)
Example 1. An example XML document
<?xml version="1.0"?>
<firstMotions>
  <image file="FocMechSolnFig2.jpg" x="-50" y="-350" scale="200"/>
  <stereonet Cx="300" Cy="300" Cr="300"/>
  <pole plunge="35" trend="140" symbol = "down"/>
  <pole plunge="15" trend="050" symbol = "noSignal"/>
  <pole plunge="55" trend="060" symbol = "noSignal"/>
  <pole plunge="65" trend="020" symbol = "up"/>
  <pole plunge="05" trend="338" symbol = "up"/>
  <pole plunge="15" trend="150" symbol = "up"/>
  <pole plunge="15" trend="100" symbol = "down"/>
  <pole plunge="15" trend="210" symbol = "noSignal"/>
  <pole plunge="45" trend="180" symbol = "down"/>
  <pole plunge="25" trend="230" symbol = "noSignal"/>
  <pole plunge="10" trend="120" symbol = "down"/>
  <pole plunge="15" trend="010" symbol = "up"/>
  <pole plunge="15" trend="280" symbol = "down"/>
  <pole plunge="15" trend="320" symbol = "up"/>
  <pole plunge="10" trend="120" symbol = "down"/>
  <pole trend="190" symbol = "up" plunge="10" />
</firstMotions>
In Hypertext Markup Language (HTML), tags control the format and style of a web page. For example, the sentence "this is an <em>example</em>" will appear on the web page as "this is an example". In contrast, xml tags denote content. Example 1 illustrates the tags used for our focal mechanism generator. The first tag must be the xml identifier tag, "<?xml version="1.0"?>" or equivalent. This is followed by the "<firstMotions> </firstMotions>" tag pair. Nested within the latter are three types of tag.
Figure 3. First Arrival
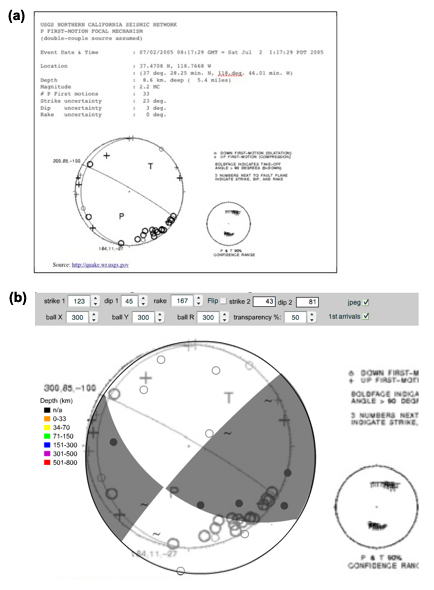
a) Sample web page from http://quake.usgs.gov showing first arrival data.
b) Image from (a) is used as a background in FirstMo.swf. Toggling the jpeg checkbox shows and hides the image. The 1st arrivals check box permits XML data to be superimposed. In practice, the jpeg stereonet would be repositioned and resized to coincide with the beach ball.
The "<image/>" tag allows a jpeg file to be loaded as a background image. Attributes specify the name of the file (which must be stored in the same directory), the coordinates of its top left corner, and a scale factor used to stretch the image equally in the horizontal and vertical directions. A background image could be an image of raw data plotted on a stereographic projection. For example, the focal mechanism solution in Fig. 3 has been constructed on top of a background image of raw first arrival data from a USGS web site. For this demonstration, the location and scale attributes have not yet been adjusted to achieve congruence of the beach ball and background stereonet. Alternatively, the background image could be a map including the event’s epicenter, as in the USGS sample in Fig. 4. The user can vary the transparency of the beach ball in order to view or hide the underlying data or map.
The second type of tag that can be nested within the firstMotion tags is the "<stereonet/>" tag. Its attributes determine the x- and y- coordinates of the center and the radius of the stereographic projection used to plot the subsequent pole data.
The third tag type is "<pole/>". Its attributes denote the plunge and trend of a receiving station and the direction of ground motion caused by the first arrival, as determined by the seismogram. Upward ground motion is rendered as a solid dot, down as an open circle, and no signal is indicated by a tilde. Pole data is plotted in equal-angle stereographic projection using the pseudo-code in Example 2.
Example 2. Example equations
d = Cr*tan(pi / 4 – plunge / 2);
x  = Cx + d * COS(trend – pi / 2);
y  = Cy + d * SIN(trend – pi / 2);