Earthquakes frequently involve a simple double-couple motion (e.g., Sherburne & Cramer, 1984, Cronin 2004; see also, http://earthquake.usgs.gov/learning/glossary.php), meaning that slip movement is confined to a direction parallel to a planar failure surface (either an existing fault plane or a newly formed fracture), with no component of motion perpendicular to the plane. The combination of a specific failure plane and a slip direction for the oscillatory motion along that plane is called a focal mechanism, and is analogous to a slip system in crystal lattice-scaled deformation mechanism studies.
Fault slip initiates at a point, the focus or hypocenter. The disturbance propagate radially, both through the surrounding body of the rock and along the surface, as a complex set of elastic waves that are recorded at receiver stations around the globe. The wave packages that penetrate the earth include push-pull, or P-waves, traveling at velocity
and sideways-shearing, or S-waves, traveling at velocity

where k is the bulk modulus (resistance to pressure waves), m is the shear modulus (resistance to shear waves), and r is the rock density. Typical values for granite and perdotite are k = 88 - 139 × 109 N/m2, m = 22 - 58 × 109 N/m2, and r = 2.6 - 3.3 gm/cc, yielding crustal and mantle velocities of Vp = 6.7 - 8.1 km/s and Vs = 2.9 - 4.2 km/s (e.g., Lillie, 1999). Thus the first arrivals at seismic stations, some minutes to tens of minutes after the seismic event, are the faster P-waves and the initial deflection they create on seismographs are called first motions (Fig. 2a). A first motion emerging from the earth at a seismic station may either shorten crystal bonds in the displacement direction, leading to compressional stress (and a "down" tick of the seismograph), or it may lengthen bonds, leading to tensile stress (and an "up" tick on the seismograph). With classical paper roll seismographs, inertia causes the pen the remain fixed while the rest of the instrument shifts, resulting in an down tick of the ink line when the ground motion is up and vice versa. Modern computerized equipment flips the record, so that an up tick of the graph denotes upward ground motion.
Figure 2. Quake screens
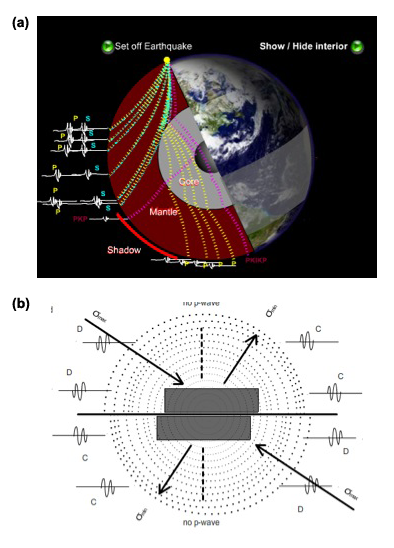
a) After an event, first arrivals at seismic stations around the globe are always P-waves. S-waves lag behind as a function of distance and are blocked completely by the outer core. Click here (FIXME) to run the shockwave flash animation. photo source: NASA.
b) First motions recorded from dextral slip on a fault plane (bold horizontal line). C’s denote compressional and D’s denote dilatational first arrivals Seismographs are drawn from left to right. There are no p-wave arrivals in the direction of the auxiliary plane (dashed line) . Arrows indicate principal stresses smax and smin (which is shown as a tension in this case). Dotted circles are initially concentric passive markers. Click here (FIXME) to run the shockwave flash animation.
If seismic stations were distributed uniformly about a hypothetical sphere called the focal sphere, centered on the hypocenter, we would expect compressional first motion arrivals (labeled C) and dilatational first motion arrivals (labeled D) to be distributed in quadrants as in Fig. 2b (ignoring deflections due to detailed mantle or crustal structure). The compressed quadrants are conventionally shaded black, and the dilated quadrants are left white, creating the appearance of a beach ball (e.g., USGS 1996). The beach ball quadrants are bounded by two great circles representing the nodal planes. One of these is the fault plane and the other is called the auxiliary plane. Assuming, for simplicity, that failure occurs on planes of maximum shear stress, the maximum (compressive) and minimum (tensile) principal axes of the stress ellipsoid bisect the dihedral angles subtended by the nodal planes, while the intermediate principal stress is aligned along their intersection. Note that the maximum principal stress (compression) lies in the dilated quadrants whereas the minimum principal stress (which may be a smaller compressive or a tensile stress) lies in the compressed quadrants.
The above stress orientation is equally valid for slip on either nodal plane. We are thus faced with an ambiguity when we try to determine the focal mechanism given scattered first motion data. Small quakes, aftershocks, and general tectonic setting may help distinguish the fault plane from the auxiliary plane. For example, faults in thrust belts commonly dip at 30° or less whereas normal faults dip 60–70°. According to the Mohr-Coulomb failure criterion, the maximum stress axis is actually oriented at less than 45° to the fault plane, and the amplitudes of ground motions are greater for receiver stations oriented near the real fault plane compare to equally distant stations in the direction of the auxiliary plane (Fig. 2b). Ray tracing and analysis of incident angles and take-off angles may also be used to distinguish the real fault plane from the auxiliary plane, however only the ground motion and the plunge and trend of the direction of the receiving station are used in the current work.
In practice, we have access to data from a sparse and decidedly non-uniform set of seismic stations distributed around the Earth’s curved surface, but these can yield enough control to divide the hypothetical focal sphere into quadrants of compression and dilatation if the earthquake magnitude is sufficient to cause ground motion at widely distributed stations. See Zahradnik et al. (2001), Preston et al., (2004), and Imanishi et al. (2006) for a discussion of weaker, M < 3, solutions). Because there are no seismic stations in the sky, we plot the lower half of the three-dimensional beach ball on a lower hemisphere stereographic projection centered on the epicenter. Beach Ball shading may be color-coded to denote focal depth using standard USGS colors (Fig. 3; see also, http://neic.usgs.gov*).
The best fit to combined moment magnitude and orientation data for a given earthquake is call the moment tensor solution. The size of the reference sphere, and thus the radius of its stereographic projection, is arbitrary and can be used to represent the moment magnitude of the earthquake.