Melt processes, especially the existence of a three dimensional melt network, are of fundamental importance for melt migration and segregation, which is important in the upper mantle and the lower crust of the Earth [McKenzie, 1984; Scott and Stevenson, 1986; Sleep, 1988; Laporteet al., 1997; Rabinowitcz et al., 2001; Wark et al., 2003]. Furthermore, melt distribution and redistribution is a key factor in geological processes such as flow of (poly)crystalline aggregates or the homogenization of partial melts by chemical diffusion [Cooper et al., 1984; Laporte et al., 1997]. Many properties of systems with small amounts of melt depend on the distribution of the liquid phases at the grain scale. In high temperature experiments that were performed with major rock-forming minerals such as dunite + maficor ultramafic melt [Waff and Bulau, 1979; Hirth and Kohlstedt, 1995; Faul, 1997; Cmíral et al., 1998] or quartz + felsic melt [Jurewicz and Watson, 1984; Laporte, 1994; Laporte and Watson, 1995] apparent disequilibrium features were described that deviated from the predicted regular melt geometry:
fully wetted grain boundaries and melt lenses on grain boundaries
strongly distorted, melt-filled triple junctions
large, multigrain-bounded, melt pools.
These disequilibrium features where shown to have a potentially large impact on the porosity–permeability function of partially molten rocks, especially at low melt-fraction such as considered in the upper mantle [Faul, 1997; 2001]. It has been recognized that variations in grain size and crystal lattice–controlled surface-energy anisotropy modifies the actual liquid distribution in natural aggregates [Waff and Faul, 1992; Laporte and Watson, 1995; Jung and Waff, 1998; Wark et al., 2003]. The frequent observation of straight crystal facets of grains in contact with melt supports the latter explanation for nonequilibrium melt geometries [Waff and Faul, 1992; Hirth and Kohlstedt, 1995; Jung and Waff, 1998; Faul, 1997; Laporte and Provost, 2000]. Although quartz is considered to be more isotropic than olivine, all the above mentioned non-equilibrium features were observed in quartz + melt systems as well [Laporte, 1994; Laporte and Provost, 2000]. It is therefore important to study the liquid distribution in natural aggregates using experiments and/or numerical simulations. However, in experiments with natural rocks (HT-experiments), some of the main controlling parameters of melt processes cannot be measured or controlled and these experiments do not allow a continuous observation but rather, after quenching of the sample, show a snapshot of the process at the time of quenching (for examples of HT-experiments see [Tullis et al., 1973; Jurewicz and Watson, 1984; Hirth and Kohlstedt, 1995; Laporte and Watson, 1995; Faul, 1997] and references therein). This is insofar unsatisfying as the development of melt pockets and/or grain boundaries give valuable insights into the behavior of melt, its redistribution, development of non-equilibrium features and splitting or merging of non-equilibrium shaped melt pockets [Faul, 1997].
In situ experiments using analogue materials were performed to study the dynamic development of grain-boundary structures and melt segregation under deformation with a continuous observation of the experiment [Park and Means, 1996; Bauer et al., 2000; Rosenberg and Handy, 2000; Walteet al., 2003. Walte et al. (2003)] concentrate on influences of static grain growth on the development of disequilibrium structures in static systems and we will compare our results from numerical modeling of a static solid-liquid system with their experiments. They find that all previously observed disequilibrium-structures can develop due to the collapse of small grains during coarsening of the whole aggregate [Walte et al., 2003]. Using numerical modeling, we have additional control on important parameters like relative solid-solid and solid-liquid surface energies and are able to continuously observe the interacting processes and hence the evolution of melt pockets and grains.
Jessell et al. (2001) have introduced a numerical model called Elle that is based on a set of different modules each simulating one aspect of deformation or metamorphism of natural rocks on the grain scale. Here, we introduce an Elle-module that can be used to simulate melt processes at the grain scale. In this module, only the known and/or assumed physical laws for the distribution of a liquid-phase within a solid matrix are used and, in contrast to e.g. HT-experiments, different parameters are easily controlled or changed. Therefore, Elle is a superb tool to test and enhance the physical laws obtained from HT-experiments or, in more general terms, natural observations since it allows full control on all used parameters and the results cannot be modified by unknown, or unconstrained material properties, geological or physical mechanisms and scaling problems.
In a partially molten, monomineralic system, the equilibrium melt distribution is characterized by a constant wetting angle whose value is a function of the surface energies of solid-solid boundaries(γss) and solid-liquid boundaries (γsl) [Laporte et al., 1997]. The wetting angle can be easily calculated using relative surface energies from the following equation [Bulau et al. 1979]:
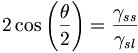
with θ as the wetting angle and γss or γsl as solid-solid or solid-liquid surface energies respectively. If 0° < θ < 60°, melt pockets have convex boundaries Figure 1a and an interconnected network of channels along grain edges exists, even for an infinitesimally small amount of melt [Bulau et al., 1979]. If Δt > 60°, the melt occurs as isolated concave pockets at grain corners Figure 1c [Laporte et al., 1979]. If Δt = 60°, the melt pocket has straight boundaries Figure 1b while with Δt > 60° the melt pockets tend to have concave boundaries (Figure 1c) [Laporteet al., 1979].
Figure 1. Pictures of different stages during simulation 1a
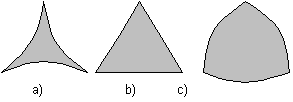
Shapes of melt pockets at different wetting angles:
θ = 10°θ = 60°θ < 60°
It has also been suggested (see [von Bargen and Waff, 1986; Laporte et al., 1997] and references therein) that the curvature of the solid-liquid interfaces is constant since it results from the wetting angle at solid-liquid interfaces.