Figure 5. Initial setup of Animation 1 and Animation 2
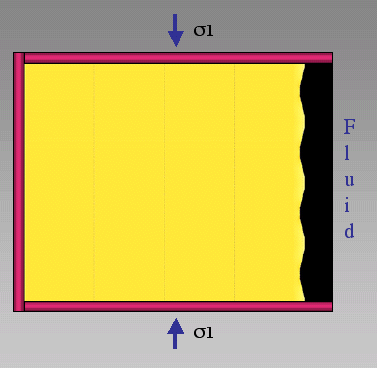
Initial setup of Animation 1 and Animation 2, the resolution of the lattice is 1000 x 1000 particles. The crystal is stressed vertically (with respect to the figure if it stands upright) and can dissolve from the right hand side. An initial roughness in the form of a sin-wave is applied to the fluid-solid interface.
We choose to present the dissolution patterns that develop on stressed crystal surfaces in three different sections with three different initial setups. In the first section we are concerned with the detailed development of the ATG-instability on a crystal surface with a predefined roughness that has a given wavelength and amplitude (Figure 5 and 6). We choose this setup because it is used in linear stability analysis [Srolovitz 1989; Gal et al. 1998] and in numerical simulations of Ghoussoub and Leroy (2001). Therefore we can compare the developing structures and their dynamics directly to the presented method. In the second section we are concerned with the propagation of anti-cracks that develop out of the ATG-instability.
We choose a setup of a vertically stressed crystal in contact with fluid on its sides and with a central elliptical hole (Figure 7). This setup is on the one hand similar to the experiment of den Brok and Morel (2001) and on the other hand we can compare the shape of the developing anti-cracks with the structures that develop in the simulations of Kassner et al. (2001). In the third section we show the interaction of anti-crack propagation and growth of mode I fractures on anti-crack walls in a stressed crystal with a small central hole (Figure 8). In the simulations stresses are applied vertically with respect to stressed crystals that stand upright.
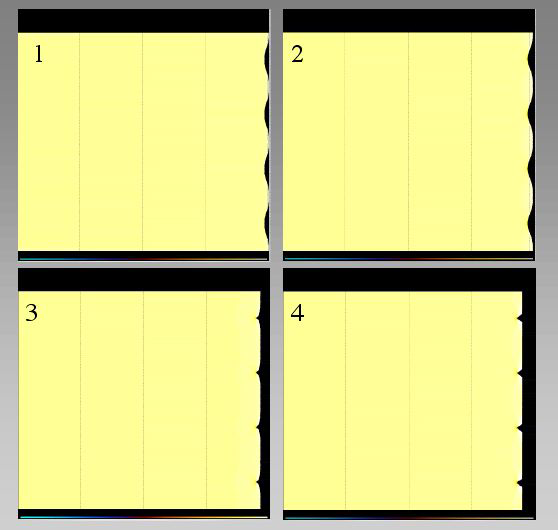
Figure 6. Intial setup of Animation 3
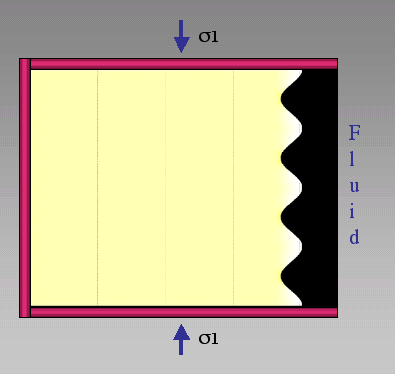
Same setup as in Figure 5 but with a sin-wave that has a larger amplitude than that of Figure 5. Initial setup for animation 3.
Figure 7. Initial setup of Animation 4 and Animation 5
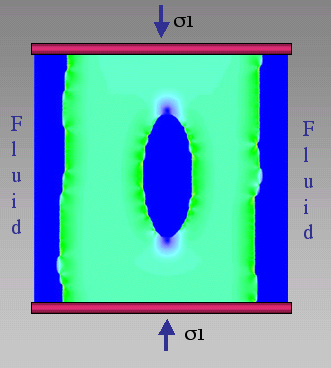
Initial setup for animations 4 and 5. A crystal with a central elliptical hole is stressed vertically (with respect to the figure if it stands upright). The crystal is in contact with fluid on its right and left hand side and within the hole. The resolution of the lattice is 400 x 461 particles.
All the simulations were performed with kinetics for a quartz and pure water system. Relevant system parameters are (Rimstidt 1997): temperature (200°C), rate constant for quartz dissolution at 200°C (1*10-7 mol sec-1 m-2), Youngs modulus of pure quartz (90 GPa) and molar volume of quartz (22.688*10-6 m3 mol-1). The amount of particles used for the simulations and their absolute size varies.
Figure 8. Initial setup of Animation 6 and Animation 7
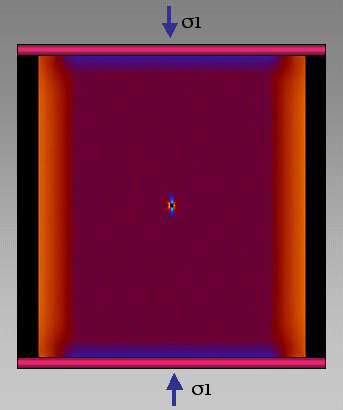
Initial setup of animation 6 and 7. The crystal is stressed vertically (with respect to the figure if it stands upright). Crystal can only dissolve from the boundary of the small hole in the center. Resolution of the simulation is 600 x 600 particles.
Animation 1. Dissolution of a stressed crystal
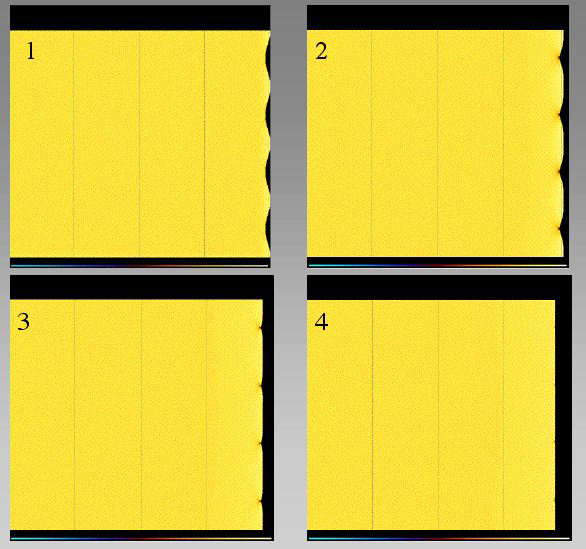
Movie shows dissolution of a stressed crystal with an initial roughness on its surface. Cusps develop but surface energy is too high for the initiation of the ATG-instability and the surface evolves to a flat shape. Color-scale represents elastic energy where blue is high and yellow low energy.
To model the initiation of the ATG-instability we choose a setup similar to the one of Gal et al. (1998) and Ghoussoub and Leroy (2001). A vertically stressed crystal is in contact with fluid on the right hand side. The surface has a predefined roughness with a wavelength that is a fourth of the height of the box with an amplitude that is 0.025 * wavelength (Figure 5) and 0.25 * wavelength (Figure 6). The crystal is stressed once and the dissolution patterns develop. We use resolutions of 1000000 particles per box for the three simulations presented in this section in order to attain patterns with a high resolution so that the discreteness of the model has no influence on the results. The boundaries of the model are made up of elastic walls.
Animation 1 shows a simulation with a predefined wavelength of 3.3 µm and a small amplitude. The colors represent the elastic energy where blue is high and yellow low energy. The vertical stress on the crystal is 240 MPa and the fluid pressure constant at a value of 24 MPa. At this scale the ATG-instability is producing a localization and small cusps but the surface energy is dominating over elastic energies so that the patterns disappear and the surface becomes flat. Once the surface is flat it remains flat and dissolves with a constant dissolution rate that is in accordance with the theoretically predicted dissolution rate from equation 3.
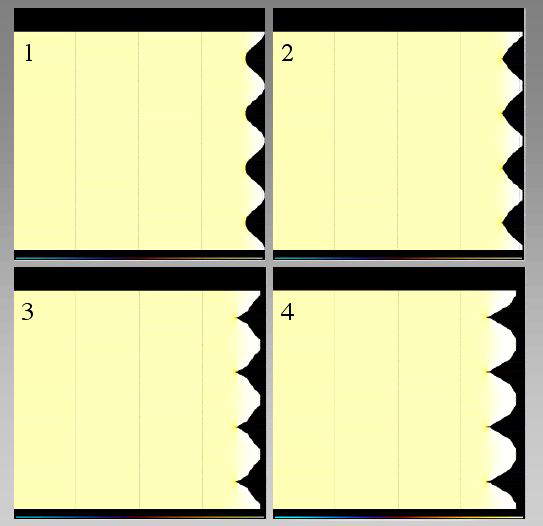
Animation 2 shows a simulation with a predefined wavelength of 3.4 µm and also a small amplitude. The color scale and the stress are the same as animation 1. Elastic energy concentrations in the valleys of the roughness drive dissolution as in animation 1. However the small change in wavelength from animation 1 to 2 of 0.1 µm is enough to stabilize the roughness. The ATG-instability develops again small cusps as in animation 1 but now the elastic energy concentration at the tips of the cusps is enough to overcome the surface energy. The cusps develop into dissolution grooves that are similar to the grooves found by den Brok and Morel (2001). Linear stability analysis [Srolovitz 1989; Gal et al. 1998] predicts that a surface roughness has to have a critical wavelength in order to develop a growing ATG-instability. This critical wavelength lies between the wavelength of the roughness in animation 1 and 2. However, whether or not the roughness survives is also dependent on its amplitude. This is normally not included in stability analysis except for the work of Ghoussoub and Leroy (2001). A larger initial amplitude has a stabilizing effect on the roughness since it produces higher elastic energy concentrations.
This effect is shown in animation 3 where the initial amplitude is 0.25*wavelength and the wavelength 2.1 µm. Now the wavelength of 2.1 µm lies within the region of roughness growth and large-scale cusps develop out of the initial roughness. In animation 3 the cusp development is smaller than the wavelength of the roughness so that the initial localization develops within the valleys. Only later does the structure grow towards large cusps that are on the scale of the initial wavelength.
Animation 2. Increased wavelength
Movie shows same setup as Animation 1 but with a roughness that has a slightly larger wavelength. Elastic energy can now overcome surface energy and the ATG-instability develops. Cusp instabilities evolve into grooves on the crystal surface. Color-scale represents elastic energy where blue is high and yellow low energy.
Animation 3. Increased amplitude
When the amplitude of the initial roughness is more pronounced smaller wavelength roughness will also develop the ATG-instability. Color-scale represents elastic energy where blue is high and yellow low energy.
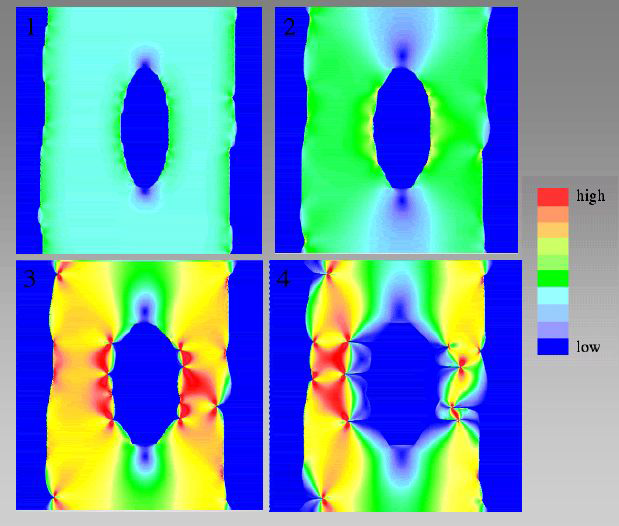
In order to illustrate the growth of anti-cracks we use a setup where we stress a crystal with a central elliptical hole vertically (Figure 7). The crystal can dissolve from right and left hand sides and from the initial hole. We apply a strain rate on the crystal where the deformation takes place in small steps of 0.06 percent strain per 10000 years. For the simulations we use a lattice of 400 times 461 particles with particle boundaries. The fluid pressure is zero. The two simulations (animation 4 and animation 5) vary in absolute size. In animation 4 the crystal has a height of 4 mm and in animation 5 a height of 0.8 mm. Colors in the movies represent differential stresses where blue is zero and red high differential stress (0-90 MPa).
Animation 4. Stressed crystal with a central elliptical hole
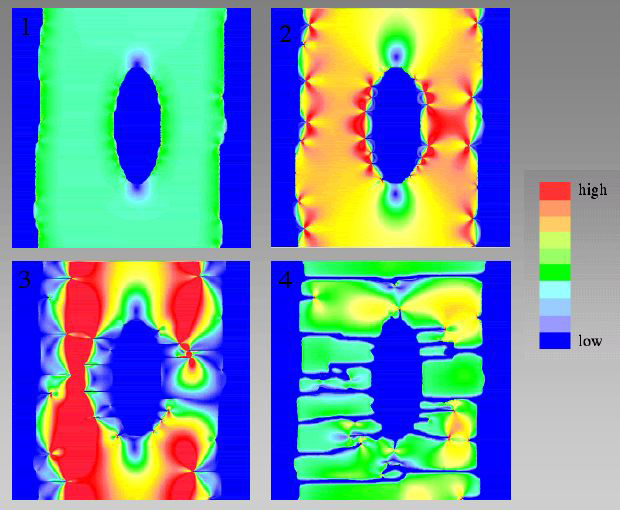
Movie shows a stressed crystal with a central elliptical hole that is in contact with fluid on its right and left hand side and around the hole. A strain-rate is applied on the crystal (see text for details). Dissolution localizes and anti-cracks run into the crystal.
In animation 4 the surface energy is smaller than in animation 5 since the system is larger. However the surface energy is high enough to smoothen irregularities on the crystal surface at the beginning of the simulation. When the crystal is strained differential stresses are high at the right and left hand side of the hole and low at the top and bottom. When the crystal is strained enough that the main stress color changes to yellow small red stress concentrations can be seen at irregularities on the surface of the crystal. Elastic energy is now high enough to initiate the ATG-instability. Dissolution localizes, cusp instabilities develop and grow into anti-cracks that propagate into the crystal from its left and right hand side and from the left and right hand side of the hole. The wavelength of the structures is strongly influenced by initial irregularities on the crystal surface. At first all these irregularities develop into anti-crack structures. However at the left hand side of the hole some of the anti-cracks dominate their neighbors. This phenomenon is similar to a period doubling instability and has been also observed in numerical simulations of Kassner et al. (2001) who use a phase-field approach to model fluid-melt systems.
The period doubling produces a coarsening of the pattern [Koehn et al. 2003, 2004] since the wavelength of the roughness grows. Sudden changes of the stress field indicate additional loading steps while anti-cracks are propagating. Additional loading leads to an increase in localization of dissolution until anti-cracks from the hole in the crystal and the sides meet and merge. The effect that the crystal is not collapsing at this point is due to the deformation estimates that are taken during the straining steps and because no gravity is present in the simulations. Parts of the crystal that are now completely surrounded by fluid behave like single grains but can still be strained by minor amounts due to the deformation estimates so that anti-cracks can still grow. This can be seen as a three-dimensional effect so that the crystal has still a cohesion in the third dimension. Anti-cracks that propagate towards each other and are not merging by coincidence first run past each other for a short distance and then stop (Figure 9). Afterwards a small anti-crack grows from the wall of a neighboring anti-crack towards the neighbor's tip parallel to the main compressive stress direction on the crystal. Figure 9 illustrates that this unusual behavior is caused by a small stress bridge that develops from a neighbor's tip towards the anti-crack's wall. In the end the localization of dissolution produces a pattern with a distinct spacing of mostly horizontal and some minor vertical anti-cracks. Surface energies are again dominating and result in smooth edges.
Figure 9. Two merging anti-cracks
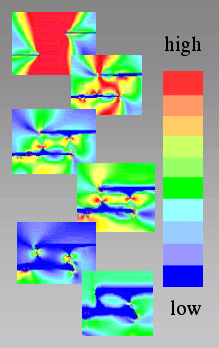
Figure shows the progressive sequence of two merging anti-cracks in animation 4. First the anti-cracks run past each other for a short distance that is about the same as the distance between them. Then they stop and small anti-cracks grow from anti-crack walls towards tips of neighbors. This results in rhomb-shape structures with horizontal and vertical anti-cracks.
In animation 5, surface energy is more dominant than in animation 4 since the system is smaller. The crystal dissolves from its sides and the hole for a while without producing a pronounced roughness and no real localization of dissolution. Flat cusp instabilities develop around the hole with a small amplitude. At a certain amount of strain the elastic energy is (similar to animation 4) high enough to overcome the surface energy and dissolution localizes. This transition is almost instantaneous, as long as surface energies are dominant the crystal surface almost remains a stable structure but as soon as a critical elastic energy is reached the surface becomes unstable and dissolution localizes. The system shows a period doubling instability right at the point when dissolution localizes similar to the instability seen in animation 4. Only three of the four initial cusps on each side of the hole develop into anti-cracks. The propagation of anti-cracks is similar to the behavior in animation 4 except for the spacing of the structures in the end. Animation 5 shows less anti-cracks und thus a wider spacing than animation 4. A larger wavelength of structures is expected since the system is smaller in animation 5.
Animation 5. Smaller system
>Movie shows the same setup as Animation 4, but the system is smaller. Therefore surface energies are more important initially than in Animation 4, small flat cusps develop and the crystal dissolves slowly. Towards the end of the movie the ATG-instability is suddenly initiated and dissolution localizes.
Animation 6 and 7 show the interaction of anti-crack propagation and mode I fracturing. In these simulations a crystal with a small hole in the center is stressed vertically. The upper and lower side are confined by elastic walls whereas the right and left hand side are unconfined. The crystal is represented by 600 times 600 particles, colors in the animations represent differential stresses with the scale-bar shown on the left hand side in the movies (red is high and blue low differential stress). The crystal is strained once at the beginning of the simulations. While the anti-crack grows it produces tensile stresses at its upper and lower sides. These tensile stresses result in the propagation of mode I fractures from the anti-crack walls. In the beginning of anti-crack and crack growth in animation 6 the length of mode I fractures is proportional to the length of the anti-crack. The longest fractures are the oldest in the center of the propagating anti-crack and fractures grow sub-critically with the anti-crack. After a while mode I cracks show a period doubling instability in animation 6, only every second mode I fracture continues to grow. This instability is very similar to the period doubling instability of growing anti-cracks that was discussed in the last section.
If tensile stresses are not large enough for all fractures to continue growing the system goes through a period doubling instability so that only half of the fractures continue to grow. The instability is induced by stress-shielding effects of neighboring fractures. Only slight perturbations in the system are enough to induce this period doubling which results in a coarsening of the growing fracture pattern. Once the anti-crack has reached a critical length mode I fractures in the center stop to grow. However, while the anti-crack propagates towards the sides of the crystal a new cluster of mode I cracks grows on the left and right hand side of the initial cluster in the center. These new two clusters have larger mode I cracks in their center than the initial cluster in the center of the crystal. This is probably due to higher tensile stresses next to the boundaries of the crystal since the boundaries are not confined.
Animation 6. Propagation of an anti-crack
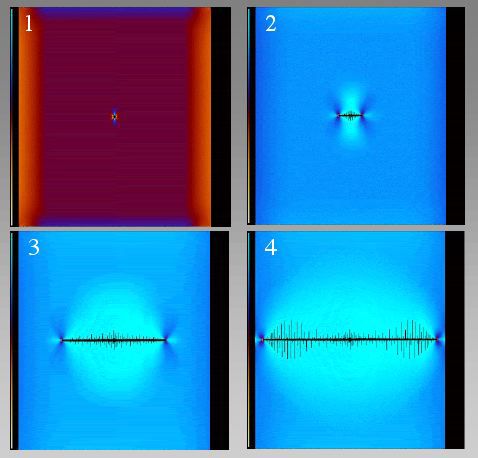
Movie shows the propagation of an anti-crack from an initial small hole and the development of mode I fractures along the anti-crack walls. Crystal is stressed vertically (with respect to the figure if it stands upright). Colors represent differential stresses with the scale bar shown on the left hand side in the movies (red is high and blue low differential stress.
Animation 7 shows a similar simulation with a higher breaking strength of springs, which results in a wider spacing and smaller length of mode I fractures. The wavelength of the fracture clusters does not seem to be influenced by the breaking strength of springs, the wavelength is the same for animation 6 and 7. Once the anti-crack reaches the sides of the crystal mode II shear fractures develop and the crystal fails.
Animation 7. Increased breaking strength
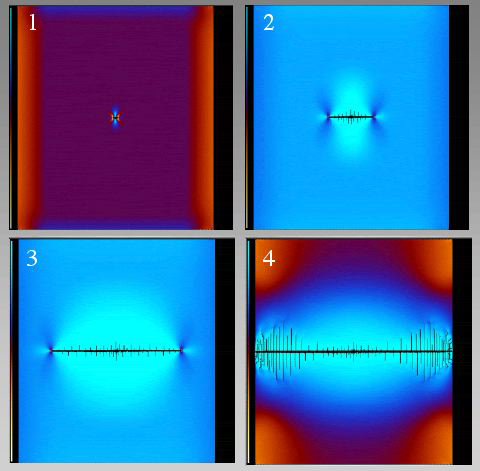
Movie has the same setup as Animation 6 but the breaking strength of the crystal is higher. This results in less mode I fractures. When the anti-crack moves towards the walls of the crystal it induces failure. Colors represent differential stresses with the scale bar shown on the left hand side in the movies (red is high and blue low differential stress).