Geological setting - Structural evolution
The Mesohellenic Trough (MHT)
Lithostratigraphy
The Mesohellenic Trough (MHT) is located in north-western Greece and Albania, and has a length of more than 200 km and a width of 30-40km (Figure 1). The basin developed from Mid-Late Eocene to Mid-Late Miocene time, related to the Alpine orogenic processes, and is sited parallel to the structural fabric of the Hellenides (i.e. NNW-SSE), between the Apulian plate (External Hellenides, non-metamorphic) and the Pelagonian nappe pile (Internal Hellenides, metamorphic).
The basin comprises five molassic-type formations (Figure 2; Brunn 1956), overlying the Neo-Tethyan ophiolitic rocks and the transgressive Upper Cretaceous limestones or the western Pelago¬nian margin. Upper Miocene to Quaternary deposits overlie unconformably the molassic-type formations, which, from bottom to top, are (Figure2): 1) Krania Formation of Middle-Upper
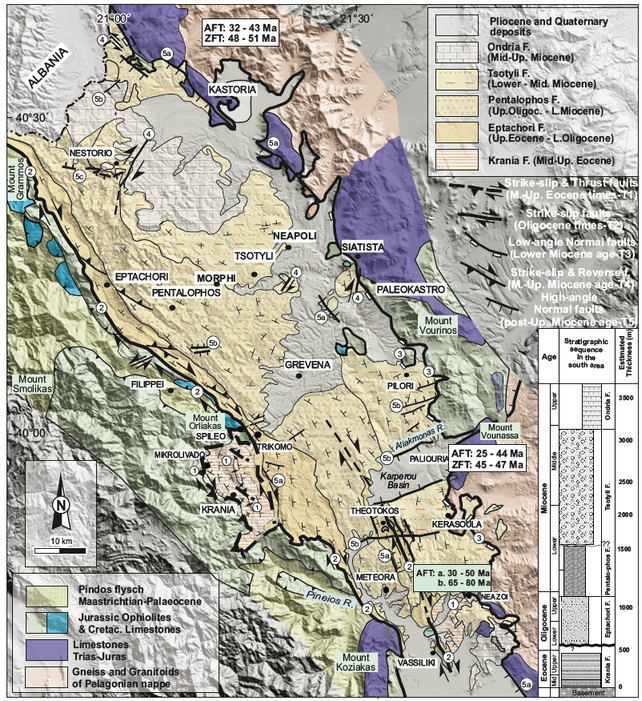
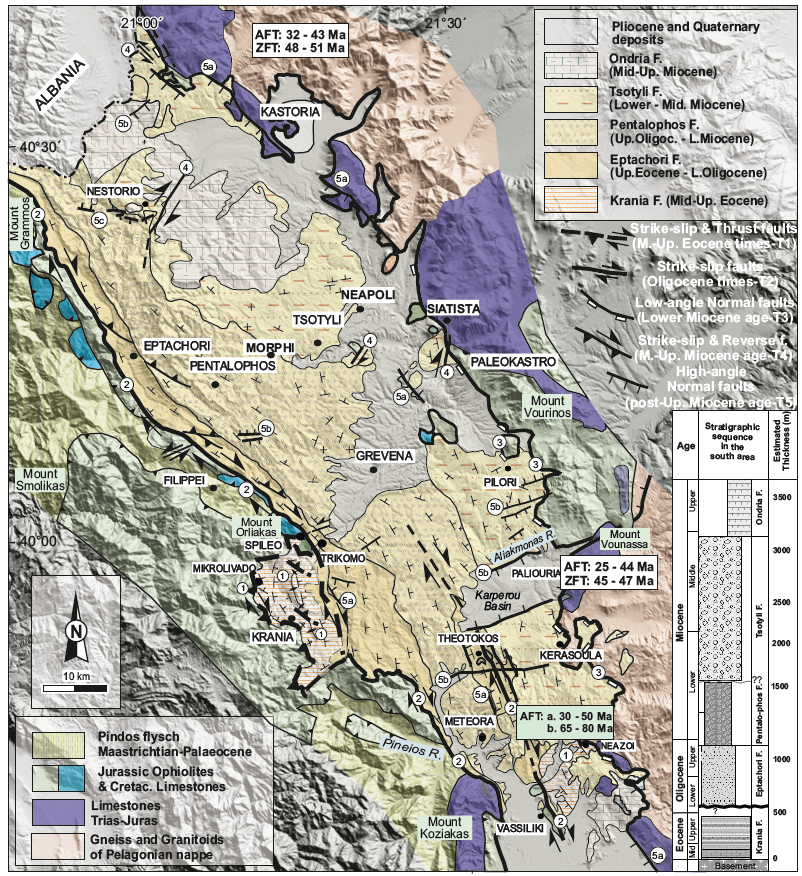
Figure 2. Geological-structural map of the MHT
Geological-structural map of the MHT (modified after Brunn 1956; Doutsos et al. 1994; Zelilidis et al. 2002; Vamvaka et al. 2006). Numbers in circles (1) indicate the timing (T1) and the locations of the tectonic events where these are recognized and was estimated the corresponding stress tensor (Figures 6,7,8,9). AFT and ZFT ages from the Pelagonian basement and the MHT sediments are shown in boxes (Vamvaka et al. 2010). Insert: Lithostratigraphic column of the MHT.
Eocene age and a thickness of 1500 m (Brunn 1956; Wilson 1993; Zelilidis et al. 2002; Ferrière et al. 2004). 2) Eptachori Formationof Uppermost Eocene-Lower Oligocene age and a thickness of about 1000-1200m(Brunn, 1956; Zelilidis et al. 2002). 3) Pentalophos Formationof Upper Oligo¬cene-Lower Miocene age, which attains a cumulative thickness of around 2500 m (Brunn 1956; Doutsos et al. 1994; Zelilidis et al. 2002; Ferrière et al. 2004), while in the central part of the formation it is estimated to reach a maximum thickness of 4000m (Zelilidis et al. 2002). 4) Tsotyli Formation of Lower-Middle Miocene age and a thickness of about 1500 m (Brunn 1956; Zelilidis et al.2002), and 5) Ondria Formation of Middle Miocene age (Burdigalian-Langhian), which remains only in a few places of the MHT with a thickness of about 350 m. With the exception of the Krania Formation in the westernmost and the southeastern parts of the MHT, the other four formations were deposited parallel to one another from west to east, respectively (Figure2), with an overall eastward migration of the depocenters and subsidence (Brunn 1956; Zygogiannis and Müller 1982). Accor¬dingly, the Tsotyli formation directly restson top of the Pelagonian continent along the eastern margin of the trough. At the western edge of the basin, the strata dip towards the ENE at steep angles; dips decrease progressively away from this basin margin, whereas along the eastern margin of the basin the strata dip with a low angle towards the WSW. As a result an asymme¬trical syncline is formed in the Northern part of the basin,controlled by structural and depositional processes (Figure2). In the south the MHT splits into two narrower synclines separated by an uplifted structure (Figures2, 3; Theotokos-Vassiliki villages’ areas; Doutsos et al. 1994). Furthermore, all formations, except the Eocene Krania Formation, be¬come coarser towards the southern part characterized by extensive fan delta deposits (Zelilidis et al. 2002).
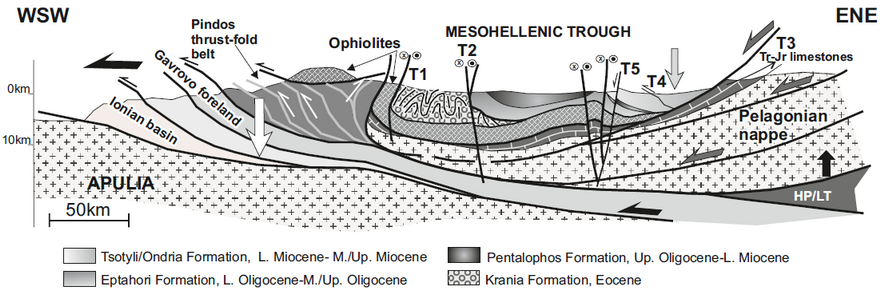
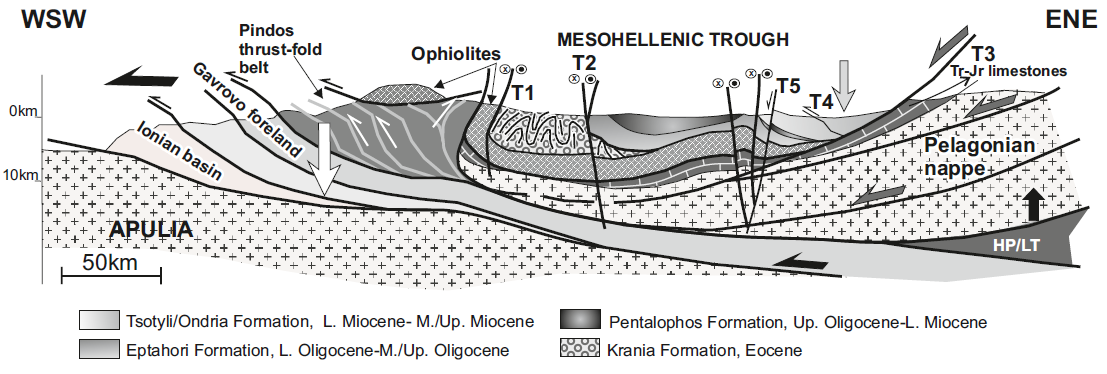
Figure 3. Schematic cross section through the MHT
Schematic cross section through the MHT showing the successive deformational stages related to the basinevolution (Vamvaka et al. 2006).
Structural evolution
Numerous structural data, accrued from observations on geometry of kinematics, overprinted criteria, stratigraphic relationships and correlation between various structures, show that the basin experienced a complicated history with different tectonic episodes (T1 to T5; Figures2, 3, 4; Vamvaka et al. 2006, 2010). These events took place in semi-ductile to brittle conditions from Middle Eocene to Quaternary time. For the paleostress tensor calculation for each tectonic event the direct stress inversion method of Angelier (1970, 1990) was considered. The solution is satisfyingly acceptable, if more than 80% of the fault-slip data from a site show a misfit angle less than 300 between the theoretical and real slip vector. The program MyFault-Version 1.03 (Pangaea Software Scientific, 2007) was used for the graphical presentation of the tectonic data.
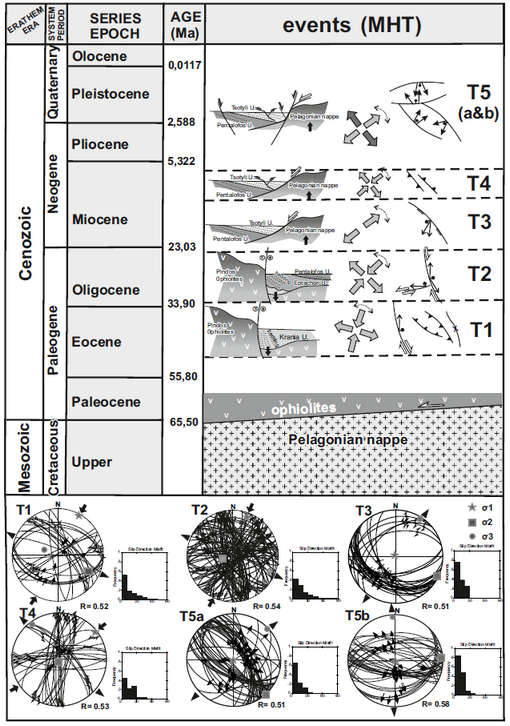
Figure 4. Features and kinematics of the main deformational events
Distinctive features and kinematics of the main deformational events (T1 to T5) related to the MHT evolutionary history. Paleostress analysis diagrams (σ1>σ2>σ3) for each tectonic event are shown (equal area, lower hemisphere). Fluctuation histograms of deviation angles (angle between the calculated slip vector and the measured slickenline) and stress ratio R= σ2-σ3/σ1-σ3 are also indicated.
The first stage (T1) of the basin’s development, during the Middle-Late Eocene, was contempo¬ra¬neous with the final emplacement of Pindos ophiollites on the External Hellenides and culminated in deformation and uplift of the Eocene strata. The Eocene sub-basins developed by crustal flexure and subsidence due to loading of the overthickened Hellenides accretionary prism. Basin evolution was associated with transpressio¬nal re¬gi¬¬-me and dextral NNW-SSE trending strike-slip faults with a reverse, towards NE, dip-slip component. Reverse faults and asymmetrical folds, with a main NE-ward vergence, are developed within the Eocene Krania deposits.During the ensuing followed basin closure and uplift at the end of Eocene, the sediments of the first sub-basins were deformed and placed with a high angle at the western basin margin, locally con¬cordant with the adjacent ophiolitic rocks (Figures 2, 3, 4, 5a). The paleostress analysis shows an almost horizontal maximum principal σ1-stress axis NE-SW trending and an almost vertical minimum principal σ3- stress axis (Figures 4, 6).
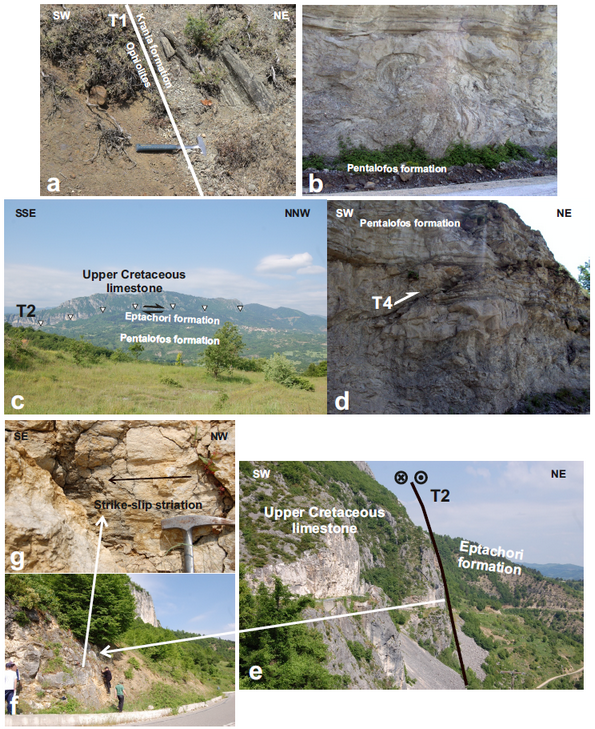
Figure 5. Fiedl photographs from MHT
a. The tectonic contact (T1) between ophiolites and Kranea formation west of the Kranea village. b. Mass flows in the Pentalofos formation, road from Neapoli to Eptachori villages,near the Morphi village. c. Looking west, the marginal strike-slip fault (T2) between the Upper Cretaceous limestone of the Orliakas Mountain and the Eptachori formation. d. Thrust fault (T4) in the Pentalofos formation, road Neapoli to Eptachori villages, near the Morphi village. e,g,f. The dextral strike-slip fault (T2) between the Upper Cretaceous limestone of the Orliakas mountain and the Eptachori Formation (e,g) with nearly horizontal striation on its fault plane (f), road to the Spilaionvillage on top of the Orliakas mountain.
The second phase (T2) was dominated by strike-slip faults. Dextral strike-slip faults of NW-SE to NNW-SSE orientation controlled the subsidence and evolution of the basin from Early to Late Oligocene. They define the western boundary of the MHT between basement rocks and the Eptachori Formation (Figures 2, 3, 4, 5c,e,f,g). Sinistral strike-slip fault zones along the western boundaries of the MHT are interpreted as riedl-structures. Strike-slip faults, positive flower structures and rare compressional structures (Figures 3, 4) have been developed under a transpressional tectonic regime. It is characterized by a decrease in intensity towards the East and a small shift of the, low angle plunging, maximum principal stress axis (σ1) from NE-SW to NNE-SSW, showing a small change in direction compared with the first T1 event. NW-SE to WNW-ESE trend shows respectively the minimum stress axis (σ3) with a low also plunge, towards ESE or WNW (Figures 4, 7).
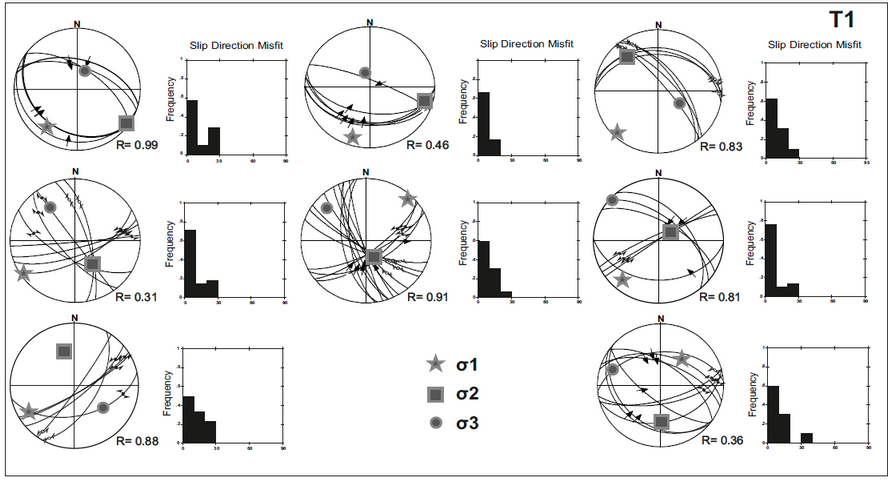
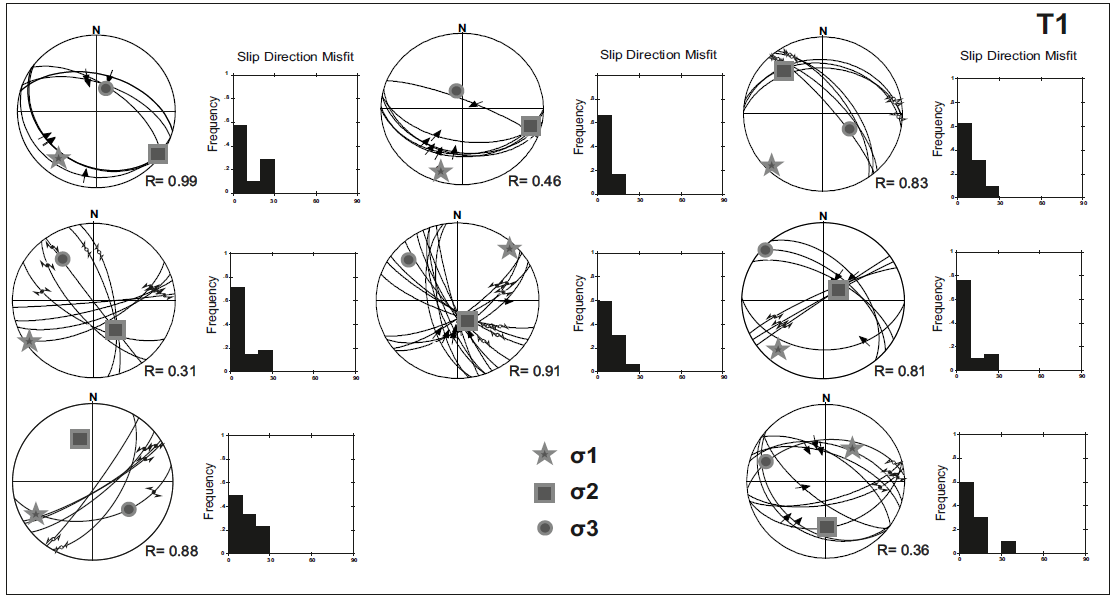
Figure 6. Paleostress analysis for the T1
Paleostress analysis diagrams (σ1>σ2>σ3) forthe T1 event, affected only the Krania Formation (equal area, lower hemisphere). Fluctuation histograms of deviation angles (angle between the calculated slip vector and the measured slickenline) and stress ratio R= σ2-σ3/σ1-σ3 are also shown. Locations in Figure 2.
The third phase (T3) was characterized by low-angle normal faulting along the eastern boundary of MHT during the Early-Middle Miocene, causing the subsidence at that part of the trough (Figures 2, 3, 4). T3 was associated with the Oligocene-Miocene syn- to late orogenic collapse and detachment of the Pelagonian nappes (Kilias et al. 1991a,b; Sfeikos et al. 1991). The evolution of the sedimentary basin ended around Middle-Upper Miocene, followed later by rapid uplift and marine regression. The minimum σ3-stress axis was computed almost horizontal with a NE-SW orientation, whereas the maximum σ1-stress axis are nearly vertical, indicating the extensional stress regime during T3 event (Figures4, 8a).
A compressional event occurred during the Late Miocene times of relatively local importance, related to oblique reverse faults with a main, towards NE sense of movement, as well as strike-slip faults (T4; Figures 2, 4, 5d). T4 faults cut all the MHT molassic formations but not the younger postmolassic, Pliocene deposits of the basin. The paleostress analysis suggested that the stress regime during T4 event was characterized by a subhorizontal NE-SW oriented maximum σ1-stress axis and a subvertical minimum σ3-stress axis (Figures 4, 8b).
Figure 7. Paleostress analysis for the T2

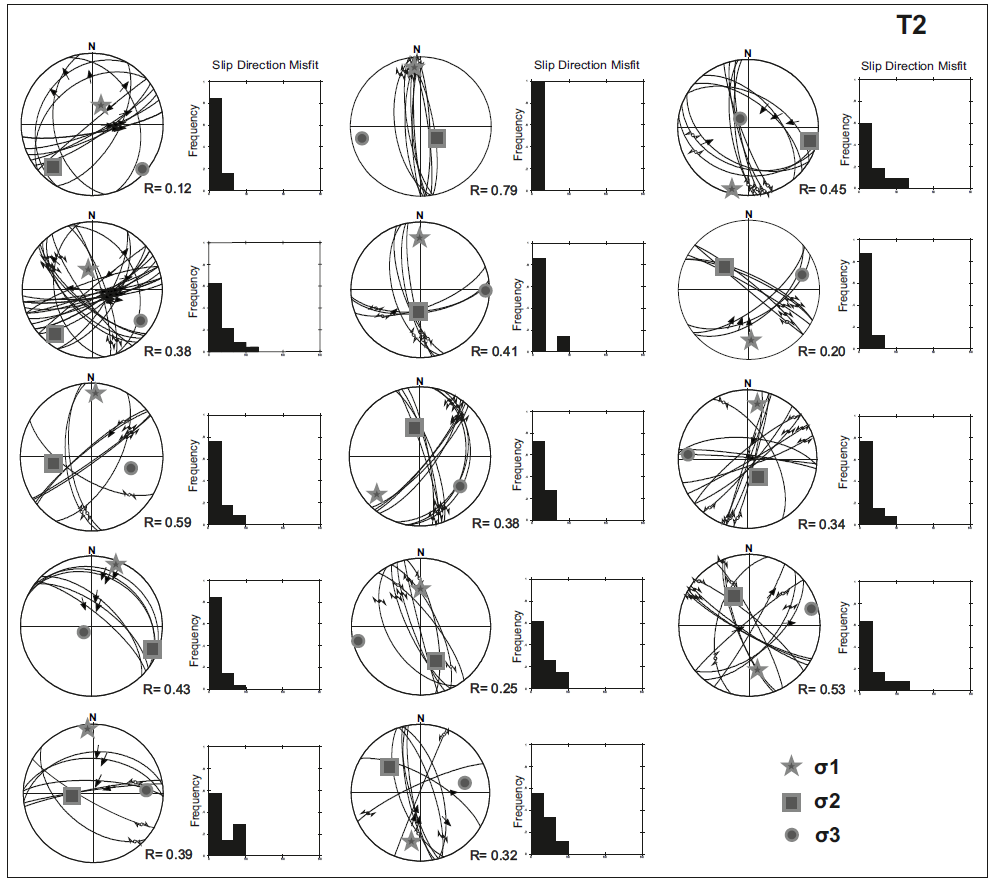
Paleostress analysis diagrams (σ1>σ2>σ3) for the T2 event (equal area, lower hemisphere). Fluctuation histograms of deviation angles (angle between the calculated slip vector and the measured slickenline) and stress ratio R= σ2-σ3/σ1-σ3 are also shown. Locations in Figure 2.
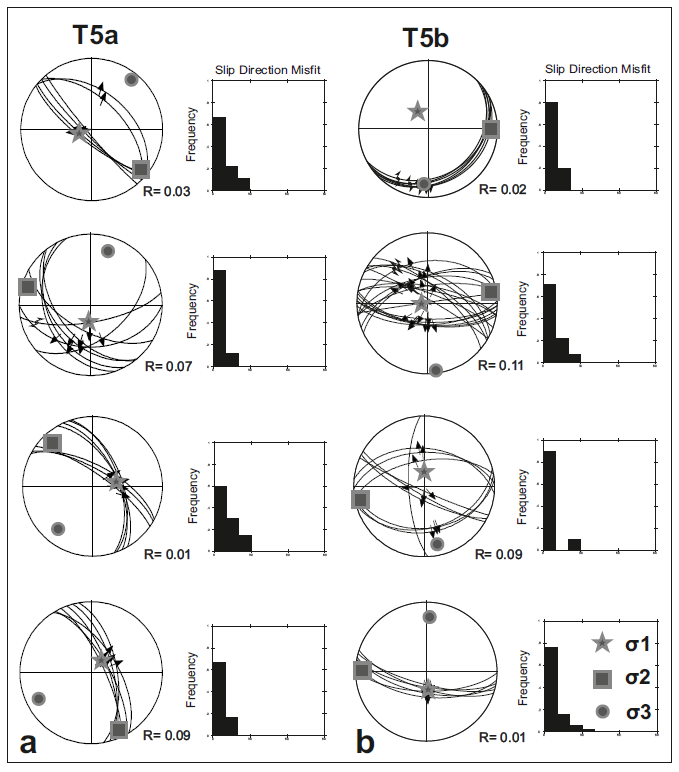
Finally, extensional tectonics affected the whole area from Late Miocene to present-day related to high angle normal faults (Figures 2, 4; T5a), some of which are reworked as great active faults (Figures 2, 4; T5b). The paleostress analysis indicates the minimum σ3-stress axis oriented subhorizontally from NE-SW (Figure 9a; T5a) to N-S (Figure 9b; T5b). The last measurement develops as a relative younger orientation coinciding well with the extension direction of the recent seismic activity (Papazachos et al. 1998; Mountrakis et al. 1998). In both cases of T5a and T5b faults, the maximum σ1-stress axis remains almost vertical (Figure 9).
Figure 8. Paleostress analysis for the T3 and T4
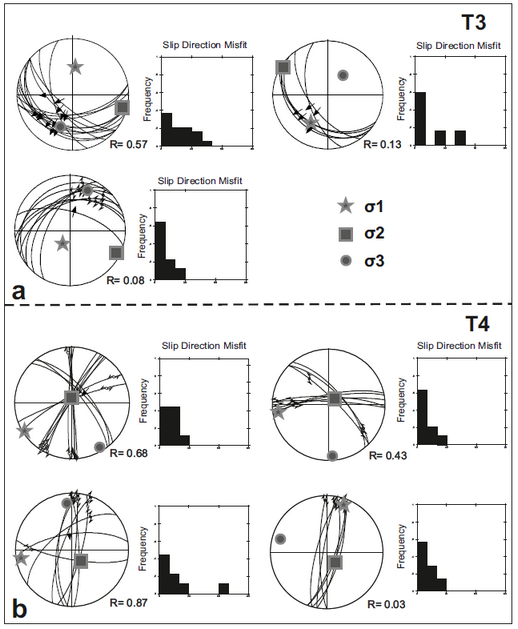
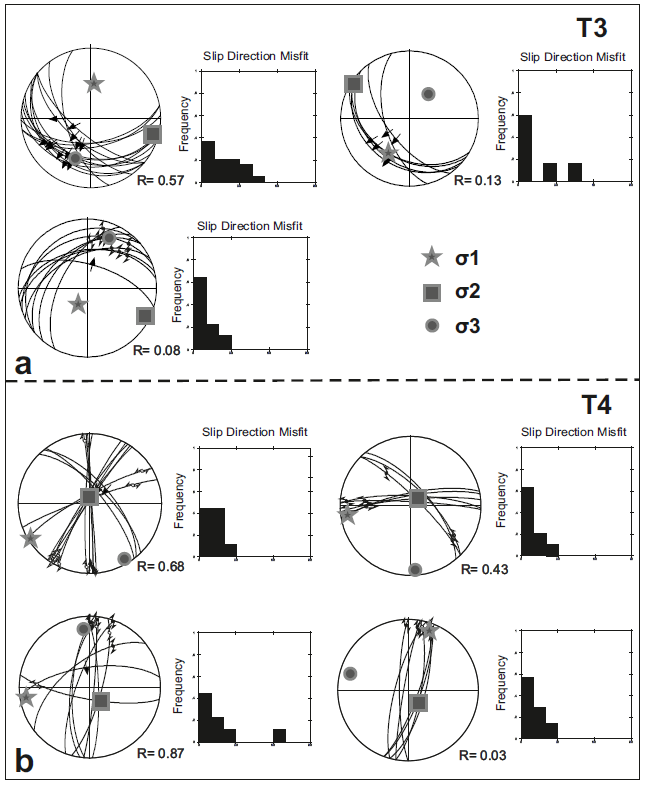
Paleostress analysis diagrams (σ1>σ2>σ3) for the T3 (a) and T4 (b) events (equal area, lower hemisphere). Fluctuation histograms of deviation angles (angle between the calculated slip vector and the measured slickenline) and stress ratio R= σ2-σ3/σ1-σ3 are also shown. Locations in Figure 2.
Furthermore, the conclusions of apatite fission track (AFT), as well as zircon fission tracks (ZFT) analyses, that were performed by Vamvaka et al. (2010) on the detrital material in the MHT sedimentary strata and their bordering Pelagonian basement rocks(Figure 2), towards the comprehension of the MHT development, confirm the Pelagonian continent as the main source of the detrital material and meet well with the conclusions from the structural analysis. No correlation with FT ages of the western bordering basement rocks (mainly ophiolites) was available due to inappropriate lithology. Heating of the we¬stern margin of the Pelagonian continent adjacent to the MHT, during Lower-Middle Eocene, was associa¬ted to thrusting, and directly followed by fast cooling and exhumation in Middle-Upper Eocene. The slower cooling and exhumation in the continuing during Oligoceneis associated to the strike-slip faults (T2) which cause localized uplift and subsidence (in the area of MHT), while less verti¬cal movements are produced in other places (e.g., the Pelagonian continent). The Miocene extensio¬nal period (T3) is also shown from thermal modelling of track length distribution, which indi¬cates a prolonged stay in the same temperature range (or reheating) around25 to 10 Ma. This can be caused by crustal thinning and rise of the geothermal gradient, started already since Oligo¬ce¬ne-Miocene time, accompanying an exten¬sional period. In the latter thermal model, an enhanced uplift is also predicted during the last 10 Ma, which is consistent with the filling of the basin with sediments and the uplift of the area.
Figure 9. Paleostress analysis for the T5
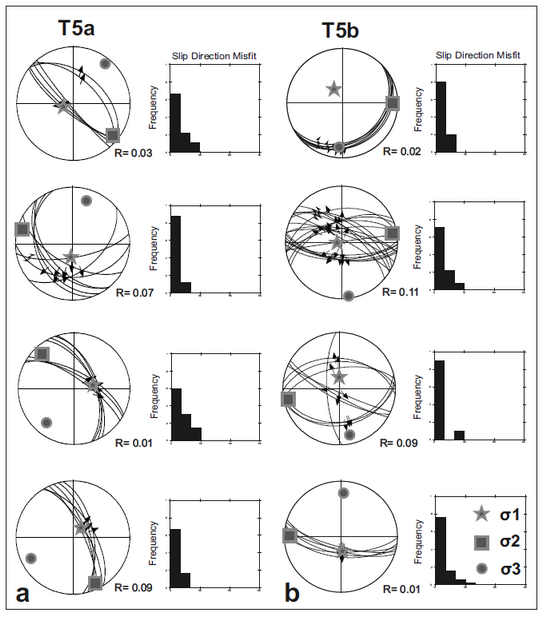
Paleostress analysis diagrams (σ1>σ2>σ3) for the T5 event (equal area, lower hemisphere). Fluctuation histograms of deviation angles (angle between the calculated slip vector and the measured slickenline) and stress ratio R= σ2-σ3/σ1-σ3 are also shown. Locations in Figure2.
Geodynamically, the MHT evolved as a piggyback basin in a foreland setting above westward-emplacing ophiolites and higher Pelagonian units (Figures2, 3; Wilson 1993, Doutsos et al. 1994, Ferrière et al. 2004; Vamvaka et al. 2006), while great importance is given to the role of strike-slip faults in the structural evolution of the MHT (Vamvaka et al. 2006, 2010). Successive stages and changing tectonic regimes recognised in the MHT formation are met in strike-slip basins, while experiencing alternating periods of extension and compression. The changing structural settings and repeated episodes of rapid subsidence and uplift, variable depths along the axis of the basin, asymmetry and big length-to-width ratios (4:1), axial infill subparallel to the principal displa¬ce¬ment zones, abrupt lateral and vertical facies variations, and of course the presence of strike-slip faults, as certainly observed to bound the western side of the MHT, are some indicative features of the MHT, which constitute typical criteria for the recognition of long-lived strike-slip zones and related basins. As the trough developed due to different tectonic events reported earlier, it corresponds to the pattern of polyhistory strike-slip basins (classification after Busby and Ingersoll, 1995).
In conclusion, our interpretation for the evolution of MHT suggests successive tectonic events, in response to which MHT developed, involving isostatic crustal flexure, strike-slipfaults, associated with reverse dip slip component, and normal faulting(Figure3).
The Thrace Basin (THB)
Lithostratigraphy
The Thrace Basin, one of the largest Tertiary basins in the North Aegean region, is formed on the metamorphic rocks of the Rhodope massif in Northern Greece and Southern Bulgaria (Kopp 1965; Lescuyer et al. 2003; Burchfiel et al. 2003;Marchev et al. 2005; Bonev et al. 2006; Maravelis et al. 2007; Tranos 2009; Kilias et al. 2006, 2013), as well as the Strandja and Sakarya massifs in NW Turkey, where the depocentral area of the basin is evolved (Figures 1, 10; Turgut et al. 1991; Turgut and Eseller 2000; Siyako and Huvaz 2007; Okay et al.2010;Cavazza et al. 2012). Tertiary basins (Figure 1; Axios basin, AXB) are also referred to the Eastern Former Yugoslavian Republic of Macedonia (FYROM) by Dumurdzanov et al. (2005).
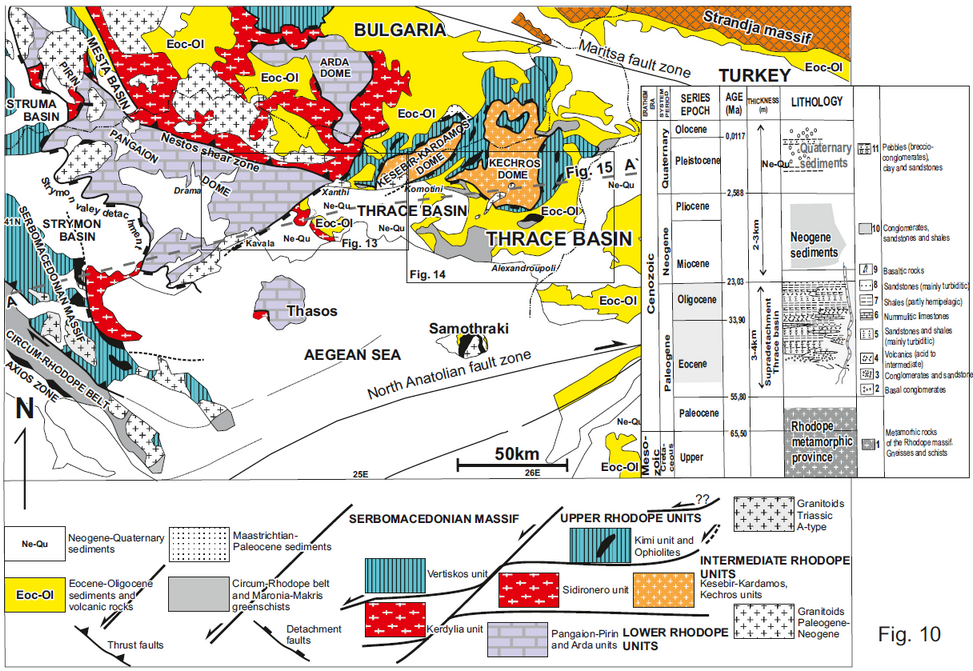
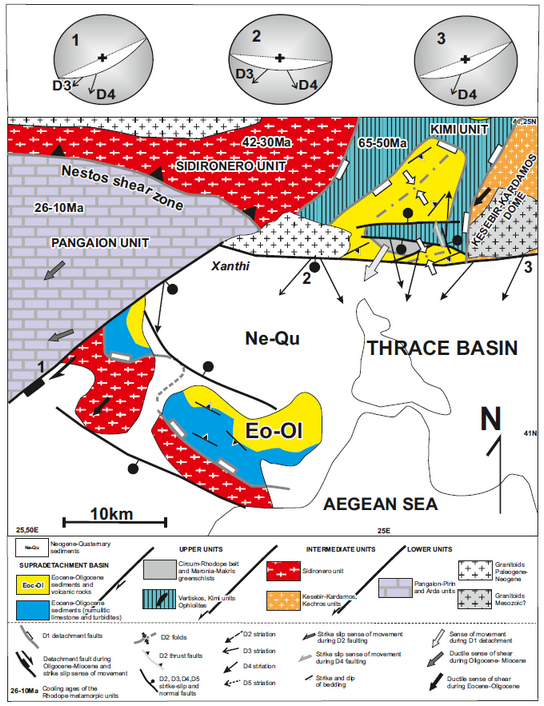
Figure 10. Geological-structural map of the THB
Geological-structural map of the THB and the main structural units of the Rhodope metamorphic province and adjacent areas. Modified after Bonev et al. (2006), Burg (2012), Kilias et al. (2013). Insert: Stratigraphic column of the Thrace basin. Compiled after data in Christodoulou (1958), Kopp (1965), Lescuyer et al. (2003), Burchfiel et al. (2003).
Our data are focused on the part of the Thrace basin in the Greek mainland covering the Rhodope metamorphic province. Here the deposits of the THB consistof molassic-type sedimentary rocks of Paleogene age overlain unconformably by a thick (1-2 km) Neogene-Quaternary sedimentary sequence (Figures1,10; Christodoulou 1958; Kopp 1965; Mainhold and Bon Dagher 2010).More than 90% of the total surface of the THB is covered by younger Neogene to Quaternary sediments and the Aegean Sea. About 10% of the Paleogene exposed outcrops of the basin is extended in the NE Greek mainland, from the Pangaion mountainous range until the Greek -Turkey borders, and the North Aegean islands of Limnos and Samothraki (Figures1, 10).
Some small outcrops of Paleogene sediments along the Axios Basin beneath Neogene-Quaternary sediments (Figure1; Dumurdzanov et al. 2005) were regarded as equivalent infilling products to the Paleogene THΒ sedimentary rocks. The molassic sediments of the THΒ, as well as their equivalent of the Axios Basin show an age from Middle-Upper Eocene to Oligocene (Christodoulou 1958; Dragomanov et al. 1986; Roussos 1994; Mainhold and Bon Dagher 2010). They constitute a complicated stratigraphic sequence composed by intercalation of bedded conglomerates, breccias, conglomerates, sandstones, nummulitic limestones, turbiditic layers and shales (Figure10).
Sedimentation started during Bartonian time with initial deposition of continental sediments (mainly breccias, conglomerates and sandstones; Figure 11e), followed during the Late Eocene-Oligocene by marine turbiditic type deposits and limestones (Figure 11d). The sediments of the THB lie in places on the basement rocks of the Rhodope massif and in other places on the low-grade metamorphic Permo-Triassic, volcano sedimentary Maronia-Nea Makri series (Figures10, 11a,b,c; Bonev et al. 2006; Burg 2012; Kilias et al. 2013;).The total thickness of the Paleogene sedimentary sequence is estimated to 2-3 km (Christodoulou 1958; Kopp 1965; Burchfiel et al. 2003), although in the Turkish part of the broader Thrace Basin, where its depocenters are developed, a thickness of about 9 km is reported (Goeruer and Okay 1996). Moreover, Roussos (1994) refers that also in some parts of the Greek ThB, which are covered by the Neogene-Quaternary sediments or the Aegean Sea, the sedimentary deposition can reach a thickness of ca. 9 km.
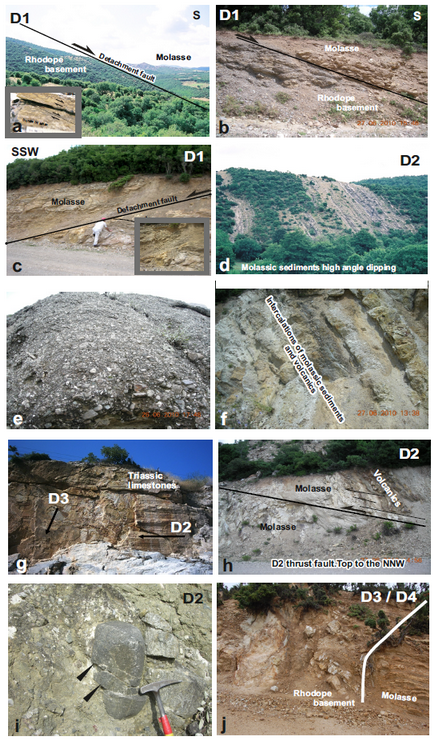
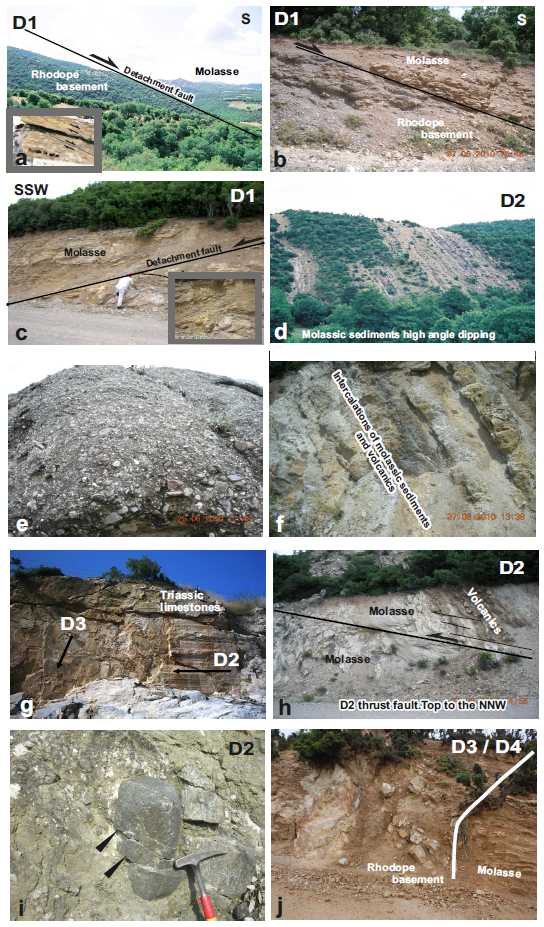
Figure 11. Field photographs from THB
a, b, c. The low angle normal fault zone (D1) between the Rhodope basements rocks and THB sediments, north of Darmeni village. Shear bands in the footwall basements rocks (b, c) indicate a top to SSW sense of shear. d. High angle dipping mollasic sediments (D2), at the contact near the Paterma village. e. Basal conglomerates of the THB, Paterma village. f. Intercalations of the sediments and acid to intermediate volcanic products, road Nea Santa village to Kechros village, north of the Nea Santa village. g. D2 and D3 striations on the fault plane of N-S striking fault in the Triassic marble of the Maronia-N. Makri Series, old road Komotini to Alexandroupoli cities. h. Contractional structuresduring the D2 kinematics in intercalations of THB sediments and volcanics, north of Darmeni village. i. Reverse faults during the D2 event, cutting pebbles components of aconglomeratic horizon in between the THB deposits, road to Drosia. j. D3 high angle fault between basement rocks and the THB sediments. On its fault plane were recognized two striation generations, the older is compatible to the D3 kinematics and the younger one to the D4. Location (2) inFigure 13.
The molassic-type sediments of both Thrace and Axios Basins, are intercalated by a lot of calc-alcaline and partly shoshonitic-type, acid to intermediate volcanic products of the same age, Upper Eocene to Oligocene (Christofides et al. 2004; Dumurtzanov et al. 2005; Figures11f, 12,13,14).Magmatic activity was further related to gold-mineralization of great economic importance (Lescuyer et al. 2003).
Structural evolution
Detail structural analysis and geological mapping, as well as study of the kinematics of deformation of the sedimentary-volcanic sequence of the THB and its boundaries with the basement rocks of the Rhodope massif and Maronia-Nea Makri series, show a complicated structural evolution of the basin. It can be recorded in five progressive tectonic events (D1 to D5) from Eocene to Quaternary time (Figure12). Subhorizontal extension dominates during the overall deformational history (Kilias et al.2013).The direct stress inversion method of Angelier (1979, 1990) was also used here for the calculation of the paleostress field for each tectonic event.
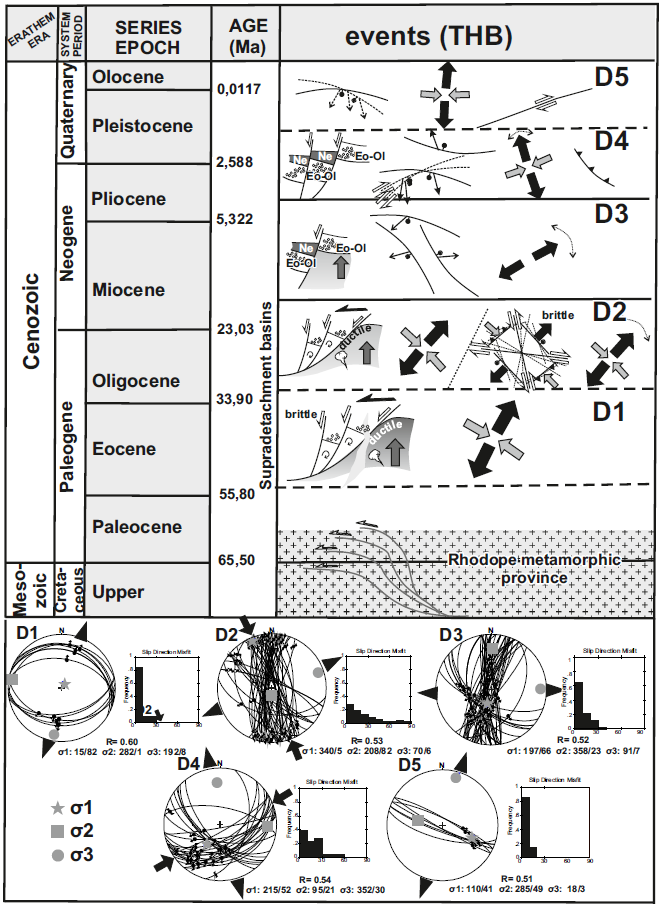
Figure 12. Features and kinematics of the main deformational events (D1 to D5) related to the THB

Distinctive features and kinematics of the main deformational events (D1 to D5) related to the THB evolutionary history. Paleostress analysis diagrams (σ1>σ2>σ3) for each tectonic event are shown (equal area, lower hemisphere). Fluctuation histograms of deviation angles (angle between the calculated slip vector and the measured slickenline) and stress ratio R= σ2-σ3/σ1-σ3 are also indicated (Kilias et al. 2013).
D1 is characterized by low angle normal detachment faults, recognized at the tectonic boundaries of the Paleogene basin formation with the basement rocks, where no reworking took place due to younger tectonic events(Figures 11a,b,c, 12, 13, 14). D1 detachment faults strike E-W to NW-SE with a main S-SW-ward dip direction. Some deviations of these ratesare observed at different parts of the basin (Figures 13, 14). Top to SW to SSW sense of shear dominates along the D1 fault planes (Figures 11a,b,c) but in some places an opposite top to the NE-NNW sense of movement is also recognized related to D1 fault planes dipping to N-NE (Figure 13, 14). The paleostress analysis indicated NE-SW to NNE-SSW trending subhorizontal minimum σ3- and subvertical maximum σ1-axes of the stress tensor (Figures 12).
D2 evolved during Oligocene-Miocene time and is related to the further reconstruction of the Thrace Basin. D2 is characterized by transpressional tectonics and formation of large conjugate strike-slip faults and extensional fractures, as well as thrust faults and folds with N-NW or S-SE sense of movement (Figures 11g,i,h, 12, 13, 14). D2-extension remains again NE-SW oriented ca. parallel to the D1-extension, while compressional component of deformation is developed parallel to the Y-axis of the strain ellipsoid. During D2, the minimum principal σ3-stress axis is developed subhorizontal with a NE-SW to ENE-WSW trend, slightly deviated from those of the D1 event, and the maximum principal σ1-axis subhorizontal with a NW-SE trend, respectively (Figure 12).
D3 is responsible for high-angle normal faults dismembering the Eocene-Oligocene molassic basin into Neogene grabens (Figures 11g,i, 12, 13, 14). Some D2 strike-slip faults are reactivated during D3 event, as it is clearly concluded by the existence on their fault planes of oblique, to the strike-slip movements, younger D3-striations with normal sense of movement (Figure 11g). D3 event takes place during Miocene-Pliocene time while D3 extension continues about at the same orientation, NE-SW to ENE-WSW, with the earlier D1 and D2 events. The fault plane analyses yielded subvertical the maximum σ1-stress axis and subhorizontal ENE-WSW to E-W trending the minimum σ3-stress axis (Figure 12).
Figure 13. Structural map with the main fault zones and their kinematics (western part of the THB)
Detail structural map with the main fault zones and their kinematics, related to the evolutionary history of the THB (western part of the THB).The geometry of kinematics for each fault zone is shown in the stereographic diagrams (equal area, lower hemisphere). Arrows in the diagrams indicate the main development of the slikenlines on the fault planes and their relative dating (D1), according to the deformational events that have been distinguished. The numbers (1..) show the locations of the tectonic measurements.
The D4-event is related to large WNW-ESE to NE-SW normal oblique fault zones (Figures 11j, 12, 13, 14) some of which are older, reactivated during D4, as it is indicated by the existence of at least two striations` generations on their fault planes, with the younger one to be compatible with the D4 kinematics (Figures 13, 14). D4 structures are of Pliocene-Pleistocene age, characterized also by minor oblique reverse faults. Extension orientation changes slightly during D4 to NNW-SSE, associated with a subhorizontal ENE-WSW contraction. Stress tensor during D4 was calculated with the minimum σ3-axis at a NNW-SSE to NNE-SSW bearing and the maximum σ1-axis at an ENE-WSW to ESE-WNW direction, both with a low to moderate plunge, respectively (Figure12).
Some of the D4 fault zones remain active until present time (D5). They form large active faults reactivated during the present stress field in the area defined by the earthquake focal mechanisms and characterized by a NNE-SSW oriented subhorizontal extension (Figures 12, 13, 14). The paleostress analysis of the D5 active faults revealed a minimum σ3-stress axis subhorizontal with NNE-SSW bearing (i.e. 100 to 300; Figure12) which coincides exactly with the active extension in the broader area, as it is concluded from the local mechanisms of the strong earthquakes (Papazachos et al. 1998).
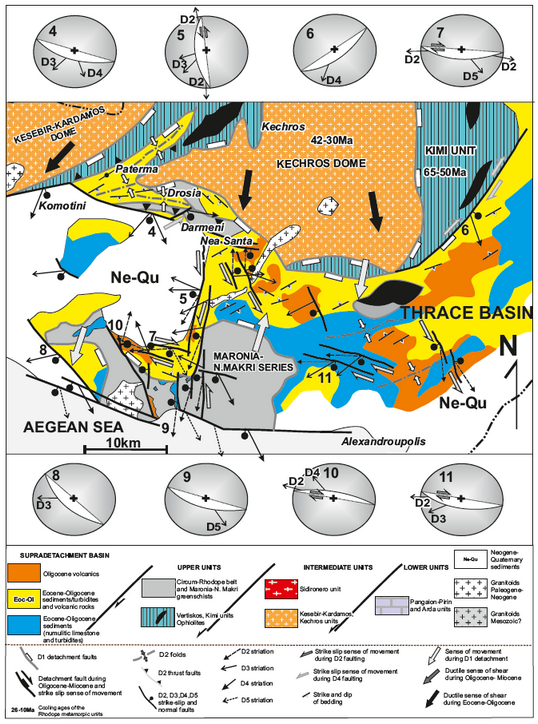
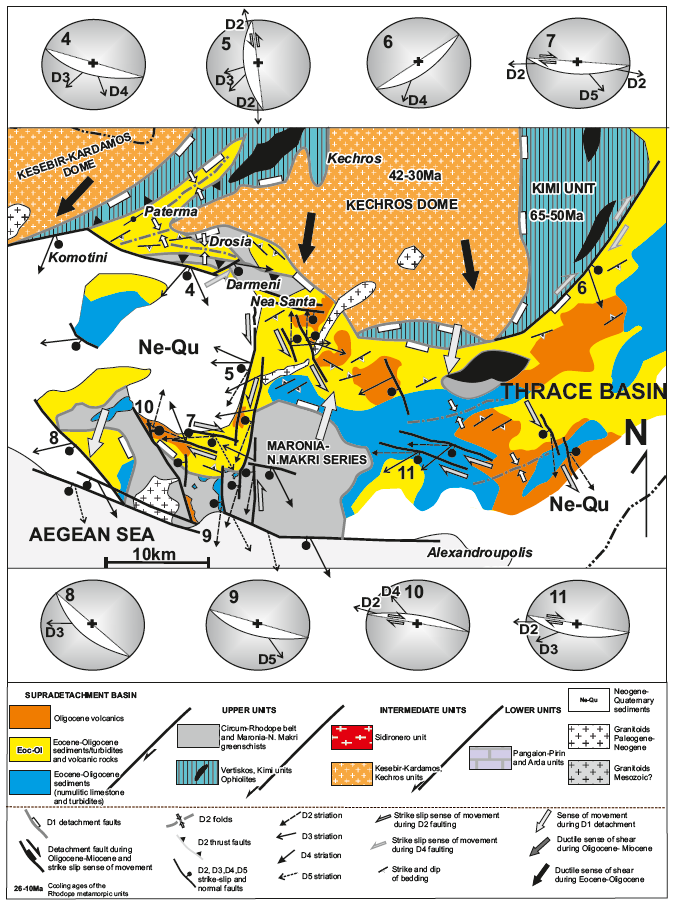
Figure 14. Structural map with the main fault zones and their kinematics (eastern part of the THB)
Detail structural map with the main fault zones and their kinematics, related to the evolutionary history of the THB (eastern part of the THB). The geometry of kinematics for each fault zone is shown in the stereographic diagrams (equal area, lower hemisphere). Arrows in the diagrams indicate the main development of the slikenlines on the fault planes and their relative dating (D1), according to the deformational events that have been distinguished. The numbers (4..) show the locations of the tectonic measurements.
We interpret the Paleogene part of the THB in the NE Greek mainland as a supradetachment basin (Kilias et al. 2013), as it is shown by the syntectonic deposition of the Paleogene molassic strata of the THB on the fault planes of the extensional detachment faults, related to the stretching and progressive exhumation of the Rhodope metamorphic nappe pile during the Tertiary (Figure 15; Dinterand Royden 1993;Dinter et al. 1995;Bonev et al. 2006;Brun and Sokoutis 2007; Burg 2012; Kilias et al. 1999, 2013). The Paleogene volcano sedimentary infilling of the Axios Basin is regarded as equivalent to the Greek Thrace Basin sedimentary sequence.