Lattice Preferred Orientation (texture) quantitative analysis by neutron diffraction
Quantitative texture analysis is used to determine the statistical distribution of crystal lattice planes orientations within a rock, separating the components related to each mineral family contribution. The crystallographic (lattice) preferred orientation (LPO) of rock-forming minerals is then used as indicator not only of the strain state during the LPO development but also of the pressure and temperature conditions, relating the observed LPO patterns to those reported in literature from experimental, natural observations or numerical simulations (Karato, 2008; Tommasi et al. 2000; Warren et a., 2008). In the following paragraphs, the results from a LPO study of three samples will be shown; the samples have been selected among those preserving the best relics of olivine crystals, providing a good material to relate LPO with the physical conditions under which olivine aggregates have grown or were deformed.
Description of studied samples
ANT64 – Foliated olivine (90%) + spinel (5%) + chlorite (5%) peridotite
ANT64 is a dunite mainly consisting of olivine (Ol 90%), while opaque minerals, chlorite, ± serpentine constitute less than 10% of the rock. The pre-S1 foliation is defined by the shape-preferred orientation of olivine. Olivine occurs as elongated porphyroblasts, locally strongly strained (Olp) and rimmed by fine aggregates of newly-formed olivine neoblasts (Oln) (see Fig. 3).
ANT138 – Massive olivine (60%) + orthopyroxene/clinopyroxene (30%) + spinel (10%)
ANT138 is a massive peridotite partly replaced by chlorite and amphibole. The original porphyroclastic texture is still shown by olivine large grains (1-2mm) and pyroxene domains. Spinel grains occur as partly replaced domains where the original spinel grains are rimmed by aggregates of chlorite. A gentle SPO of olivine grains occurs also associated with undulose extinction and lamellae.
ANT120 – Massive olivine (40%) + amphibole (30-35%) + chlorite (20%) peridotite
ANT120 is a massive, coarse-grained peridotite partly replaced by aggregates of amphibole and chlorite. Relics of olivine occur as large (1-2mm) porphyroclasts rimmed by thin aggregates of chlorite and amphibole. Amphibole also occurs as large grains not showing preferred orientation. Relicts of original olivine peridotite are wrapped by layers of fine grained amphibole + chlorite. Olivine commonly shows undulose extinction and sub-grains (<1mm).
Method
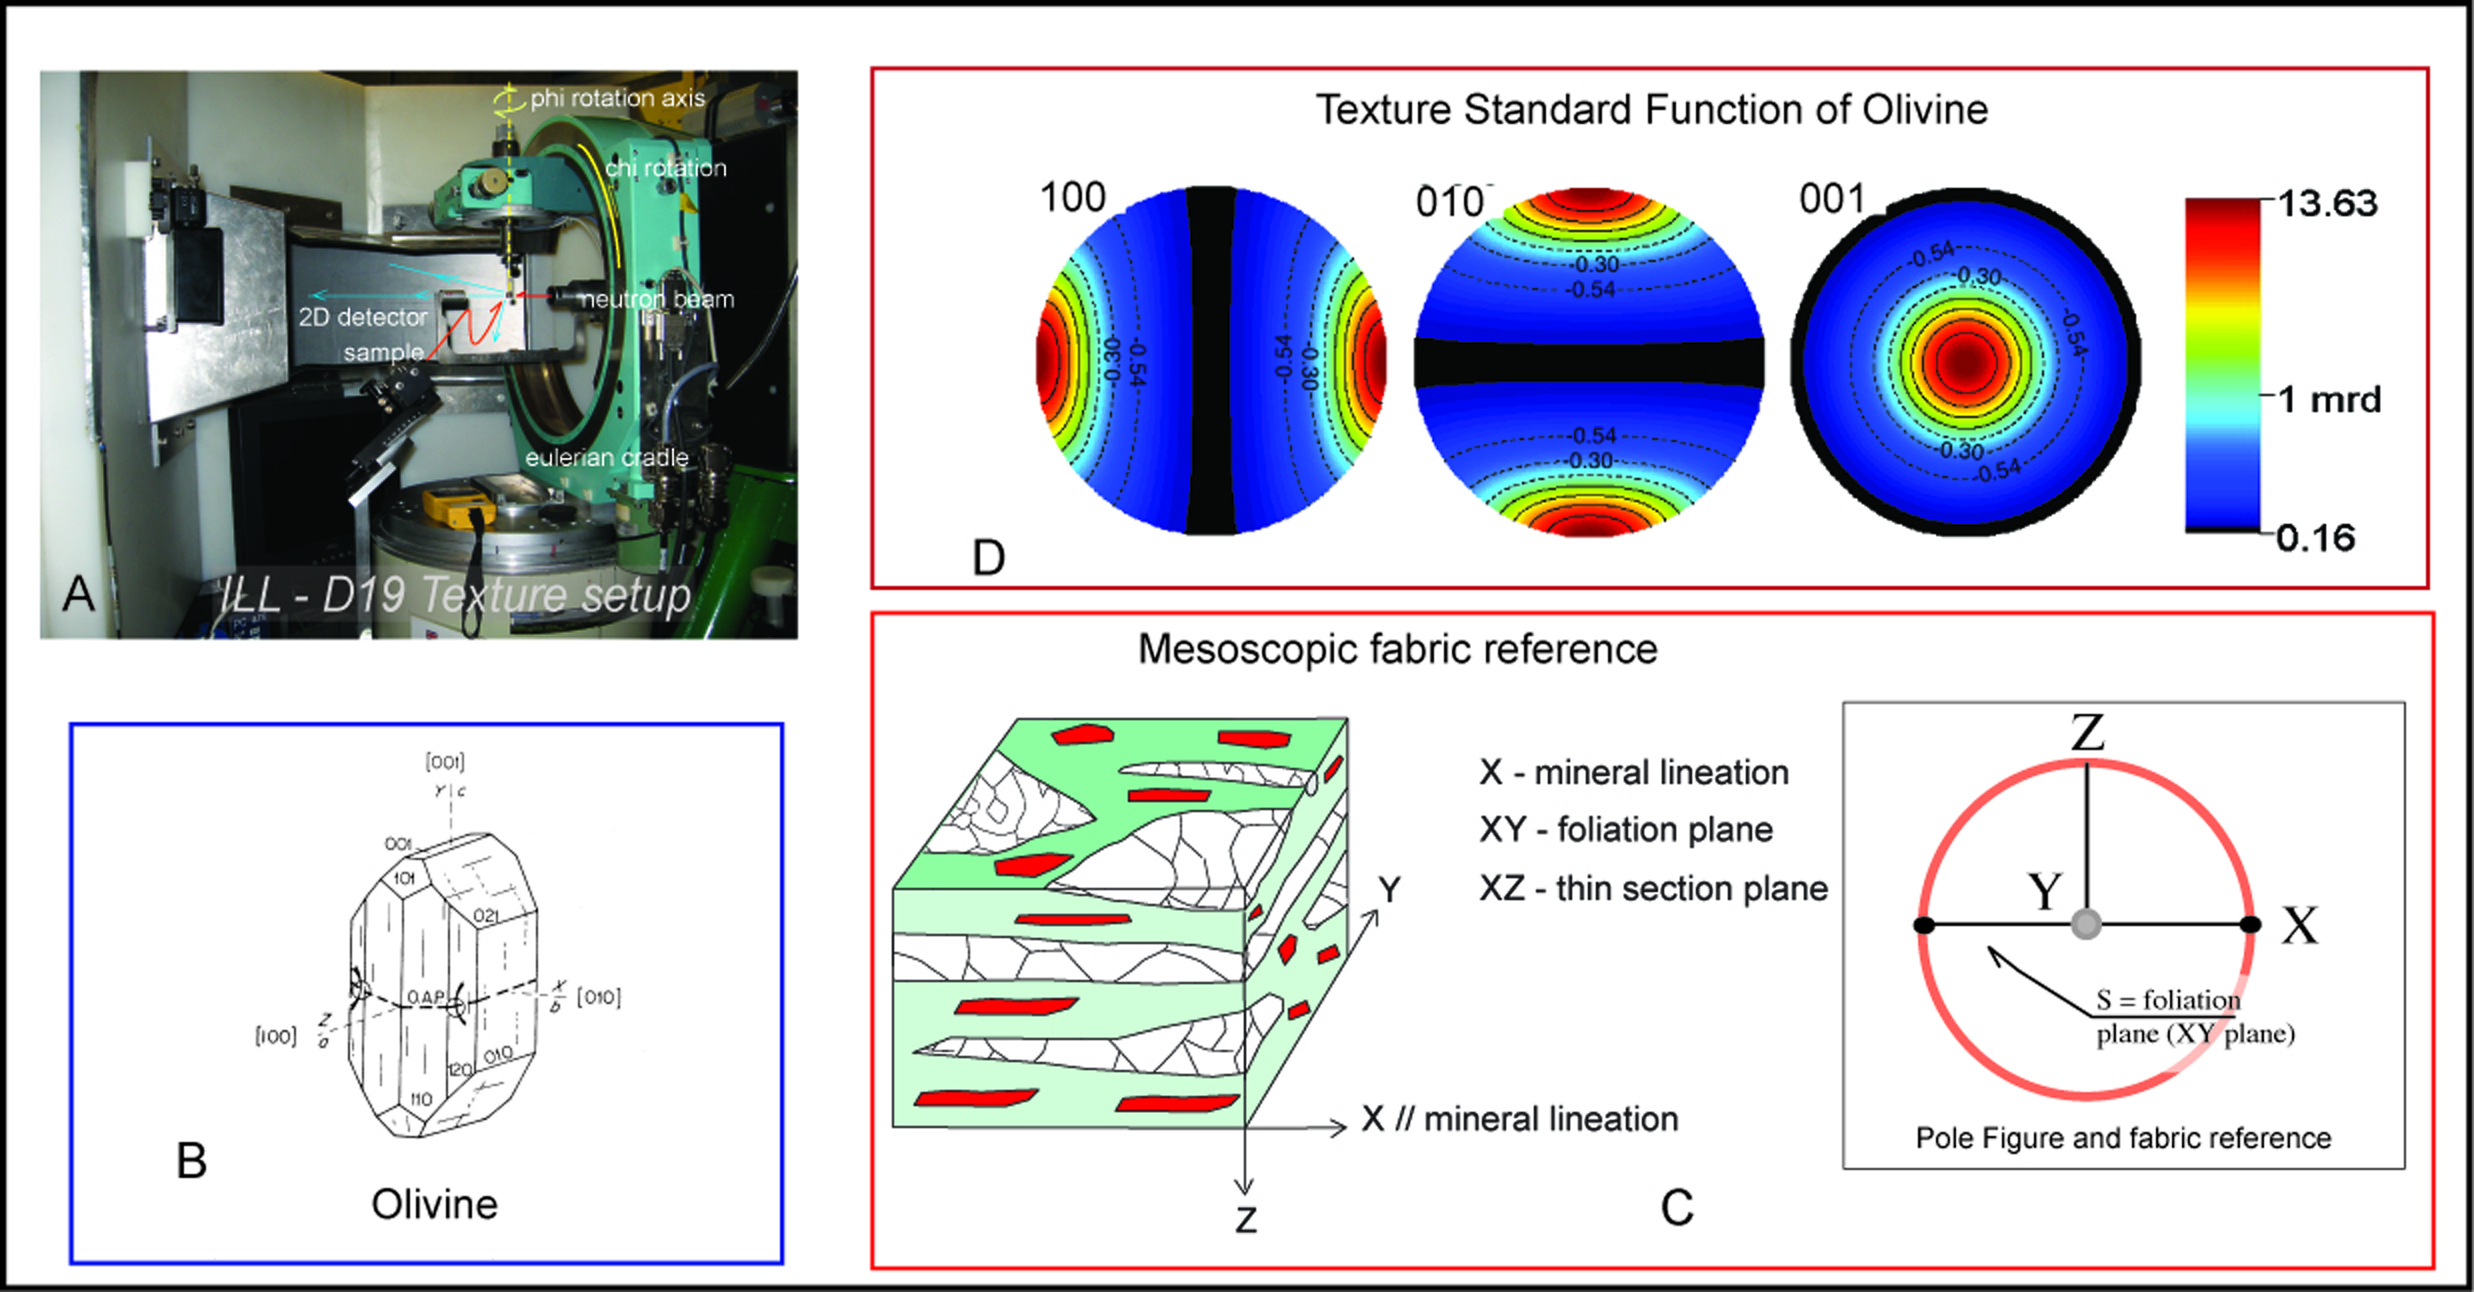
In order to quantify the LPO of minerals, a neutron diffraction technique was used. This technique allows us to investigate volumes of rock of ≈ 1 cm3-volume in a short time (about 1-2 hours), thanks to the penetration of neutron in matter and to the high flux, available at the nuclear reactor at the Institute Laue-Langevin (Grenoble, France). The samples were measured at D19 diffractometer (www.ill.eu/instruments-support/instruments-groups/instruments/d19/), which covers an angular range of 120°x30° with spatial resolution of 0.19° horizontally and 0.12° vertically. The detecting columns cover an equivalent χ-range of 30° to 60°, for a total detecting solid angle of roughly 1.1 sr. A wavelength of 1.46 Å was used; the data reduction strategy consisted of intensity corrections, localisation corrections and combined analysis. This instrument is located as close to the neutron source, and the flux at the sample position is between 107 to 108 ncm-2s-1. More details about the experimental and beamline setup have been already described elsewhere (D1B beamline: Camana et al., 2002; Zucali et al., 2002; D19 beamline: Zucali et al., 2010; Tartarotti et al., 2011). More details about LPO analysis using neutron or X-ray diffraction may be found in the following literature (Bunge et al., 1982; Wenk, 1985; Heizmann and Laruelle, 1986; Ullemeyer et al., 1998; Wenk et al. 1994; Matthies et al., 1997; Morawiec, 2004; Chateigner, 2010). Figure 6 reports the main setup of D19 beamline as well sample references used for texture analysis as mesoscopic fabric axes, crystallographic axes of olivine and Texture Standard Functions of Olivine produced using lattice parameters and a triclinic symmetry of the sample. Texture Standard Functions correspond to the PFs of the distribution of the main crystallographic axes of olivine, with respect to mesoscopic fabric axes, as produced by a single crystal. In Figure 6 are also reported the orientation of mesoscopic fabric axes with respect to PFs; in particular, all PFs for samples ANT64, ANT138 and ANT120 are referenced to the mesoscopic foliation plane (XY plane), where X direction is the mineral lineation, represented by the horizontal line in the PFs. The normal to the foliation plane plots at the north pole of the PF.
Figure 6. ILL –D19 diffractometer setup and sample mesoscopic and pole figure references.
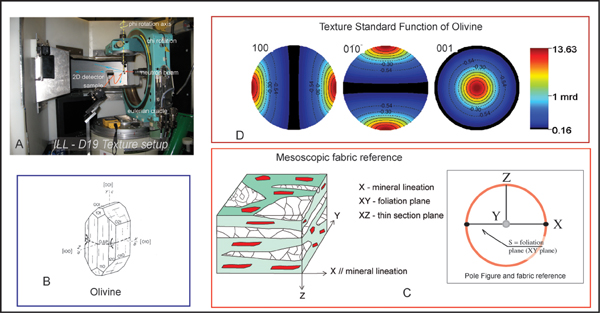
A) D19 setup showing the incident and diffracted beam directions with respect to the eulerian cradle and position sensitive detector; B) Olivine crystal structure; C) Mesoscopic fabric references: X, Y and Z axes are shown in rock sample and pole figure representation. D) Texture Standard Function pole figure of olivine single crystal as represented by Maud. Triclinic sample symmetry is used.
Results
Olivine LPO was investigated and results are shown in figures 7 and 8 and table 1. Table 1, in particular, reports main parameters resulting from each sample refinement, including estimates of the texture refinement qualities, where RW and RB correspond to weighted and Bragg factors for ODF analysis (Chateigner, 2010); the F2 factor (i.e. the texture factor) is an estimate of the overall LPO strength (Bunge and Esling, 1982); this latter decreases from ANT64 to ANT138. One should, however, bear in mind that F2 is largely influenced by the texture kind and crystal phase. GoF (Goodness of Fit) also describes the quality of the refinement (Toby, 2006) and its values are reported in Table 1. The Quantitative Texture Analysis was performed on two samples of massive peridotite and one sample of foliated dunite. In the three samples LPO analysis was performed on olivine since it is the only preserved mineral constituting the pre-S1 fabrics. Figure 7 reports the comparison of experimental and recalculated PFs of selected crystallographic planes. Where samples are characterized by a planar fabric, the macroscopic foliation (XY plane), is taken as the main reference to the pole figures geometry, as shown in figure 8. Olivine has an orthorhombic structure, space group Pbnm (N. 62) and the cell parameters, used for the profile fitting and E-WIMV (Matthies and Vinel, 1982; Liu et al. 1993), are a=4.77 Å, b=10.20 Å, c=6.00 Å.
Table 1. D19@ILL Years 2009-2010
| Sample | Rock Type | Minerals | Rw | Rb | GoF(sigma) | F2 (olivine) | LPO type | Grain-size (µm) |
|---|---|---|---|---|---|---|---|---|
| ANT64 | foliated dunite | ol+sp | 25.59 | 18.79 | 1.37 | 3.43 | E-D | 50-300 |
| ANT120 | massive dunite | ol+cpx/opx+sp | 18.69 | 14.25 | 0.87 | 2.72 | E-D | 50-150 |
| ANT138 | massive peridotite | ol+cpx/opx+sp | 18.6 | 14.21 | 1.07 | 2.61 | E-D | 100-250 |
| Summarized results from quantitative texture analysis at D19 beamline (ILL- Grenoble): Rw and Rb are reliability factors related to texture analysis; F2 factor is strength factor of the recalculated texture; GoF = Goodness of Fit. LPO type refers to texture types described in the text. | ||||||||
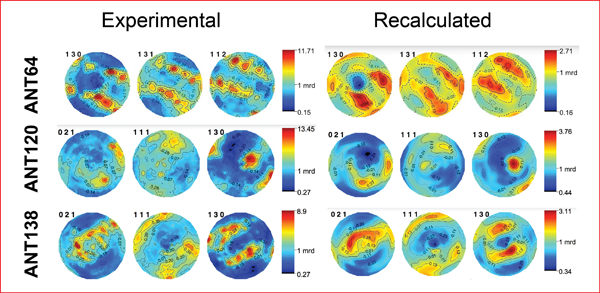
Figure 7. Experimental vs. Recalculated pole figures of olivine selected crystallographic planes orientations (mrd = multiple of random distribution).
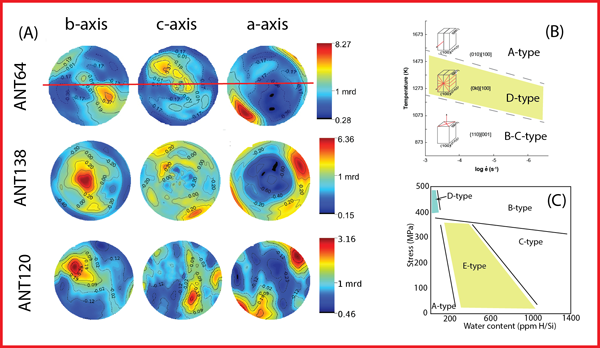
Figure 8. Main olivine texture types and their relations with stress, strain, temperature and water content.
A) Recalculated pole figure of main crystallographic planes of olivine (mrd = multiple of random distribution). B) Strain rate vs. temperature diagram showing the dominant slip systems in olivine (from Carter & Ave ́ Lallemant, 1970). C) Water content vs. stress diagram for olivine after Karato (2008 and references therein).
In figure 7 PFs for selected lattice planes of olivine are shown in equal-area projection. For clarity, not all the pole figures are shown though all available ones were used to refine the ODF (Orientation Distribution Function; see Wenk, 1991). One can visually assess the goodness of the ODF solution (Toby, 2006) by the EWIMV approach, by comparison of the experimental pole figures, as extracted from experimental data, and the recalculated ones, obtained from the ODF using MAUD (Lutterotti et al., 1999). Otherwise, the low R and GoF factors (Table 1) for the Rietveld global fit of the Combined Analysis are quantitatively confirming the validity of the solution. In order to discuss the results in a simpler way, we used in the following the ODF to recalculate pole figures for the principal lattice planes for olivine, (h00) - (0k0) - (00l).
ANT64
The orientation of the main crystallographic axes (Fig. 8) of olivine in ANT64 is characterized by strong maximum of the [100] axis, lying within the XZ plane and at about 40-45° to the foliation plane. The [010] and [001] pole figures exhibit distributions of the b and c-axes, respectively, in a plane perpendicular to (XZ). These distributions reveal a main component with b and c axes roughly around 45° from Y, and two minor components. One of the latter corresponds to c-axes aligned with Y, a and b being on the equator, simply rotated by 45° around Y. Similar LPO distributions are described for natural and experimentally deformed olivine in simple-shear regime.
ANT138
In ANT138 olivine main axes exhibit a unique b alignment along Y with, however, a larger distribution than in ANT64 (Fig. 8). This larger distribution explains why both the maximum density of pole figures and F indexes are lower than in ANT64. The main component for the LPO of olivine is with a-axes at a similar orientation as ANT64 with, however, around 10-20° more towards the foliation plane. A second minor component corresponds to a-axes at 90° from the main component in the XZ plane.
ANT120
Olivine in ANT120 also displays a main LPO component with a-axes located in the XZ plane, but this latter splits into a second and third components some ten degrees off XZ. B-axes are like in ANT138 distributed around a single pole, but not centered on Y. The overall texture strength is lower than in the two other samples, due to both the dispersion of the components and splits. Such mixed distribution may be related to intracrystalline deformation occurring in large olivine grains as shown at the microscopic scale. It is likely that the original distribution is partly dispersed as consequence of intracrystalline creep as testified by undulose extinction and sub-grains. As discussed previously, sample ANT120 is not characterised by meso- and microscopic planar or linear structures.