P-T estimates and metamorphic evolution
Micro-structural analysis indicates that the Mt. Mucrone rocks preserve evidence of superposed metamorphic and structural re-equilibrations, even at thin section scale, and allows definition of assemblage sequences in metapelites and metagranitoids, syn-tectonic with successive deformation stages. To infer PT conditions active during each metamorphic re-equilibration, favourable sites where microstructures suggest the attainment of grain-scale equilibrium have been identified. For this purpose, samples dominated by a single structural and metamorphic imprint at thin section scale have been selected, to obtain internally coherent PT estimates, using independent thermo-barometers. Even so, metamorphic conditions inferred using critical minerals such as Grt, for which the compositional zoning suggests a heterogeneous re-equilibration with the matrix assemblage, have been calculated selecting mineral pairs with textural relationships indicating equilibrium. We also considered that mica, Cpx and Amp grains associated with different fabric elements in the same rock, may have different chemical compositions, reflecting different intra- and inter-crystalline deformation mechanisms, as it has been demonstrated under various metamorphic conditions (e.g. Buatier & Lardeaux, 1987; Cimmino & Messiga, 1979; di Paola & Spalla, 2000; Gazzola et al., 2000; Lardeaux et al., 1983; Spalla, 1993; Spalla & Zucali, 2004). This makes these minerals proper to estimate the physical conditions during the development of successive fabrics. PT conditions of each re-equilibration stage have been inferred using: a) the comparison of natural assemblages with experimental univariant equilibria; b) calculation of average PT using the THERMOCALC package (Holland & Powell, 1998; Powell & Holland, 1994) based on specific mineral compositions; c) the application of well-calibrated, independent thermometers and barometers: calibrations have been applied taking into account the best fit between the compositional range of mineral pairs in different samples.
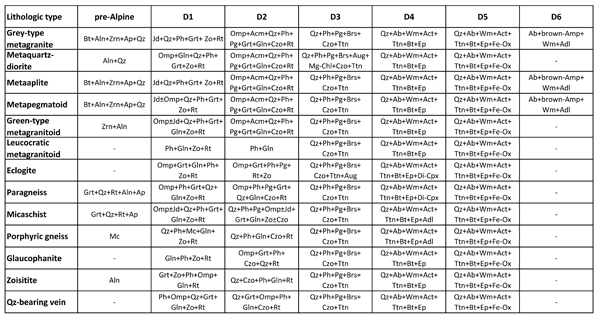
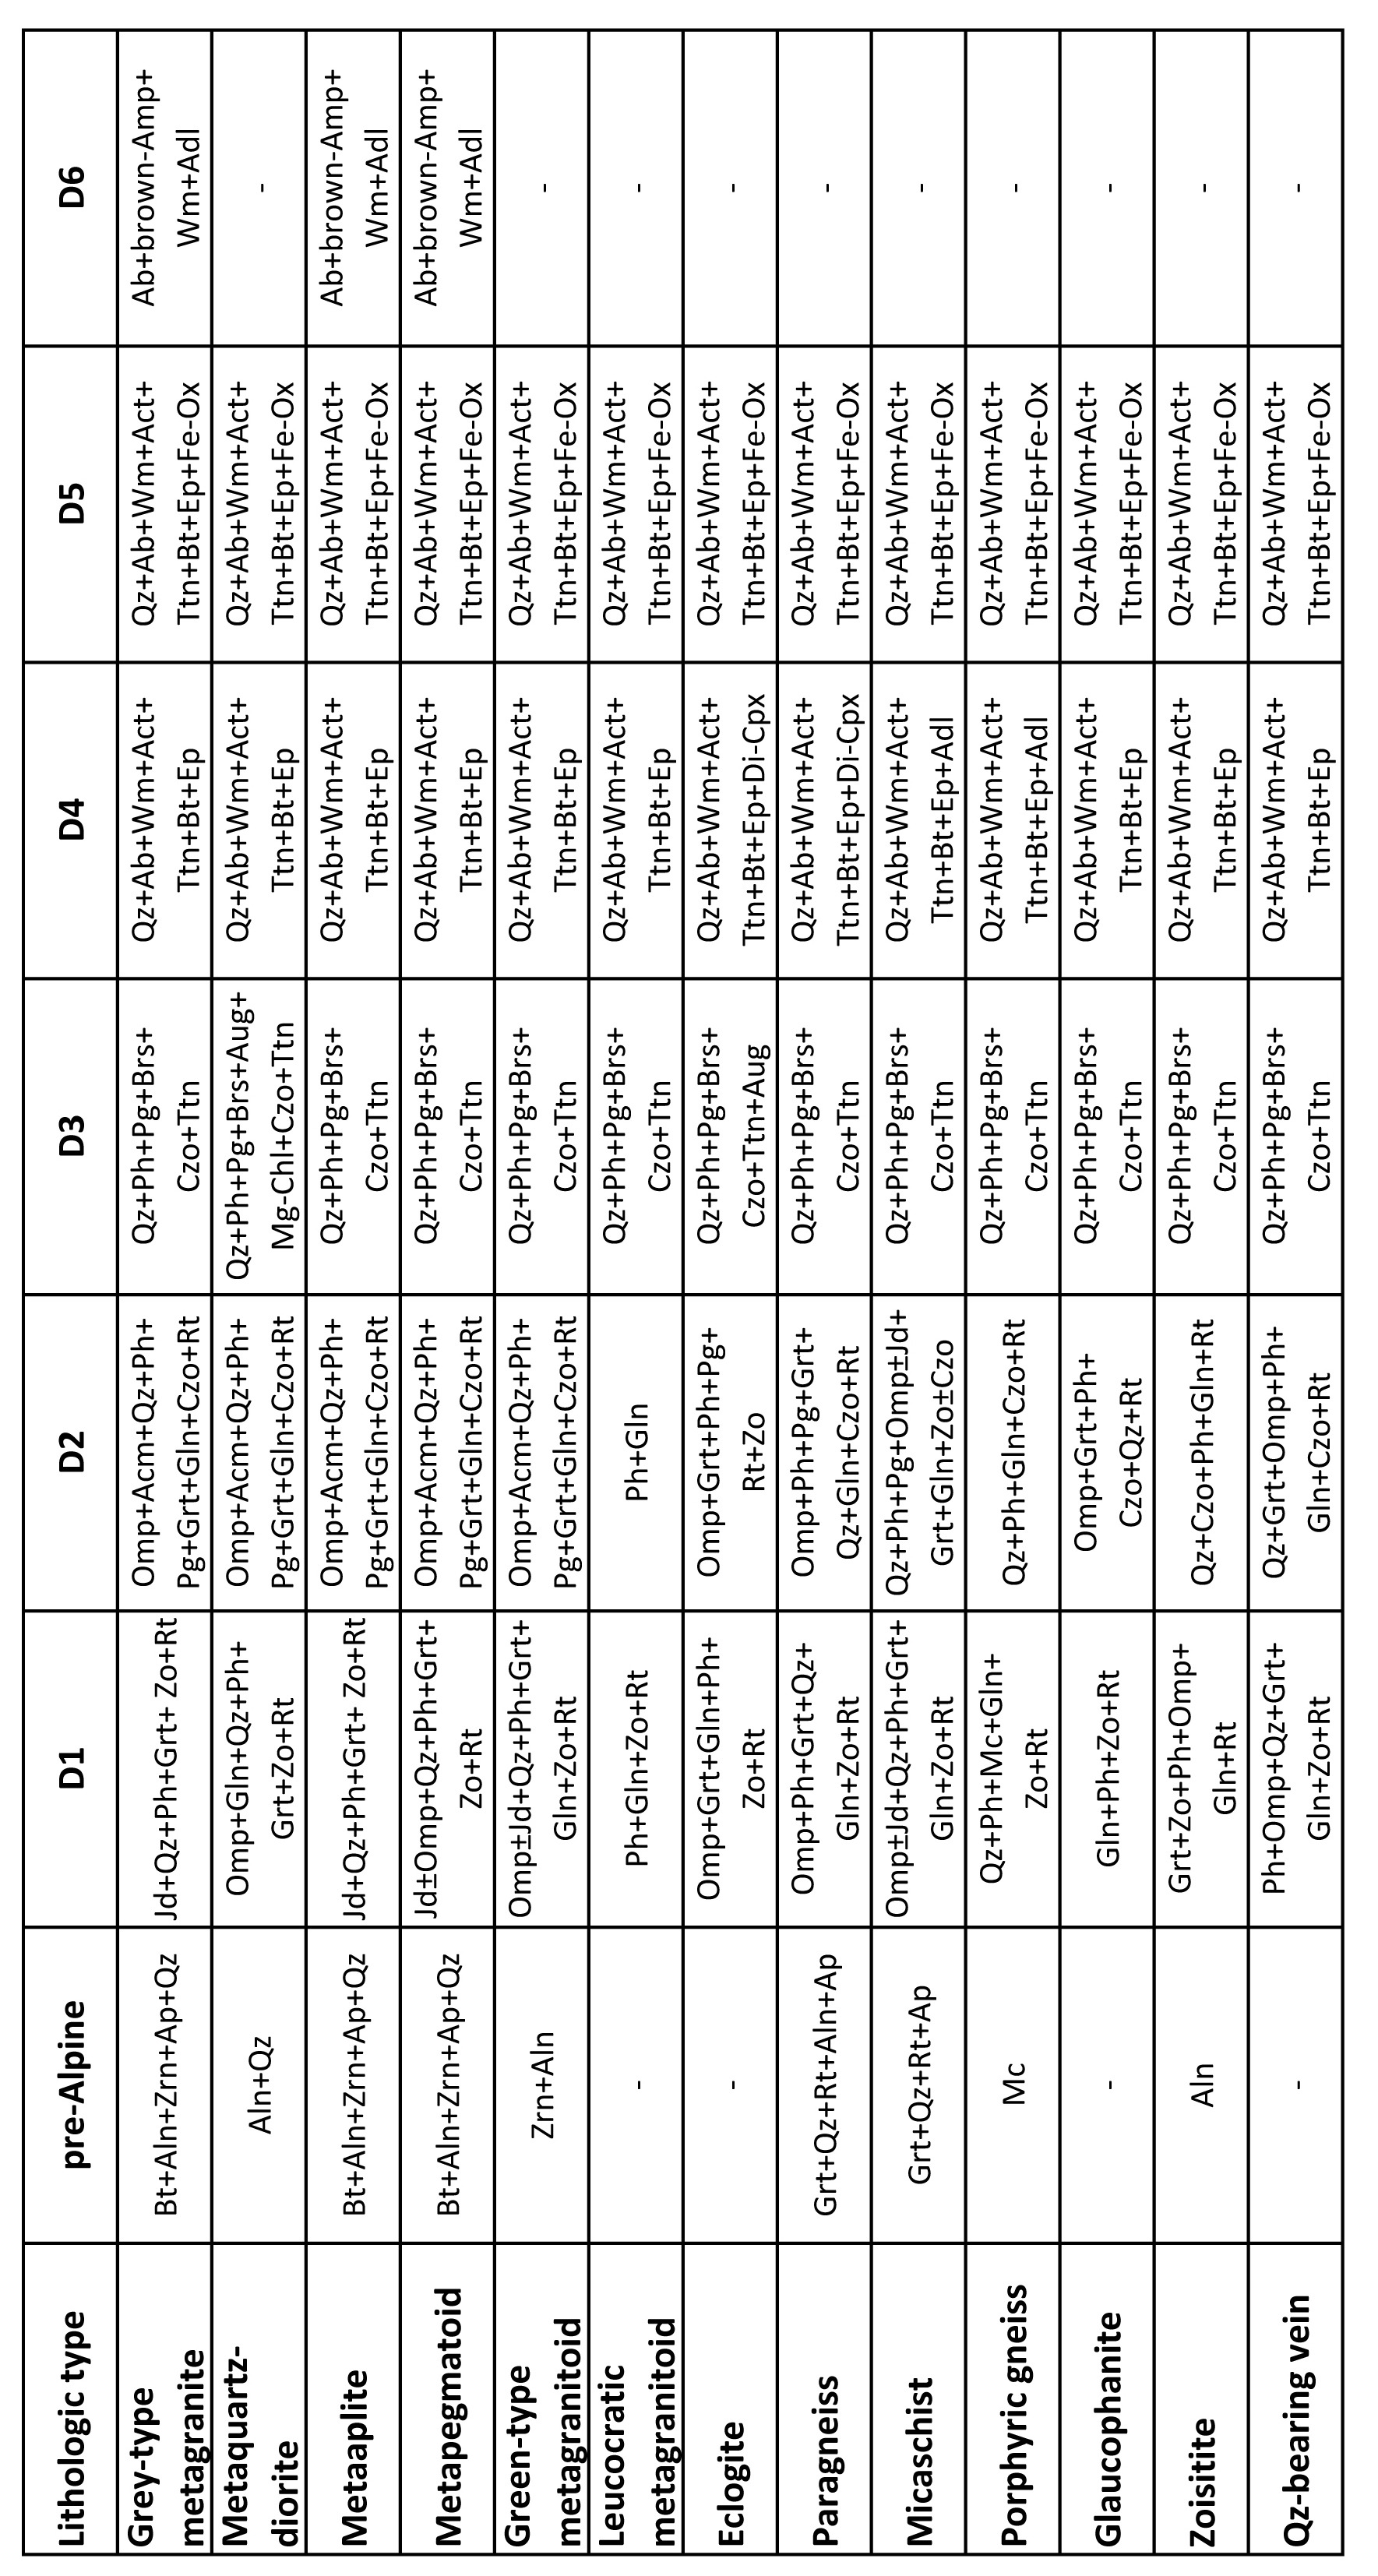
Mineral assemblages marking successive groups of structures (Tab. 3) indicate that D1 and D2 occurred under eclogite facies conditions, D3 under blueschist-facies conditions and D4 to D6 under greenschist facies conditions. In metagranitoids the integrated use of AX and average PT routines of THERMOCALC gives P = 1.9 ± 0.3 GPa and T = 479° ± 50° C for syn-D1 assemblage Gln-Omp-Grt-Ph-Zo (with Qz in excess), P = 2.6 ± 0.3 GPa and T = 522° ± 45° C for syn-D2 assemblage Gln-Omp-Grt-Ph-Pg-Zo (with Qz in excess), P = 1.4 ± 0.4 GPa and T = 515° ± 45° C for syn-D3 assemblage Brs-Grt-Czo-MgChl-Ph-Di-rich Cpx (with Qz in excess). Temperatures have also been estimated using the Fe-Mg exchange between garnet and white mica (Wu et al., 2002) stable during D2 at 586° ± 49° C. Si4+ content in pre-D3 Ph ranges from 3.4 and 3.5 a.p.f.u., covering the same composition interval obtained in Ph synthetized under HP condition in metatonalitic systems at P ≥ 2.0 GPa (Schmidt, 1993). In eclogites, average PT calculations on the assemblage Omp-Gln-Grt-Ph-Zo-Qz, stable during D1, gives P = 1.9 ± 0.5 and T = 504° ± 150° C. Temperatures have been evaluated using the Fe-Mg exchange between garnet and clinopyroxene marking D1 fabric at T = 488° ± 25° C for P = 1.4 – 2.3 GPa (Krogh Ravna, 2000). Variation in garnet compositions from syn-D1 to syn-D2 grains, if compared with experimental results at high pressure on metabasalts (Poli, 1993), indicates P ranging from 2.0 to 2.2 GPa, in agreement with D1-D2 P-interval estimated with average PT also in metagranitoids. In micaschists and paragneisses the garnet - white mica thermometer applied to syn-D2 mineral pairs gives T = 554° ± 49° C and T =597° ± 44° C, respectively. The coexistence of actinolitic amphibole (Altot = 0.2 – 0.9 a.p.f.u.) with albite (An ≤ 0.05) during D5 in paragneisses allows the evaluation of P ≤ 0.4 GPa and T ≤ 400°C (Plyusnina, 1982). The inferred PT values for the different syn-tectonic assemblages perfectly justify the variations of mineral chemical compositions, such as: i) CaNa-amphiboles, in which the evolution from syn-D1/D2 to syn-D3 grains is marked by a decrease in Altot and Na; ii) the increase of Jd-content in Cpx grains from D1 to D2; iii) the decrease of Si4+ content in Ph, from syn-D1 to syn-D5; iv) Grt zoning.
These results on the chemistry of single minerals, constituents of the successive fabrics, are compatible with the sequence of syn-tectonic assemblages and are synthesized in the Pressure-Temperature-deformation-time (PTdt) path diagram of Fig. 15 showing that the structural evolution from D1 to D2 occurred during a P-prograde path, characterised by a slight T-increase. D2 deformation assisted the P-T climax conditions and was followed by decompression at quite constant T, characterising D3 conditions. Syn-D4 greenschist-facies mineral assemblages and the syn-D5 PT estimates indicate that the last deformation stages developed during a significant T-decrease, associated with decompression.
Table 3. Mineral assemblages marking successive fabrics in the different lithotypes of Mt. Mucrone lithostratigraphy.
Figure 15. PT paths inferred for the Mt. Mucrone rocks
Boxes represents the average PT estimates performed with AX and average PT routines of THERMOCALC in metagranitoids (colored boxes) and eclogites (dashed box). Red dashed lines represents T-intervals estimated with the Grt-Amp thermometer in eclogites. Blue dashed lines represents T-intervals estimated with the Grt-white mica thermometer in micaschists and paragneisses. Green open triangle locates the evaluation of syn-D5 conditions in paragneisses. Metamorphic facies (Ernst & Liou, 2008): GS = greenschist; EA = epidote-amphibolite; BS = blueschist; AM = amphibolite; Amp-EC = amphibole-bearing eclogite; HGR = high pressure granulite; GR = granulite. Brs/Act transition (Ernst, 1979); Act/Hbl transition (Moody et al., 1983); Omp-in and Amp-out (Poli & Schmidt, 1995); Pl-out and Grt-in (Liu et al., 1996). In the inset, the inferred PTdt path (orange) is compared with that of Zucali et al. (2002), shown in blue. Ligth-green lines are geotherms: 1) “cold” subduction zones, 2) “warm” subduction zones, 3) normal gradient of old plate interior, 4) near spreading ridge or volcanic arc (Cloos, 1993).