Correlation of the faults with the fault plane solutions
In order to further explore the possible correlation of the mapped faults with the fault plane solution data, we have grouped all fault plane solution data in an elliptical region around each of the previous 13 main faults and computed average fault plane solutions using the method of Papazachos and Kiratzi (1992). The same approach has been adopted for the neotectonic information, wherever this was possible. The results are shown in Figure 26, where we present both earthquake and neotectonic information as equivalent fault plane solutions for three faults or groups of faults (1: Western Crete, 2-3: Malathiros - Rodopos/Kera-Karthiana and 12: Zourva), when this estimation was possible. Unfortunately, for the mapped faults in the eastern part of the study area (which exhibits much lower seismicity levels) it was not possible to have results from earthquake fault plane solutions. For both average mechanisms depicted in fig. 26, the main fault plane is identified with a thick line. The selection of this fault plane was obvious for the neotectonic observations (determined from field work), while for the earthquake data we simply adopted the fault plane that best correlated with the equivalent neotectonic fault plane solution and the mapped active fault orientation.
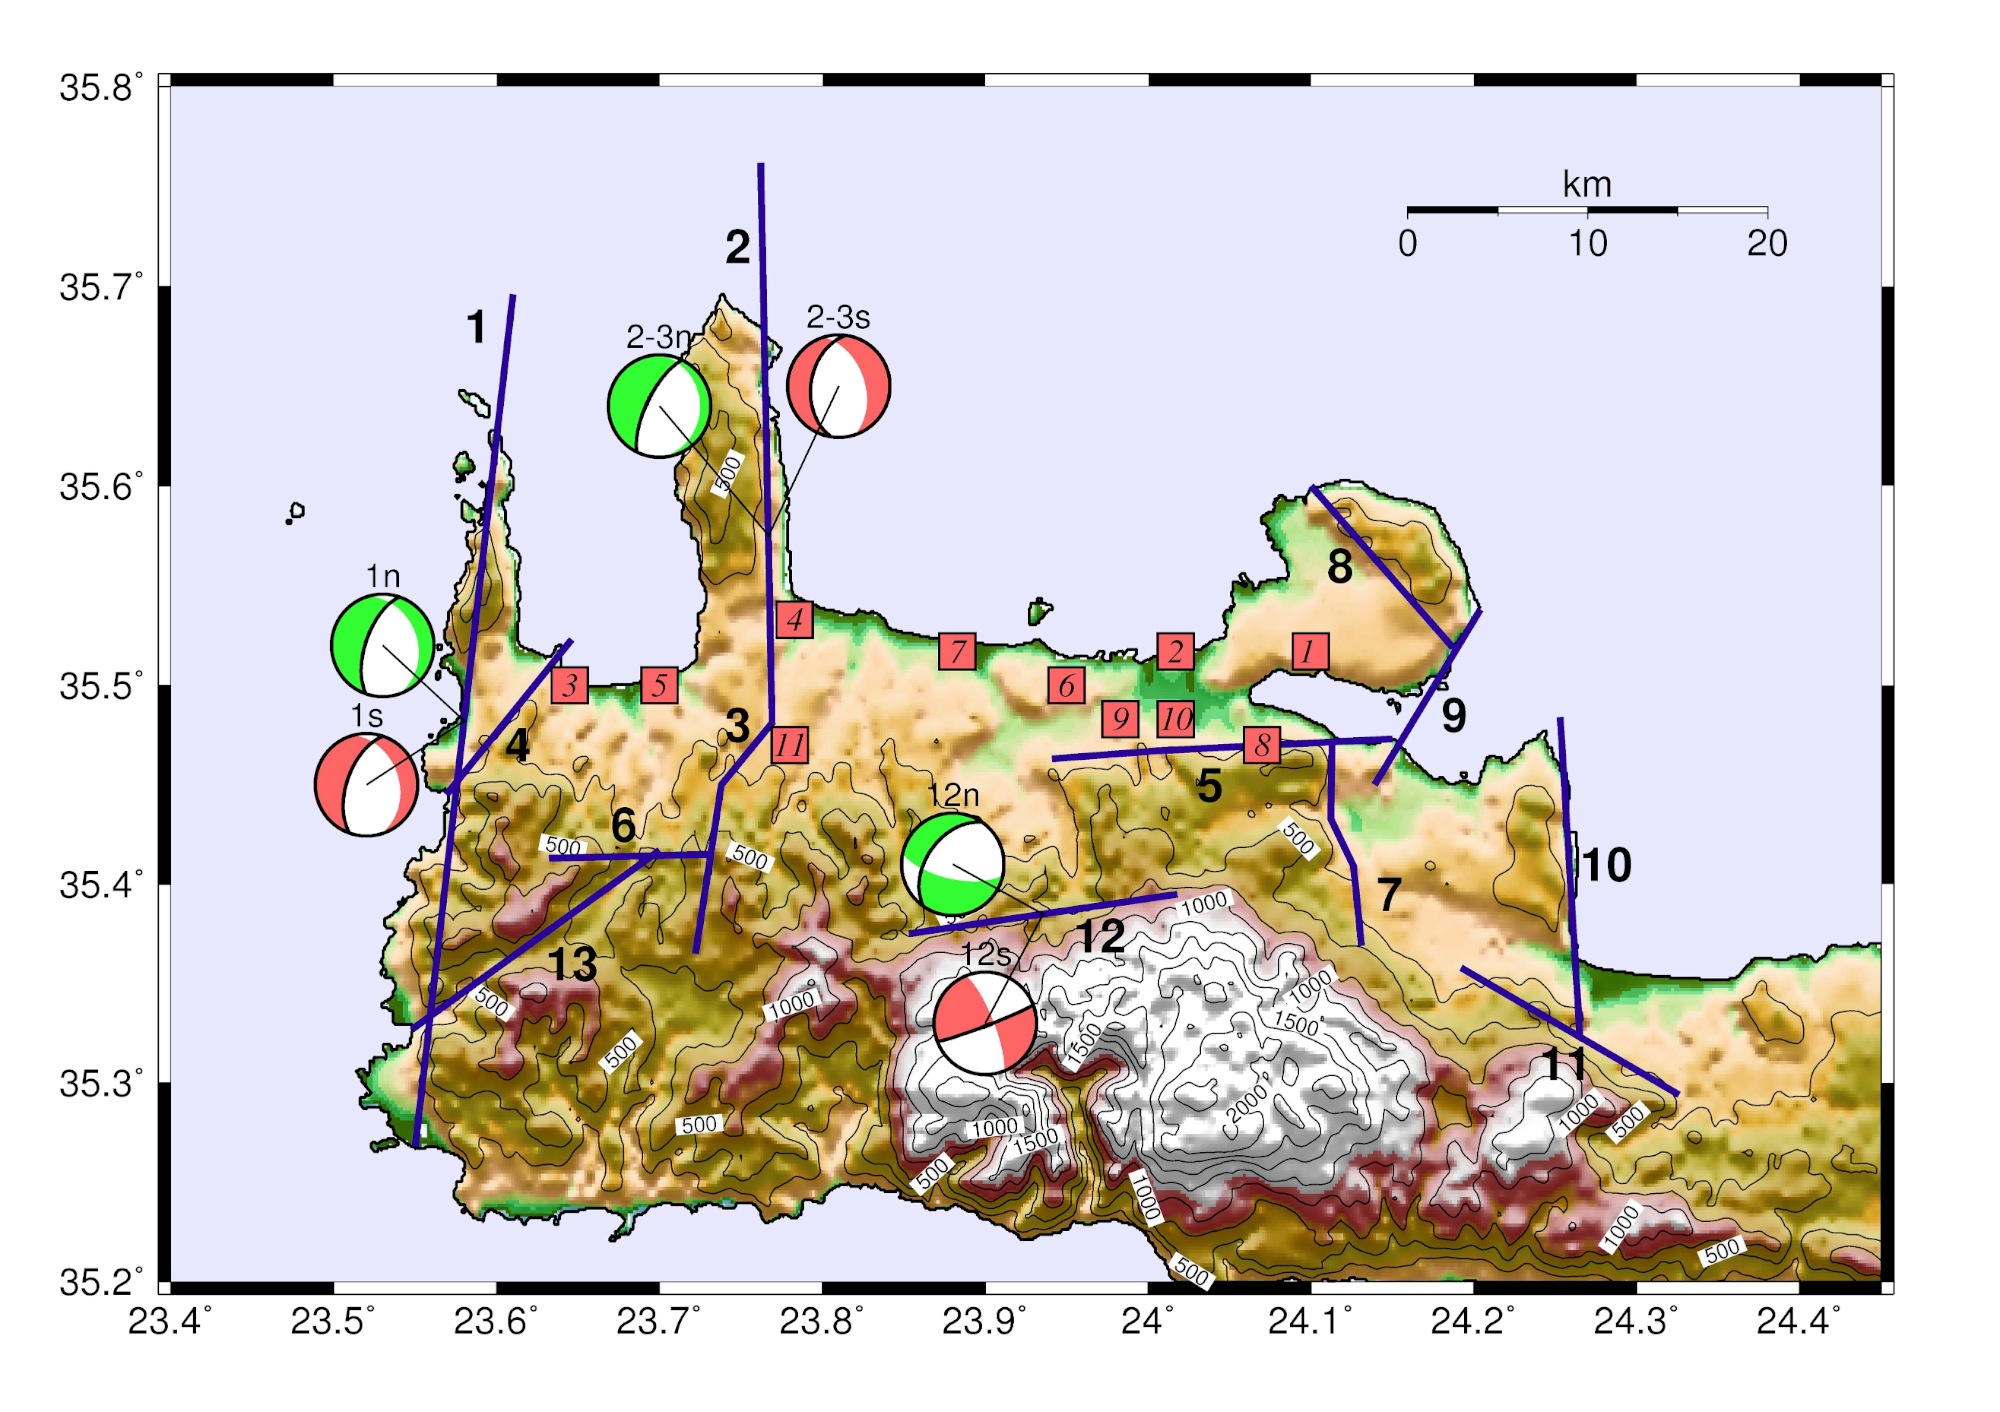
Figure 26. Average fault plane solutions

Average fault plane solutions computed using the method of Papazachos and Kiratzi (1992) for faults 1 (Western Crete), 2-3 (Malathiros - Rodopos and Kera-Karthiana) and 12 (Zourva), from the available earthquake fault plane solution data (pink colored average solutions), as well as the corresponding neotectonic information from field observations (green colored average solutions). The main fault-plane is depicted with a thick line (see text for explanations). Red squares correspond to selected sites (former municipality centers) for which seismic hazard analysis was performed (1:Akrotiri, 2: Chania, 3: Kissamos, 4: Kolymvari, 5: Mythimna, 6: N.Kydonia, 7: Platanias, 8: Souda, 9, Therissos, 10: Venizelos, 11: Voukolies)
The results verify the good to excellent agreement of neotectonic and earthquake information, even at a quite local (fault) scale. For the major N-S normal faults (1, 2-3), both solutions indicate a clear E-W extension, with a dip to the West. Even more surprisingly, the Zourva fault (12), which is not optimally oriented with respect to the active stress-field, operates as a sinistal strike-slip fault, with the earthquake information being more compatible with the strike of the observed (mapped in the field) fault trace. These results verify the reliability of the active fault mapping and of the corresponding determined younger extensional phase (D2), as well as the proposed reactivation of older E-W trending faults as strike-slip faults under the recent E-W extensional regime.