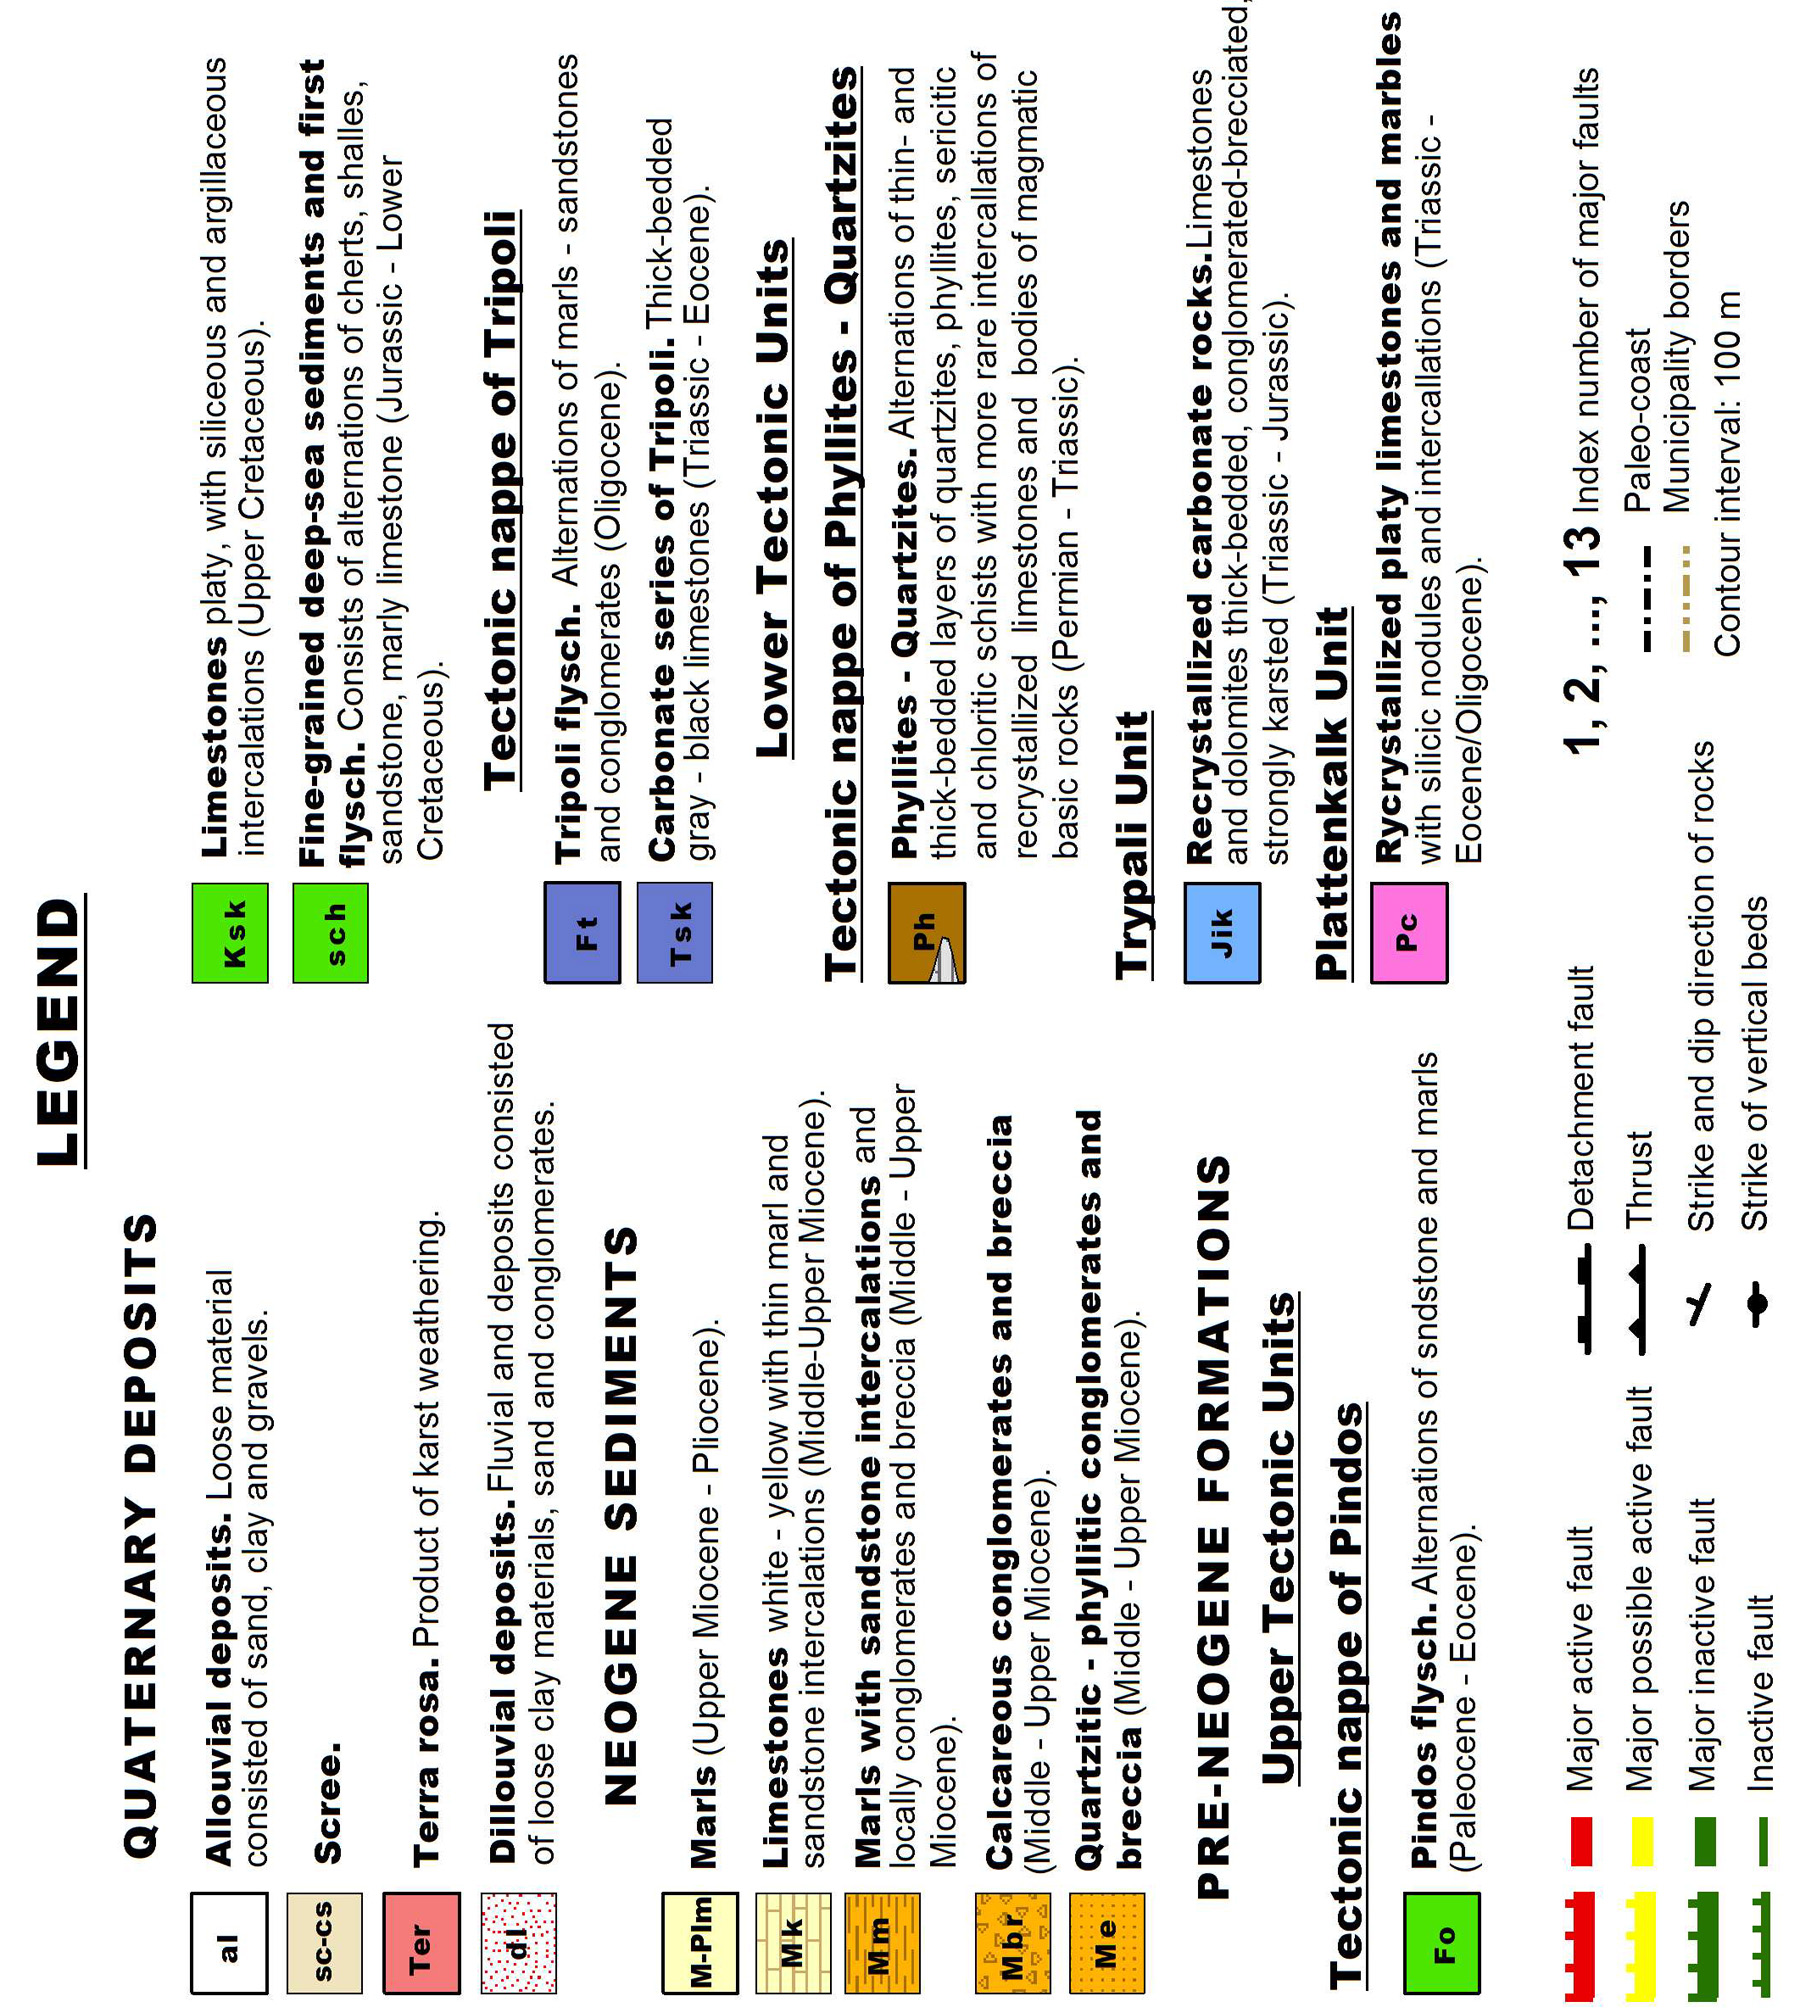
Brittle neotectonic analysis - Active stress field
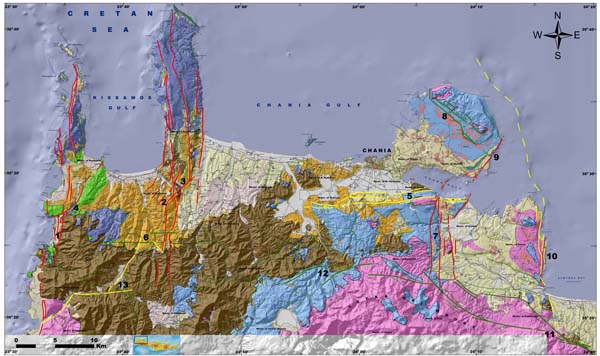
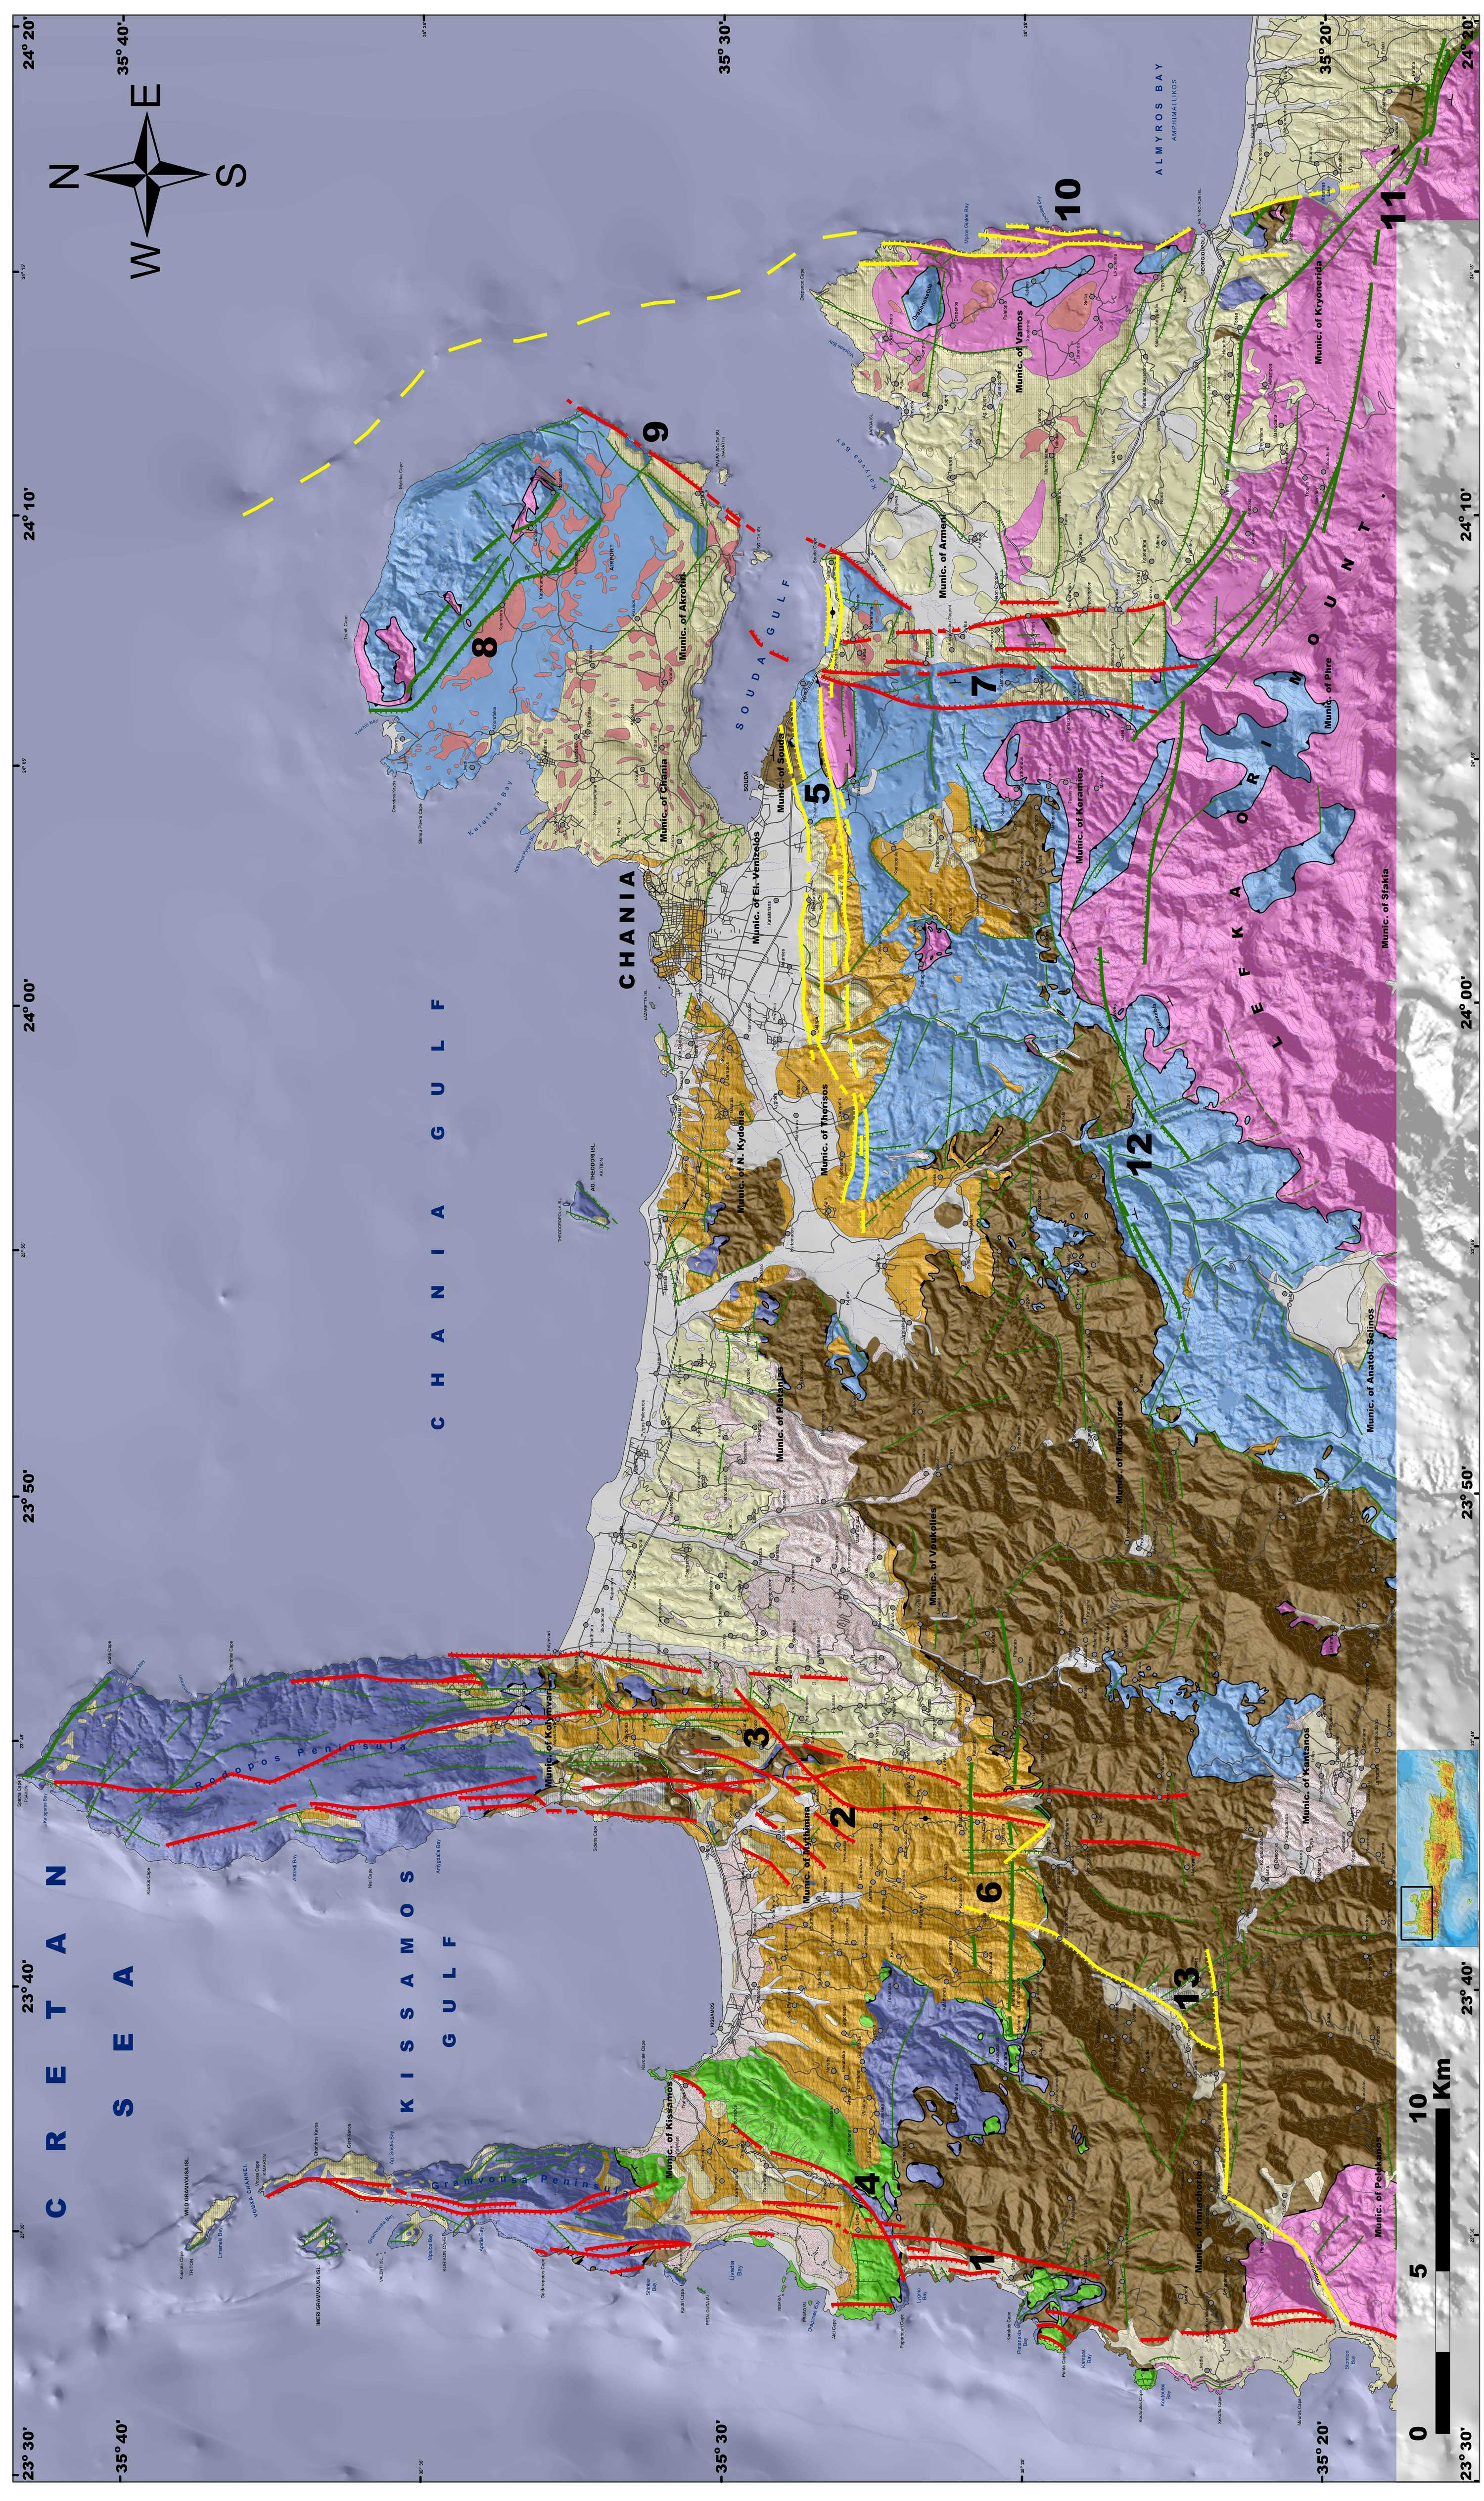
The detailed study of the brittle neotectonic deformation in Western Crete, suggests the presence of two main brittle Neogene tectonic events (D1 & D2), generating the fault network of Western Crete (fig. 5 & 6). The first D1 tectonic event took place from Middle/Upper Miocene to Upper Pliocene, as it affects the basins’ sediments of Miocene and Pliocene age, but not the younger Quaternary deposits.
The major normal faults in Western Crete of E-W strike, which in some cases locally deviate to ENE-WSW and ESE-WNW, have been formed during this D1 event. These faults dip mainly to the north at high angle and they usually correspond to the initial boundary fault zones of the Neogene basins of Western Crete. Essentially, they represent the stage immediately following the initial Miocene expansion collapse of the Crete nappes pile along low angle normal detachment faults, with both events showing the same dynamics and kinematics.
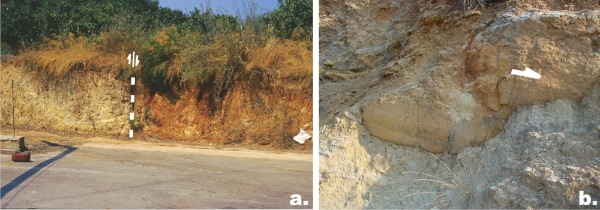
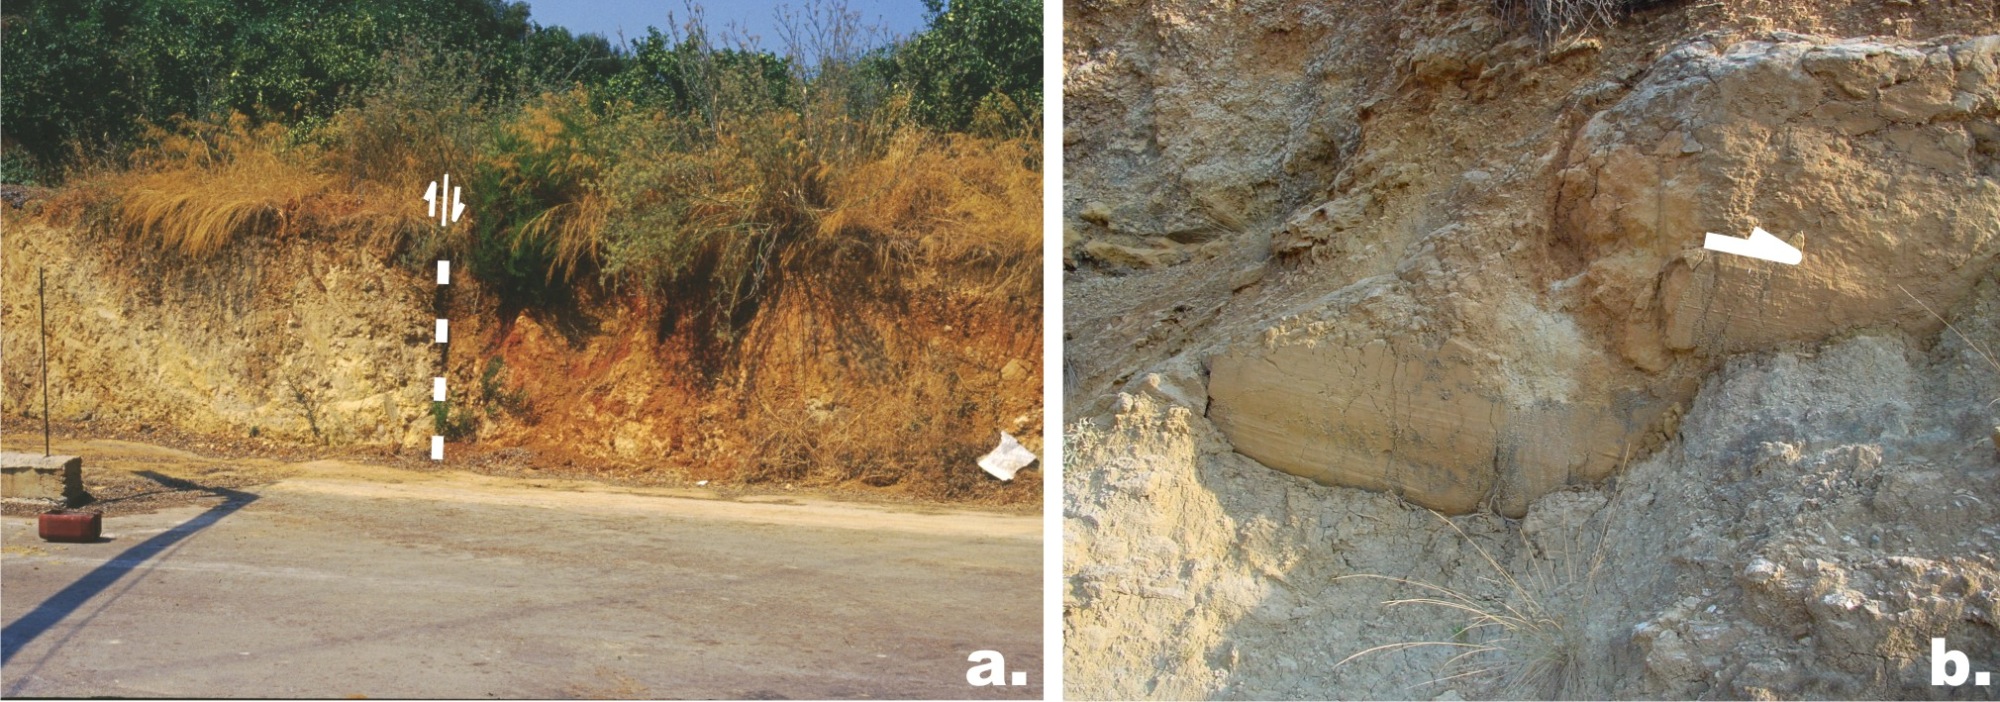
Figure 7. Photos showing influence of the faults to Pliocene and Pleistocene sediments
a. Influence of Malaxa – Souda’s Gulf fault to Pleistocene sediments. b: Topolia fault displaying strike-slip movement, showing offset structures.
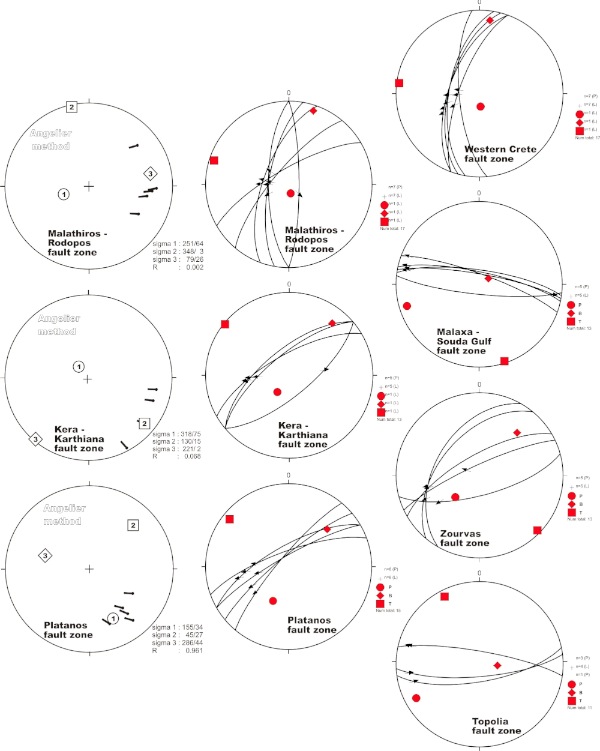
Figure 8. Representative paleostress diagrams of σ1>σ2>σ3 for the older D1 tectonic event
(lower hemisphere projection) by P-T method (Turner 1953) (see text for explanation).
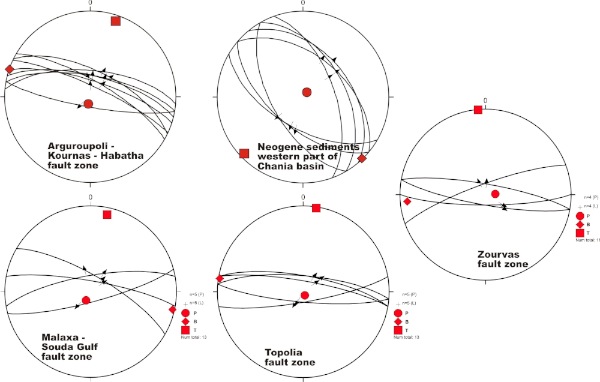
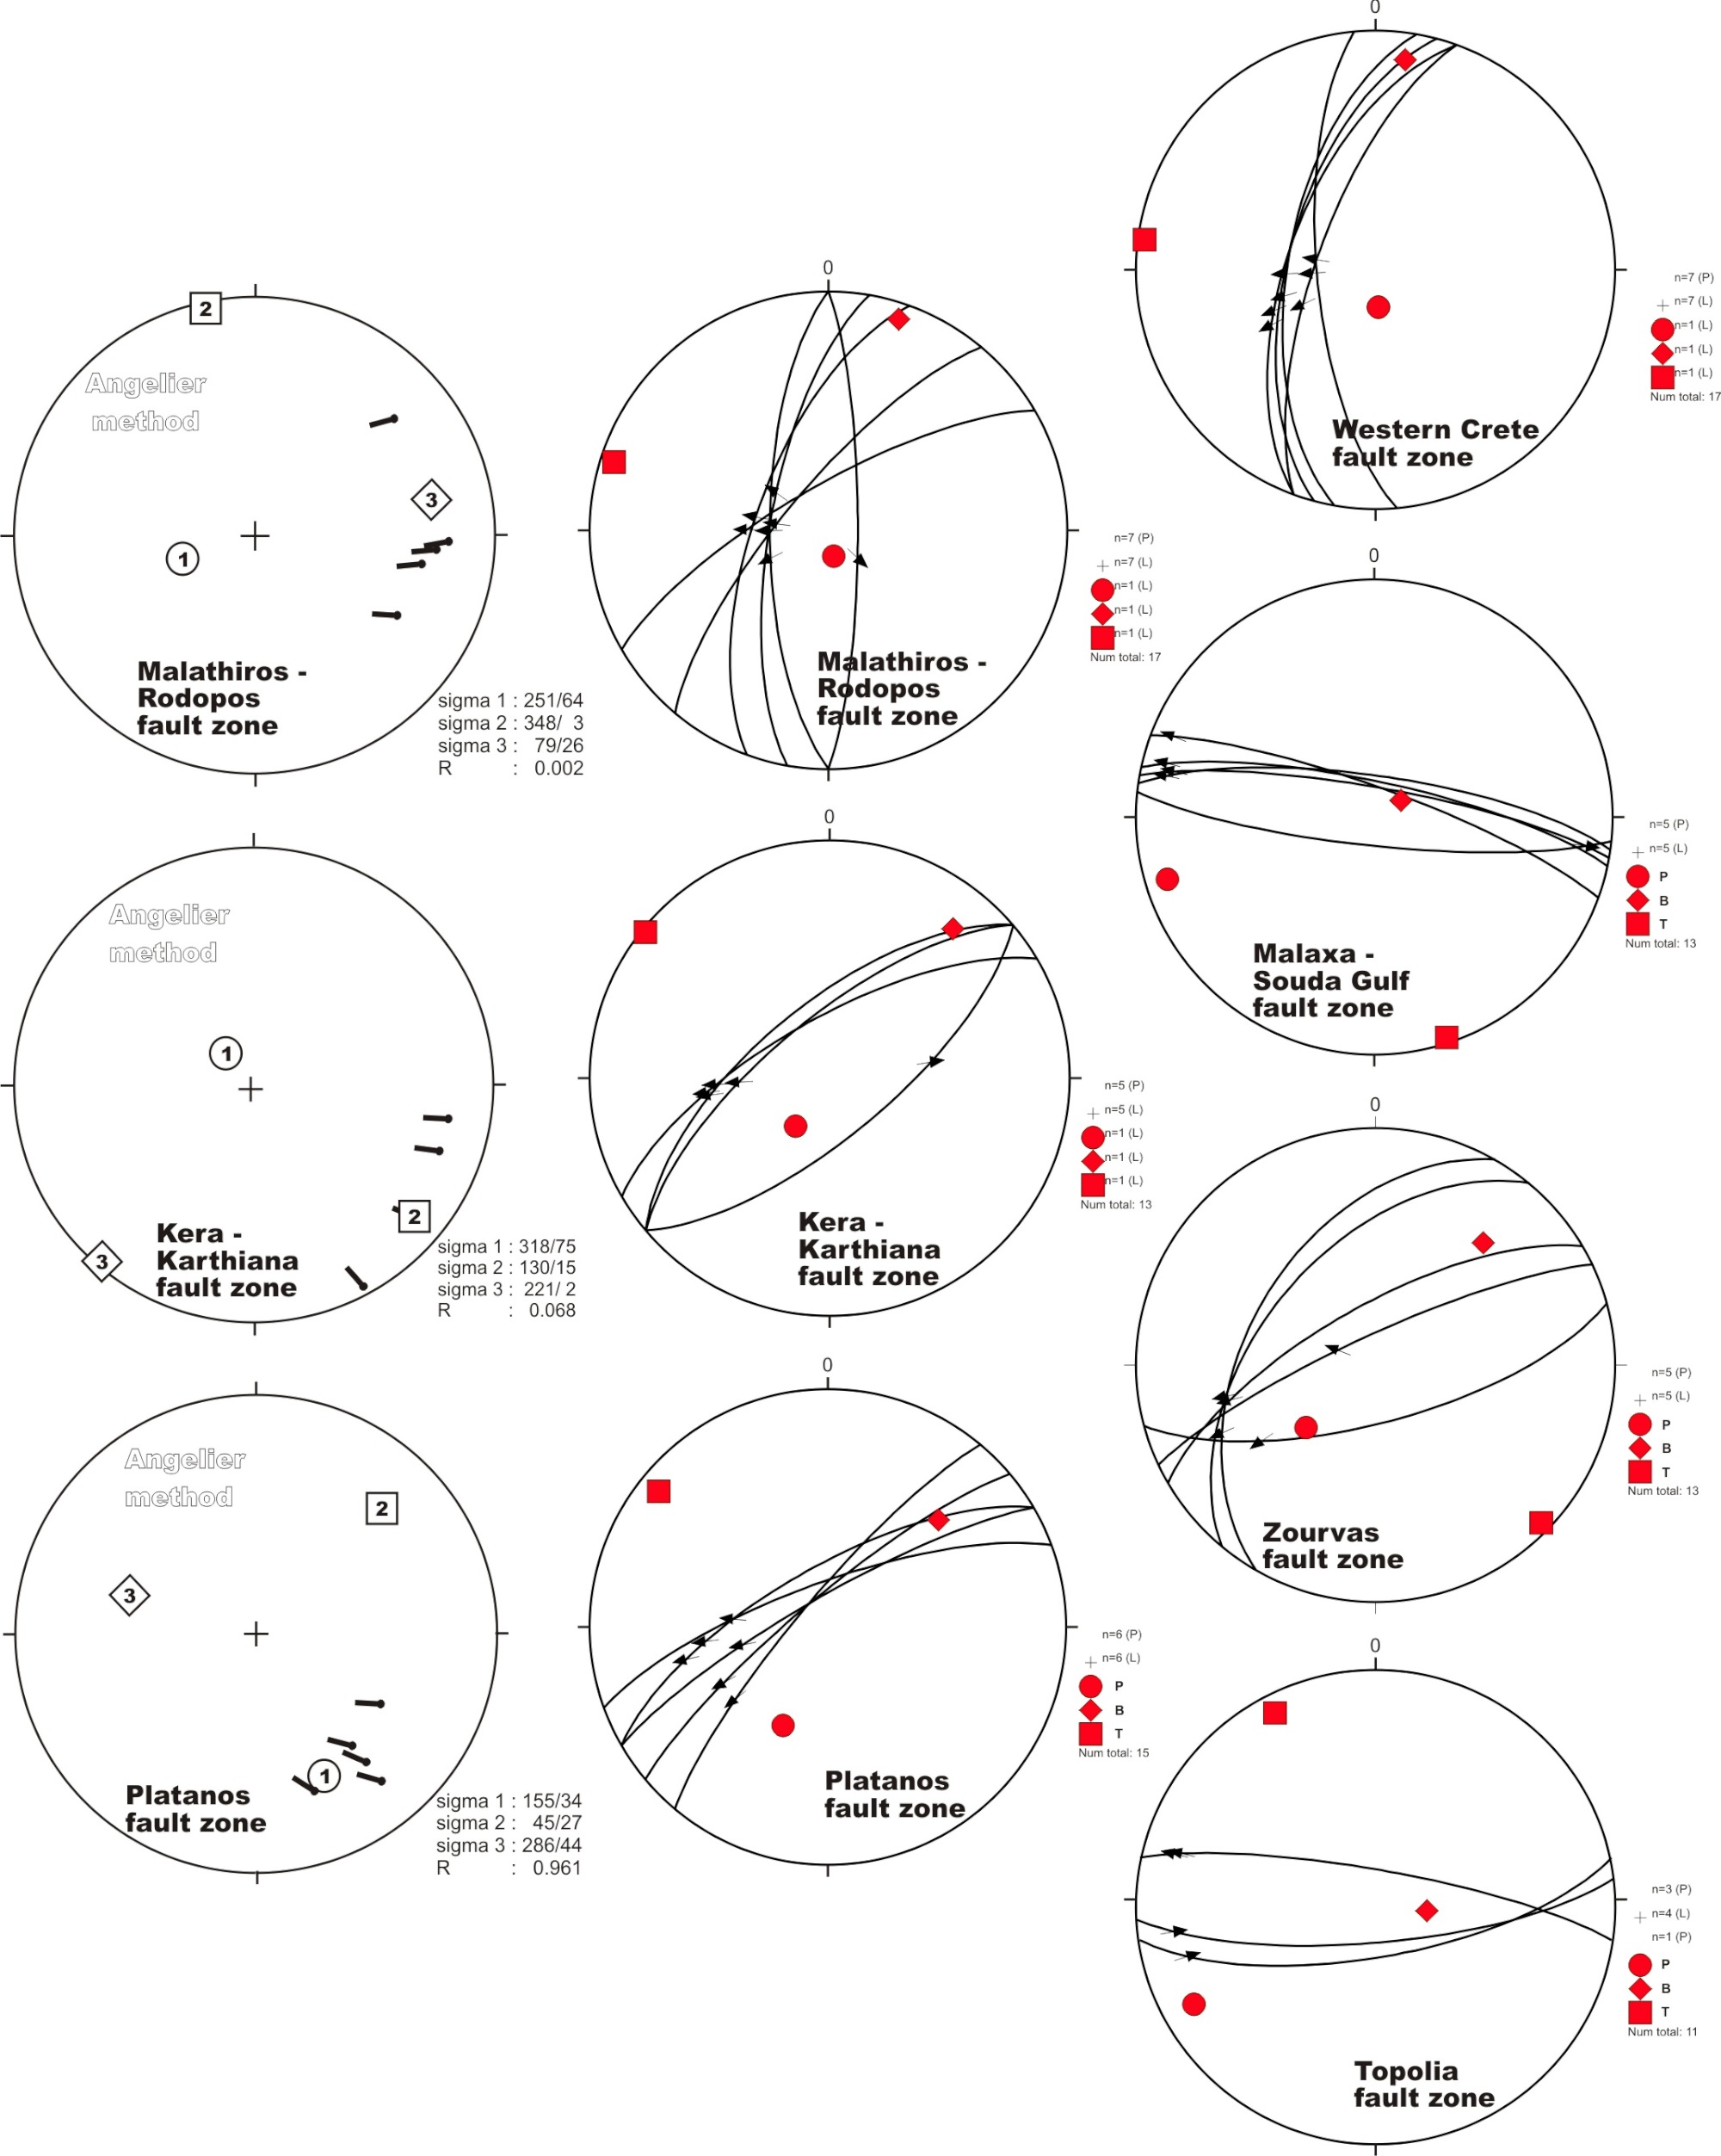
Figure 9. Representative paleostress diagrams of σ1>σ2>σ3 for the younger D2 tectonic event
(lower hemisphere projection) by Angelier 1979 and Angelier et al. 1982 inverse method and P-T method (Turner 1953) (see text for explanation).
The kinematic analysis of the D1 faults shows that they are normal faults with mostly normal dip-slip component. This is verified by the presence of high angle striations identified on the fault planes, dipping mostly towards the NNE to NNW. The NNW slip motion corresponds to the relatively younger slip motion associated with the D1 phase. Moreover, minor oblique normal faults trending NW-SE and NE-SW are also related to the D1 kinematics, showing significant sinistral or dextral horizontal component of motion, respectively. Paleostress analysis for the D1 event, using the inverse method of Angelier 1979, Angelier et al., 1982 and P-T method (Turner 1953), shows a low dipping angle minimum σ3-stress axis with a strike varying between NNE-SSW to NNW-SSE (fig. 8 & 9) for both methodes. The program Stereonett (Duyster 2000) has been used for graphical presentation of the structural data.
The second D2 tectonic event took place from Upper Pliocene up to present. Faults of this event overprint the previous D1 faults, affecting usually the cataclastic fabric along the D1 fault zones. Moreover, the D2 faults clearly affect the Pliocene sediments and have also been detected in recent Quaternary deposits (fig. 7). Faults related to the D2-event are mostly major faults of N-S strike, varying from NNW-SSE to NNE-SSW, with a dip direction mostly towards West. These normal faults exhibit a significant downwards dip-slip component of motion and striations dipping on the fault surfaces towards North or South in a high angle pitch (almost 75-85°). Moreover, faults of mainly NE-SW strike (occasionally also of NW-SE strike) are also closely related to the D2 kinematics. These are oblique-normal faults with significant sinistral or dextral horizontal component of motion. Some of these faults (mainly those of NE-SW strike) seem to form major transitional rupture zones between segments of the dominant N-S faults. However, older D1 striations are recognized on the fault surfaces of these D2 phase oblique-normal faults, revealing a possible reactivation during D2 tectonics, though they were initially created during the D1 event. The D2 kinematics are also often imprinted on the older E-W traced D1-faults by their reactivation as sinistral strike-slip faults. This pattern can be derived from the observation of horizontal striations on the fault surface, almost perpendicular to the older ca. dip-slip D1-striations.
Paleostress analysis for the D2 tectonic event using the methods of Angelier 1979, Angelier et al., 1982 and P-T method (Turner 1953) shows a sub-horizontal minimum σ3-stress axis, with strike ranging from WSW-ENE to WNW-ESE, with the second stress direction being the younger one. This pattern is in excellent agreement with the active stress field along a narrow zone lying between the external NW-SW compression (due to the Eastern Mediterranean subduction under the Aegean) and the inner, back-arc ~N-S extension (e.g. Papazachos et al., 1992, Papazachos and Kiratzi, 1996). This narrow zone extends all the way from the Albania-Greece border and the main body of the Hellenides mountain chain up to Peloponnesus, Crete and Rhodes, following the shape of the Hellenic arc. However, its exact spatial extent is not clearly defined, since it locally exhibits partial overlapping, especially with the N-S extension area, e.g. in western Macedonia and Epirus, (Mountrakis et al., 2006).
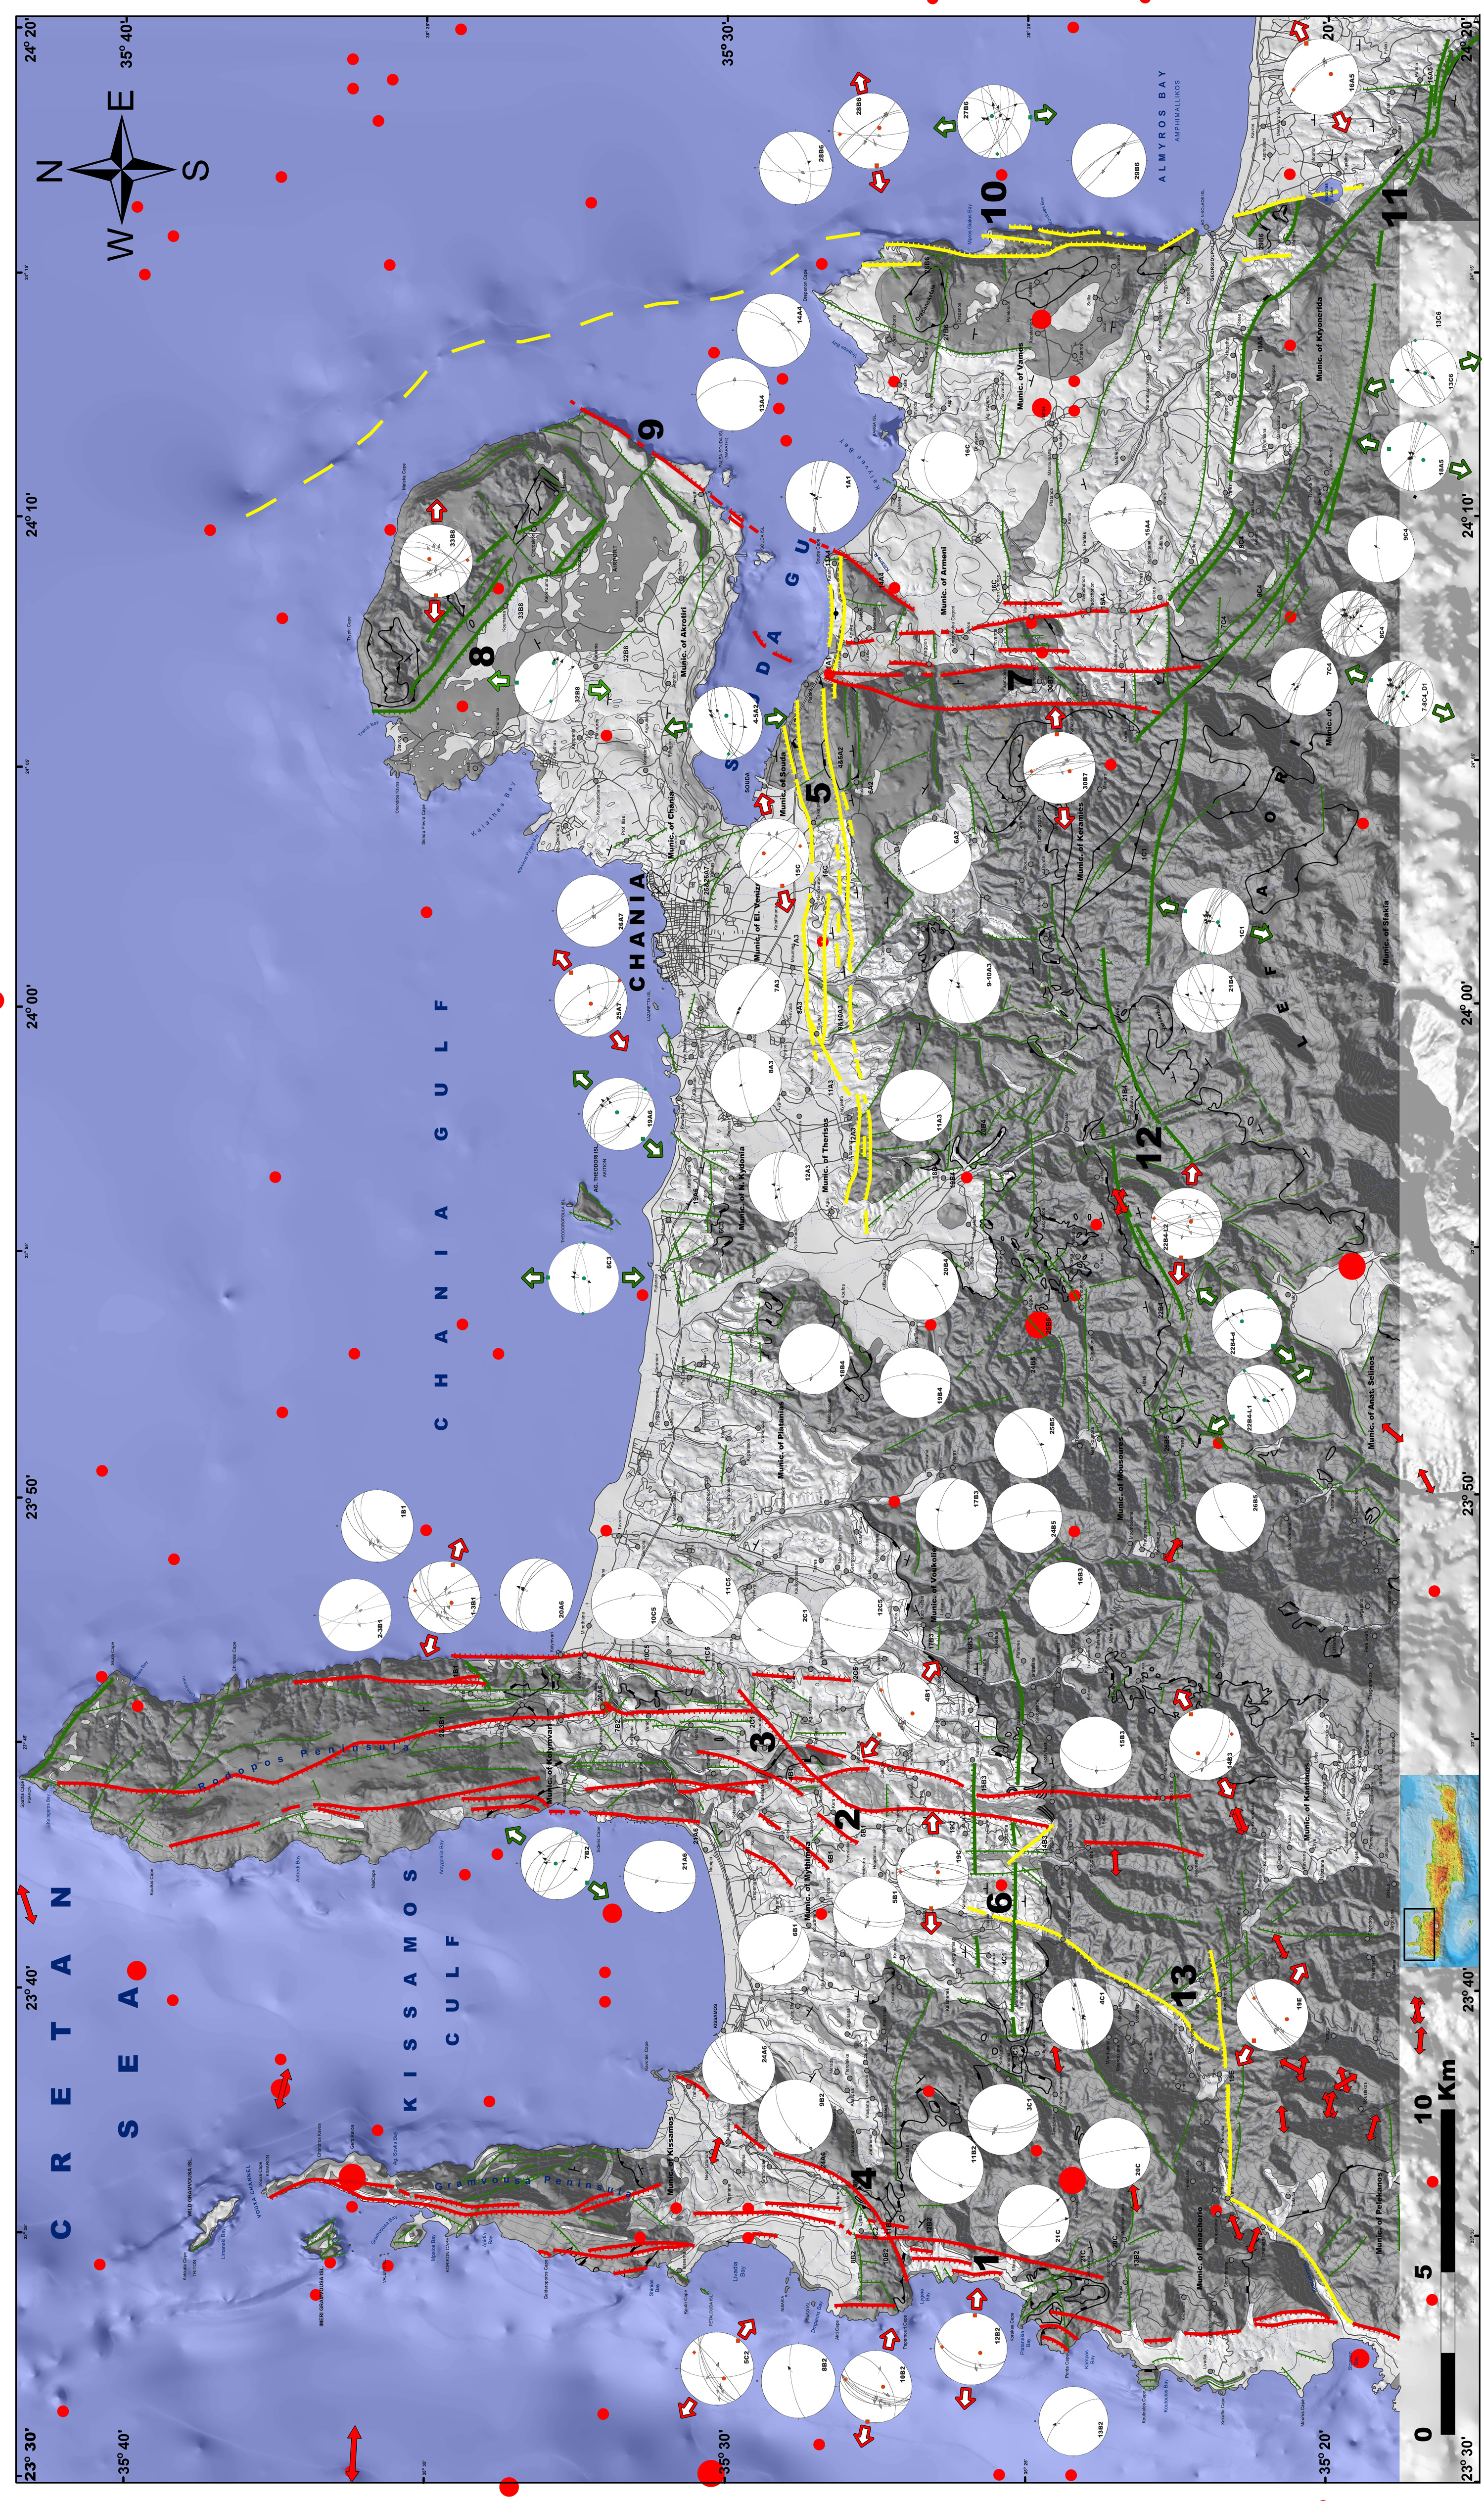
In order to explore the specific characteristics of the latest D2 phase observed in active faults and its spatial relation with the active stress field, we employed the available fault plane solution data for the study area. Our approach was realized in two steps. In the first step, all available fault plane solutions published for the broader study area were collected. The main data sources were Harvard, INGV and ETH, which publish solutions on a relatively regular basis for a large number of earthquakes (typically M > 4.5). Moreover fault plane solutions from a large number of publications (e.g. Lyon Caen 1988; Liotier 1989; Louvari, 2000) were also collected. In general, 3 main types of faults are recognized from the corresponding spatial distribution:
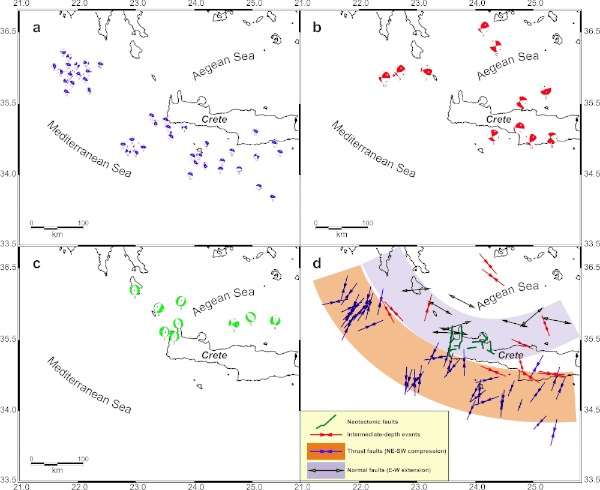
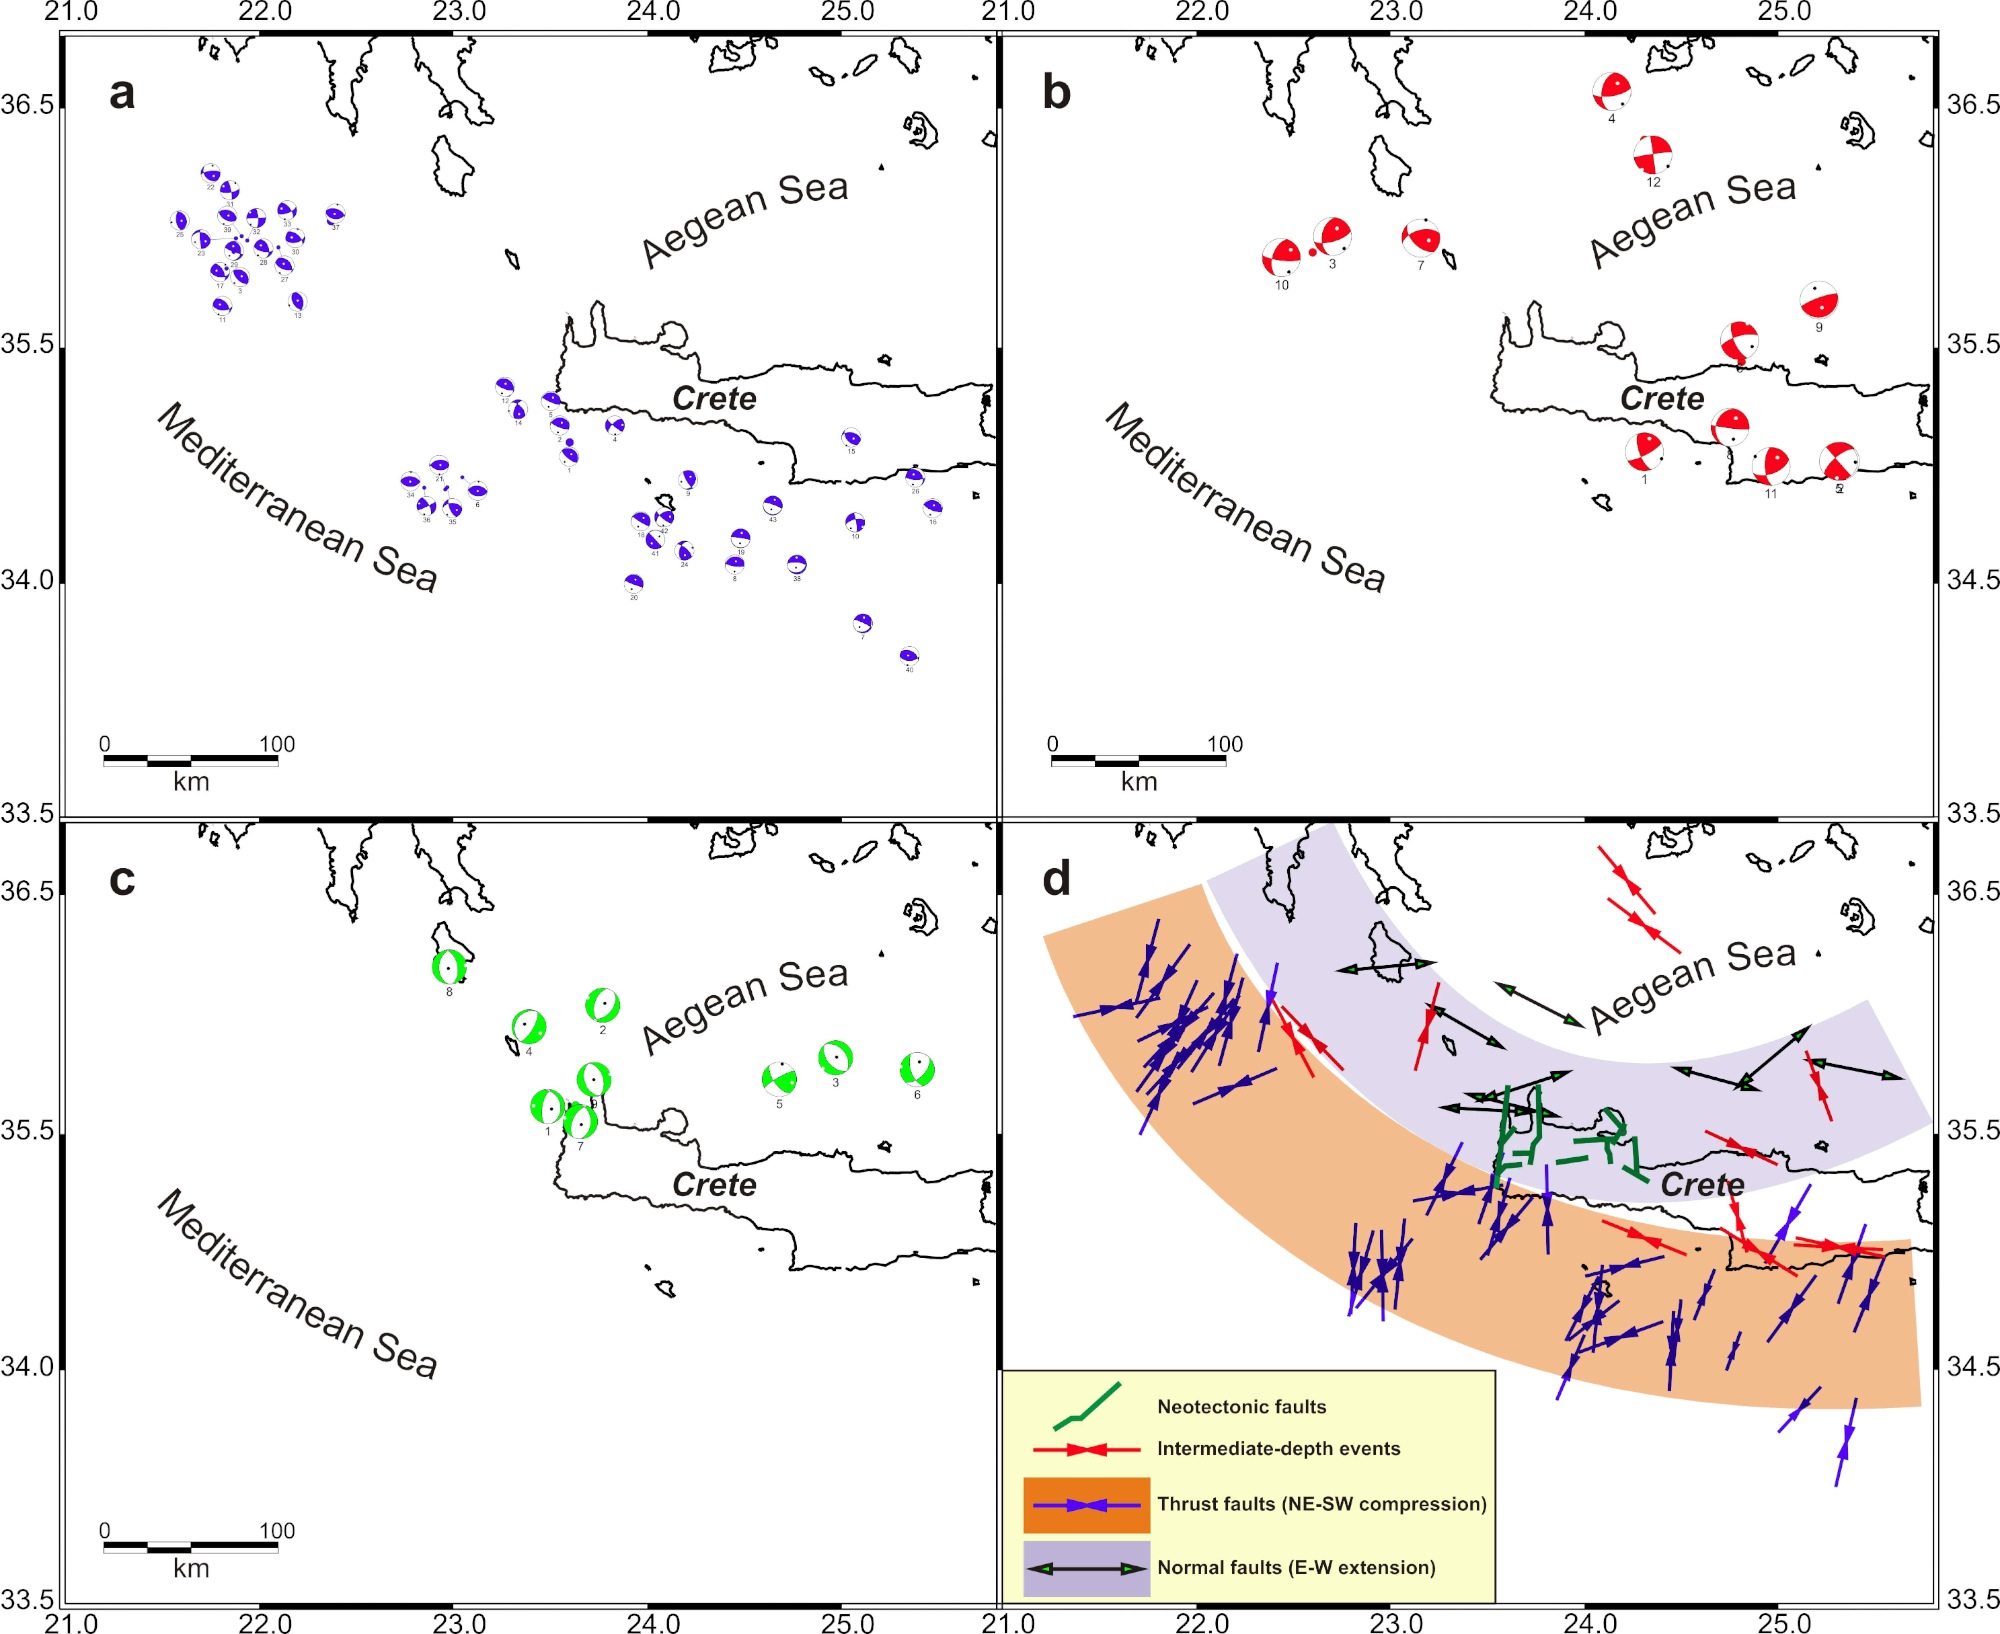
a) Thrust-type fault plane solutions (fig. 10a), with a dominant NW-SE direction, following the general local trend of the Hellenic arc. The corresponding earthquakes occur mostly in the Ionian Sea and the Mediterranean area, south of the coasts of Crete (e.g Elafonisos fault area-fig. 1), Kythira and Peloponnesus, with depths mainly in the range of 20-50km
Figure 10. Regional focal mechanisms in the broader SW Aegean area compiled from several published sources
a) Thrust-type events along the outer Hellenic-arc (blue arrows), b) Intermediate-depth strike-slip events (depths 50-120km) with significant thrust component (orange arrows), c) Normal-type events (black-green arrows), showing a dominant roughly N-S strike. d) Spatial distribution of the corresponding sub-horizontal (dip <30°) principal axes in the study area, showing the clear separation of the NW-SW compression area in the outer arc with the E-W extension area along the Kythira-NW Crete area. Intermediate-depth events exhibit a typical inslab-parallel compression. The 13 main faults mapped in this study are schematically depicted with green lines.
b) Strike-slip events with a significant thrust component (fig. 10b), corresponding to intermediate-depth events along the subducted Benioff zone, at depths gradually increasing from 50km (in the Crete-Kythira area) to ~100-120km in the southern Aegean volcanic arc region (fig. 1).
c) Normal-type events, with a roughly N-S direction (fig. 10c), which occur at shallow depths in the Kythira and NW Crete area, extending in the Cretan basin, just north of the Crete mainland.
Though, the determined fault plane solutions show local variability, the corresponding distribution of the sub-horizontal (dip <30°) principal stress axes shows a more consistent setting, presented in figure (10d). The distribution presented in this figure shows a clear separation of the outer-arc NE-SW compression from the E-W extension regime in the Kythira and NW Crete mainland. The last one is in very good agreement with the stress field of the previously presented D2 phase. In the same figure the traces of the 13 main faults identified in the present study (later presented in detail) are also schematically depicted.
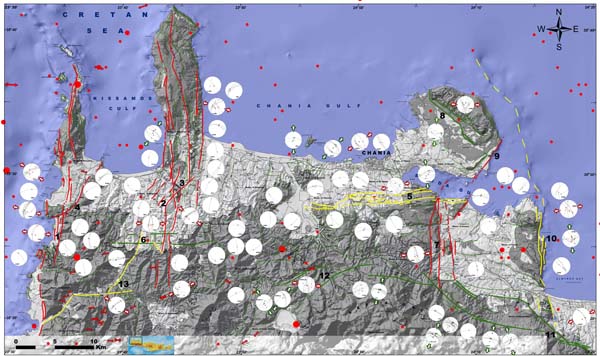
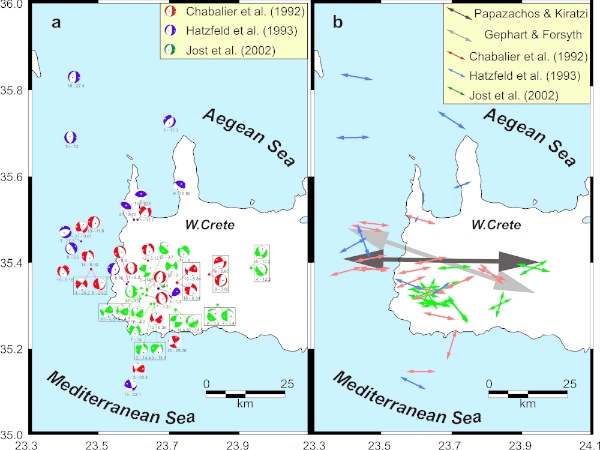
In order to further examine this issue, we have also collected additional fault plane solutions determined from local temporary networks installed in western Crete or the broader area (Besnard, 1991; Chabalier et al., 1992; Hatzfeld et al., 1993; Jost et al., 2002). The corresponding distribution (also solutions from the regional database of figure 10 for the study area) is presented in fig. (11a), including mainly small events with M in the range -0.2 to 3.8. Although, in a few cases alternative solutions are presented, the corresponding principal sub-horizontal (dip < 30°) extension axes distribution is quite consistent (fig. 11b), showing a dominant E-W extension. Using the resulting distribution, an average σ3 extension axis was determined using the stress-tensor inversion method of Gephart and Forsyth (1984) and the average moment-tensor method of Papazachos and Kiratzi (1992). These results, also presented in fig. (11b) with large arrows, verify: a) The presence of an active E-W to WNW-ESE extension in western Crete (compatible with the D2 phase recognized from active faulting) and, b) the spatial extent of the extension regime, which covers the whole western Crete mainland, showing that the E-W extension controls the upper crustal deformation pattern throughout the whole study area, as also depicted in fig. 10d.
Figure 11. Fault plane solutions and stress-axes from microseismicity in Western Crete
a) Fault plane solutions for small-magnitude events in Western Crete. b) Spatial distribution of the corresponding sub-horizontal (dip <30°) principal extension axes. The average stress, computed with the methods of Gephart and Forsyth (1984) and Papazachos and Kiratzi (1992), are also presented with large grey and black arrows respectively.