Interpretation
The common truncation of foliations preserved in porphyroblasts by S1 parallel to S0 in the matrix is interpreted to result from reactivation of the compositional layering decrenulating newly developing crenulation cleavages and rotating oblique relics of others into parallelism with the bedding. This phenomenon has been extensively documented and described by Bell et al. (2003, 2004) and Ham and Bell (2004).
Porphyroblast rotation or otherwise
A consistent succession of 4 FIA sets as shown in Fig. 12 would be impossible if the porphyroblasts had rotated. This is shown in Fig. 13. Set 1 FIA forms almost 45º from FIA set 2. If FIA set 2 formed by rotation of the porphyroblasts around an axis with this trend, FIA set 1 would have been rotated on a small circle by up to 90º (the maximum curvature of inclusion trails defining FIA set 2) as shown in Fig. 22a. FIA set 3 lies 80° from FIA set 1. An enormous spread of FIA set 1 data results when the spread of FIA 1 due to rotation about FIA 2 is in turn rotated about FIA 3 (Fig. 22b) by up to 135º (the maximum inclusion trail curvature about FIA3). If these axes were further rotated about FIA set 4, the spread of FIA trends would span the whole stereonet (Fig. 22c). The succession of FIA trends show in Fig. 11 indicates that this is not the case. Recent computer-modeling has revealed that non-rotation of competent prophyrobalsts is continuum mechanically possible (Fay et al. 2008, 2009) and simply depends on reproducing the deformation history environment in which porphyroblasts grow (Spiess and Bell 1996; Bell and Bruce,, 2007).
Figure 22. Lower hemisphere equal area projections of the mean FIA trends

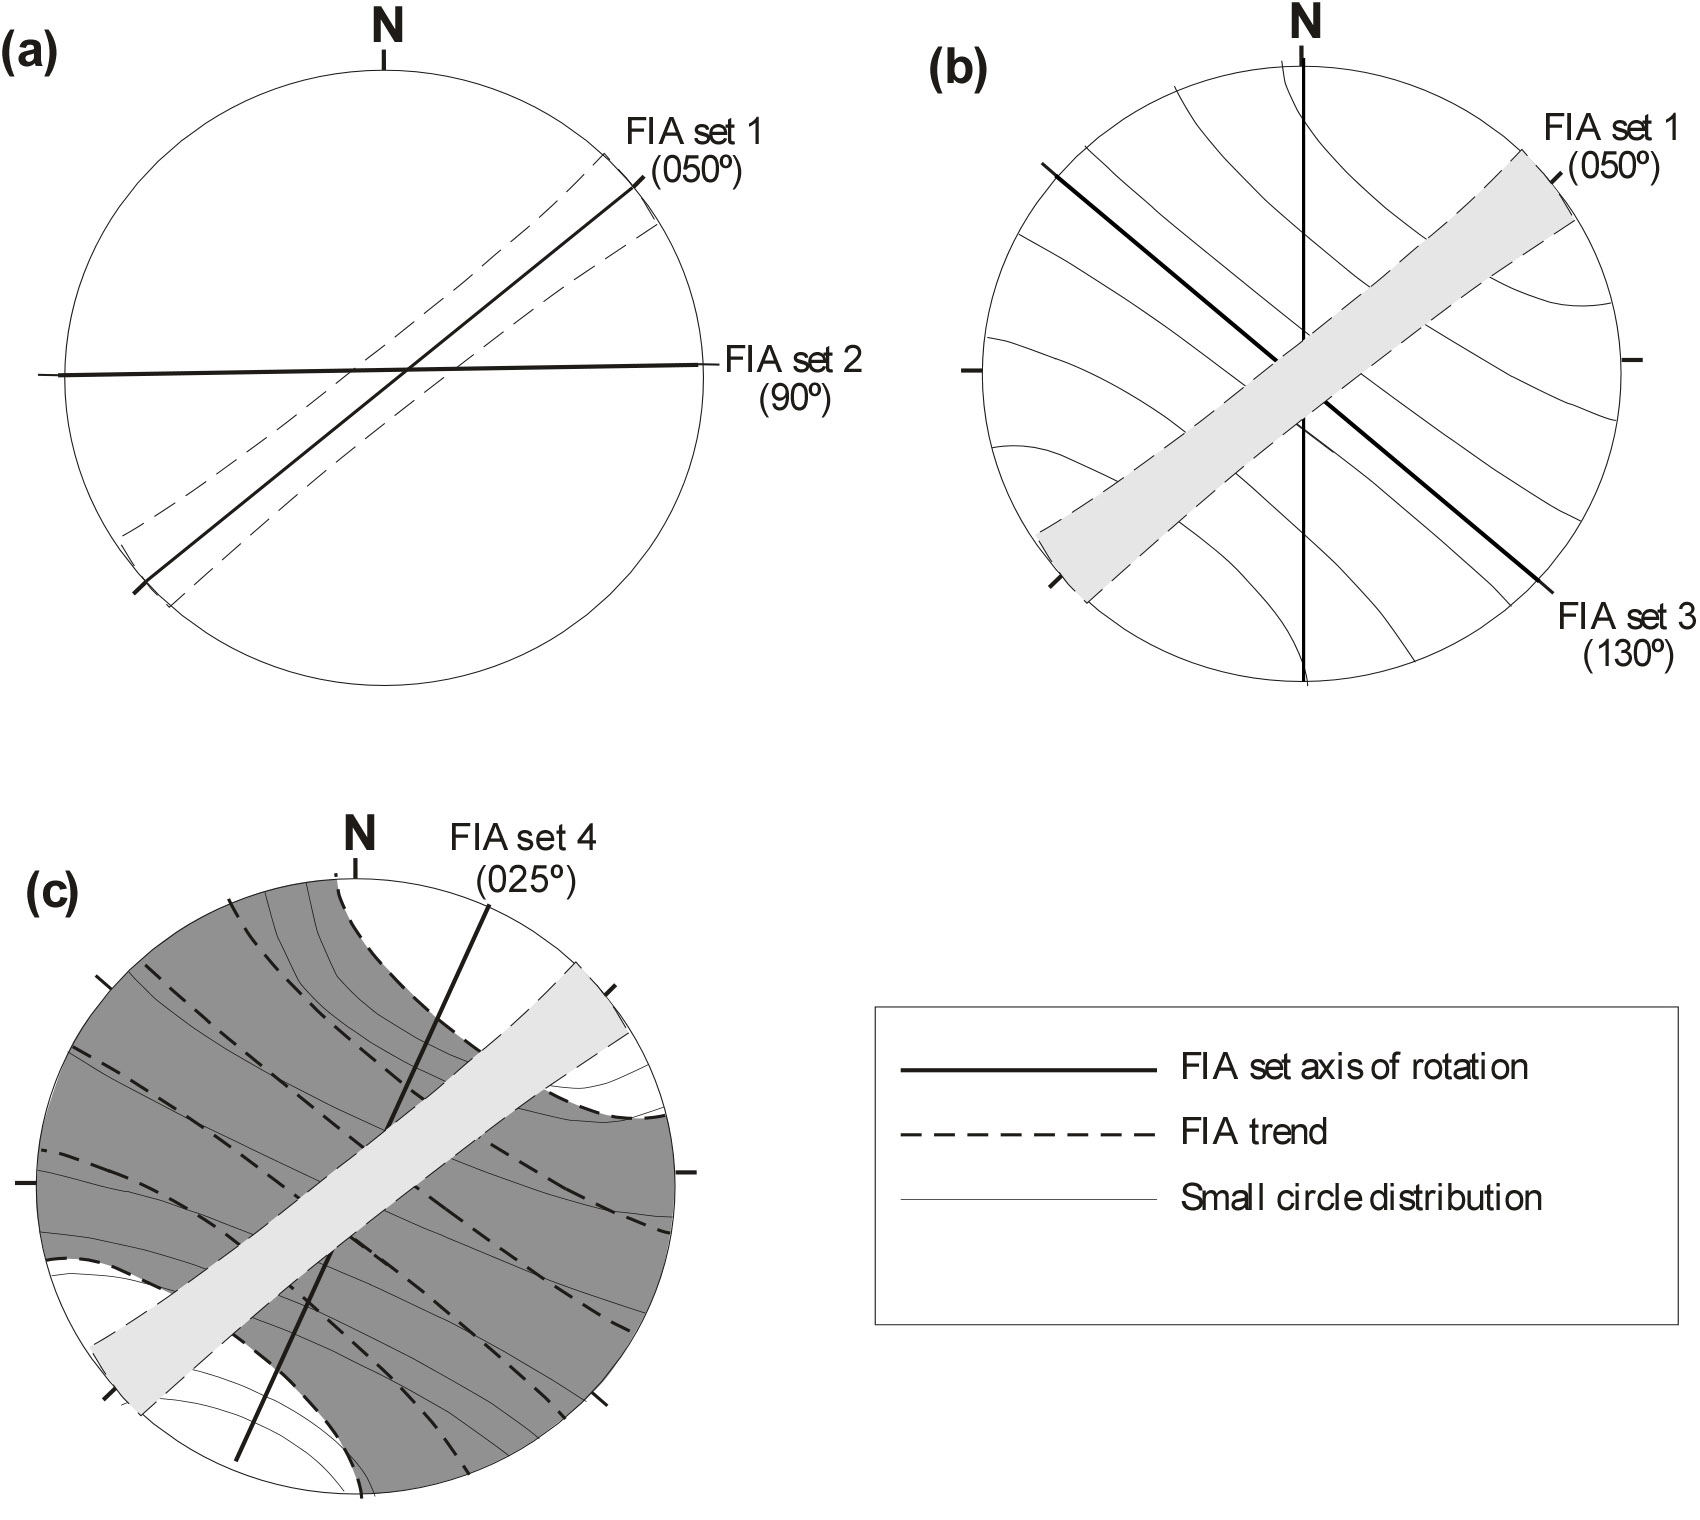
Lower hemisphere equal area projections of the mean FIA trends and their small circle rotation around overprinting FIA sets (rotation axes) to demonstrate the effect of flexural flow folding. When rotating around an axis and assuming that the FIA is preserved in perfectly spherical porphyroblast (similar to garnet), FIA can have trends anywhere along the small circle. Set 1 FIA forms almost 45º from FIA set 2. Presuming that the set 2 FIA formed from a mechanism of heterogeneous simple shear, it should have then rotated set 1 FIA about a small circle by 90º (maximum curvature of inclusion trails in FIA set 2) as shown in (a). Subsequently, set 3 FIA, lies roughly 40º from FIA set 2 and 80º from FIA set 1. An enormous spread of FIA data (b), results when further rotation of FIA set 1 around set 3 (maximum inclusion trail curvature ~135º). If rotated again during the FIA set 4, the spread of FIA trends would be infinite (c).
Isograd migration
The migration of the staurolite isograd eastwards from FIA 1 to FIA 4 (Figs. 18a, b, c and d) indicates that the source of heat for the metamorphism that generated this succession of events lay to the west. Each of the four periods of staurolite development involved more than one phase of growth. Most porphyroblasts contain a single FIA but some preserve an earlier formed differentiated crenulation cleavage from which a pseudo-FIA (that predates porphyroblast growth) could be measured (Figs. 8 and 9). Consequently, these rocks record evidence more than 4 phases of staurolite growth that could not have been distinguished without the FIA data preserved by their inclusion trails. The andalusite and cordierite isograds for FIAs 3 and 4 (Fig. 19a and b) rotate clockwise as they migrate eastwards similar to the staurolite isograds, suggesting that they were a product of migration of the heat source from WNW to ENE with time.
Rare matrix overprinting cordierite, andalusite and fibrolitic sillimanite
The samples (± fibrolitic sillimanite) containing rare cordierite or andalusite porphyroblasts incorporating matrix foliation without any deflection of inclusion trails suggest isograds forming at ~90° to those for which FIAs could be measured as shown in Fig. 19c,d. They suggest that growth of these 3 late phases resulted from a different heat source, possibly associated with pegmatite in the SW corner of Figs 2 & 3.
Foliation trend and Heat Flux
Figures 2 and 3 show that no granite is present on the WNW side of the isograds. Figures 18 and 19a, b reveal that the staurolite, cordierite and andalusite isograds migrated eastwards at a high angle to S0,1 with the clockwise shift of the trend of FIAs 1, 2, 3 and 4. This suggests that heat flux through rock was controlled by the orientation of S0,1 rather than the FIA trend; the latter is controlled by the concurrently developing sub-vertical foliation. That is, reactivation of the heterogeneity provide by S0,1 provided a faster pathway for heat than a newly developing cleavage. This also accords with ENE migration of a heat source that lay to the WSW during orogenesis. The most recently formed sillimanite, andalusite and cordierite isograds (Fig. 19c, d) lie roughly parallel to each other and the distribution of the ~1400 Ma granitoid plutons to the SW but orthogonal to isograds defined by FIAs.
Relationship between FIA trends and axial traces of folds
Comparison of Fig. 21a and b shows a strong correlation between the distribution of FIA trends and the axial trace of all folds present in the area. The four different peaks in the trends of axial traces exactly match the four FIA trends. Bell et al. (2004) and Bell and Newman (2006) argue that FIAs forming perpendicular to bulk shortening directions and successions of FIAs record changes in this direction that occurred during orogenesis. Folds are a product of the same process but are expected to be rotated with time by the overprinting effects of successive deformation in contrast with the FIAs, which are unaffected by subsequent ductile deformation (e.g. Bell et al. 1995; Fay et al. 2008). The correlation of fold axial traces with the FIA trends recorded here is, therefore, quite remarkable. It suggests that pockets of low strain occur due to deformation partitioning, in spite of, or perhaps because of, the 4 successive changes in bulk shortening direction. These pockets preserve folds in the orientation in which they formed from subsequent rotation or destruction. They provide remarkable confirmation of the veracity of the FIA data and indeed reveal that such data can be used to determine successions of fold development from regional maps at which scale many overprinting criteria cannot be applied (e.g., Abu Sharib and Bell 2011; Bell and Sanislav 2011.