Axial plane trends of regional folds
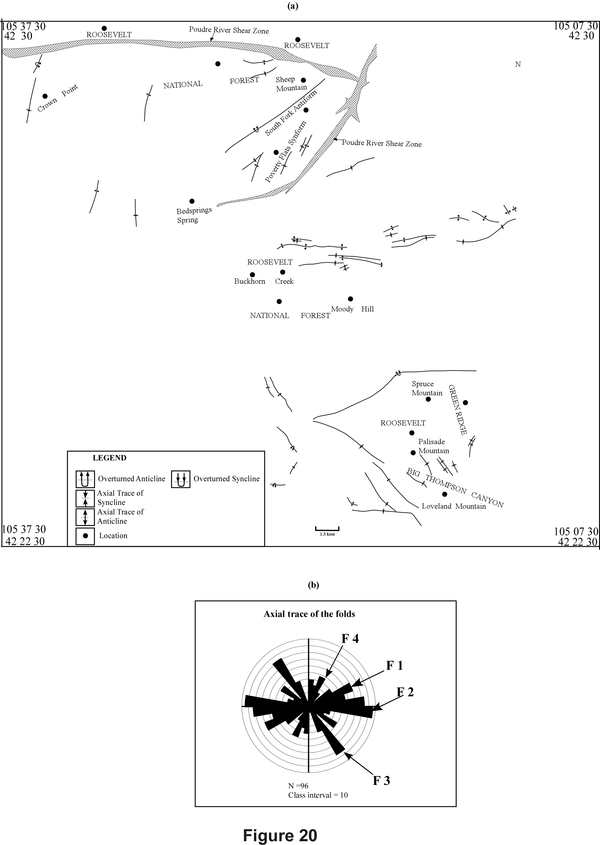
The axial traces of all folds present in the area were measured from regional geological maps (Fig. 20a). They were then plotted on a rose diagram as shown in Fig. 20b. Note the similarity between this figure and that containing the FIA trends (Fig. 21).
Figure 20. Location of all regional folds
Shows locations of different folds in the Big Thompson region and adjacent area of Colorado, Rockies. All mapped axial traces of various folds were measured from the geological maps and plotted on the rose diagram as shown in (b).
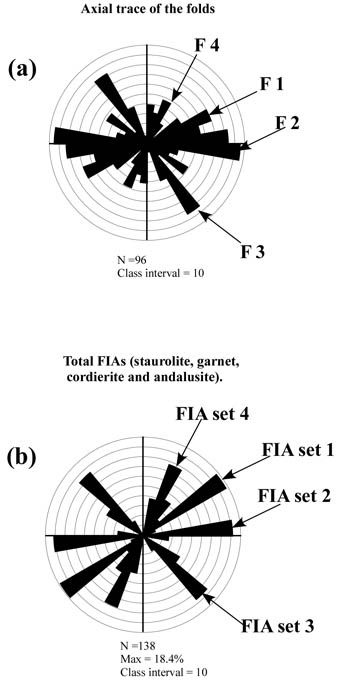
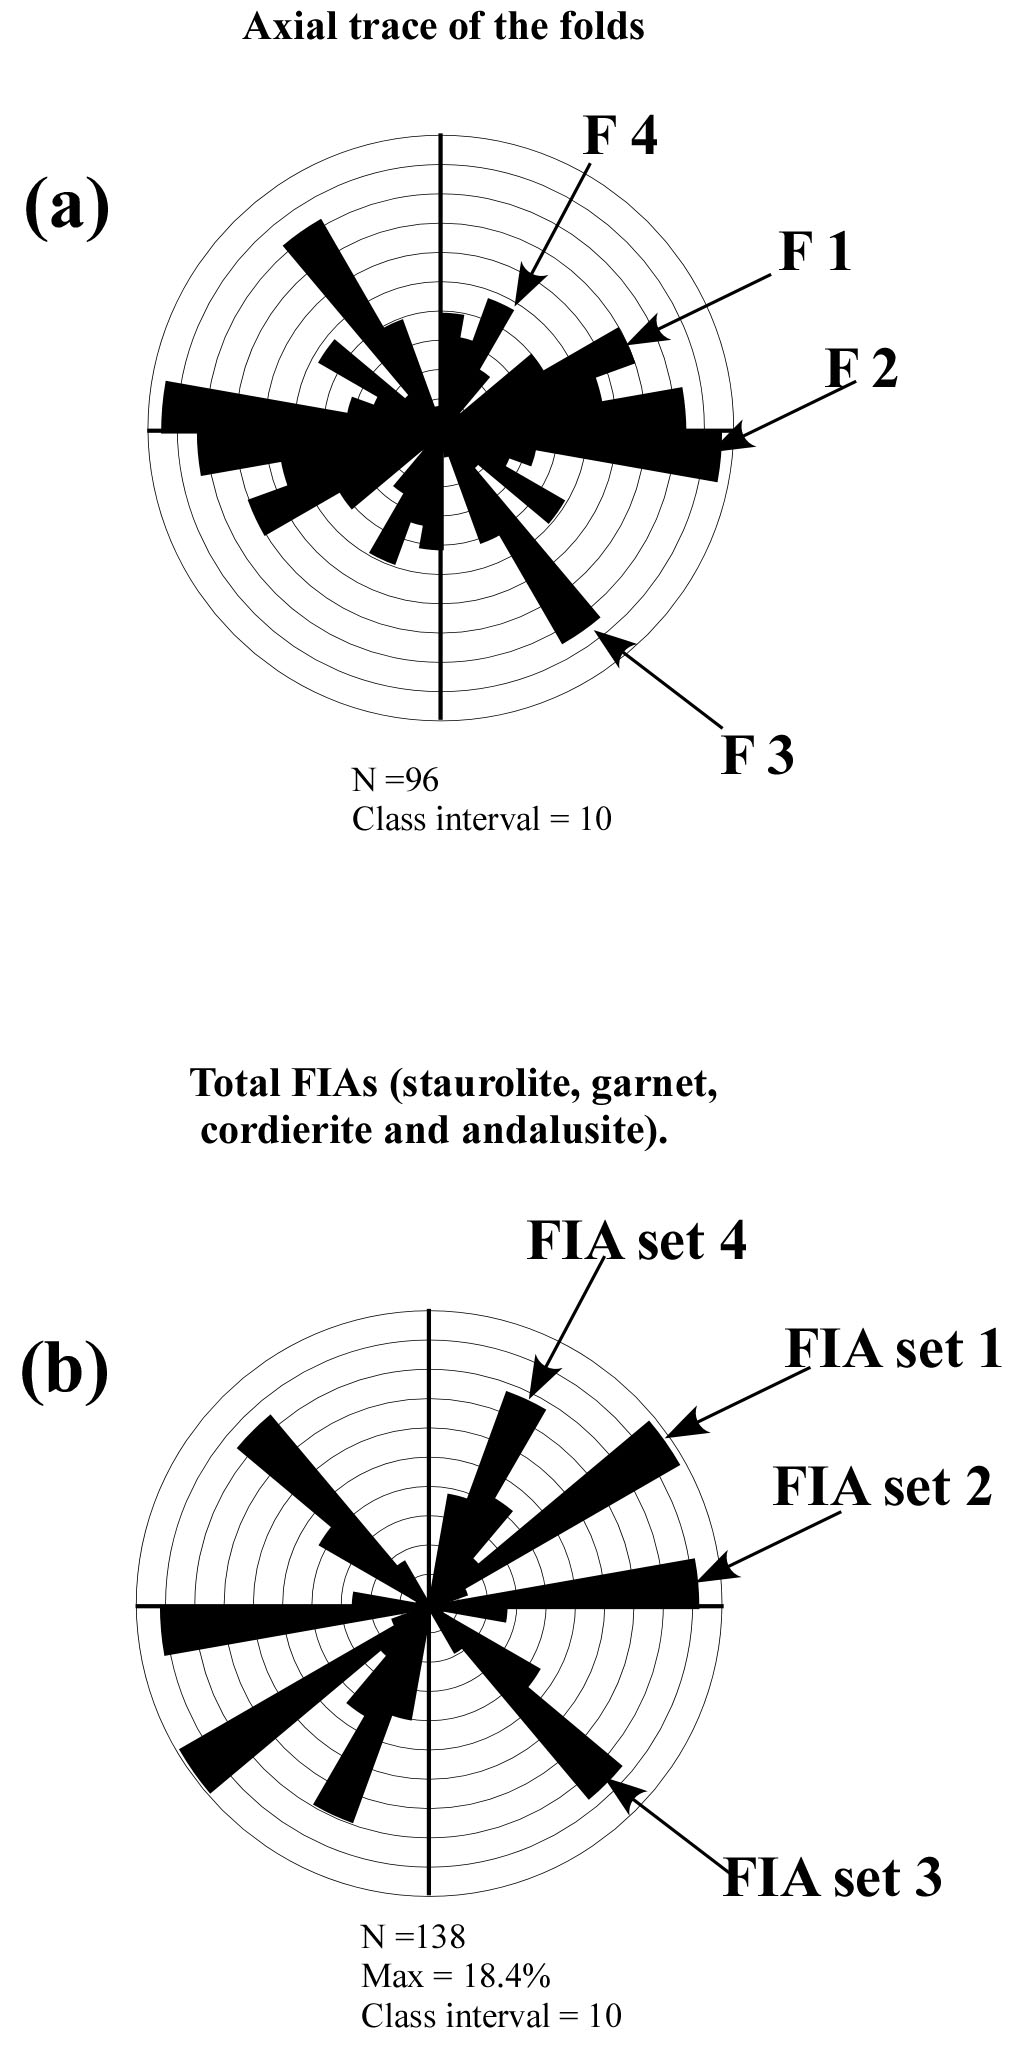
Figure 21. Rose plot of FIA trends and fold axial traces
In (a) equal area rose plots of all the FIA trends measured from four major porphyroblastic phases (garnet, staurolite, andalusite and cordierite) are shown. (b), Shows a plot of fold axial traces. The four different peaks in the trends of axial traces exactly match the four FIA trends. Bell et al. (2004) and Bell and Newman (2006) argue that FIAs forming perpendicular to bulk shortening directions and successions of FIAs record changes in this direction that occurred during orogenesis (see text for details).