Seismicity and gravity Bouguer anomalies
The Bouguer anomaly map (Figure 6, from the gravity data of the National Geological Survey, M.G. Ciaccio, written communication) reveals strong variations in the northern central Apennines. Some main features can be recognized:
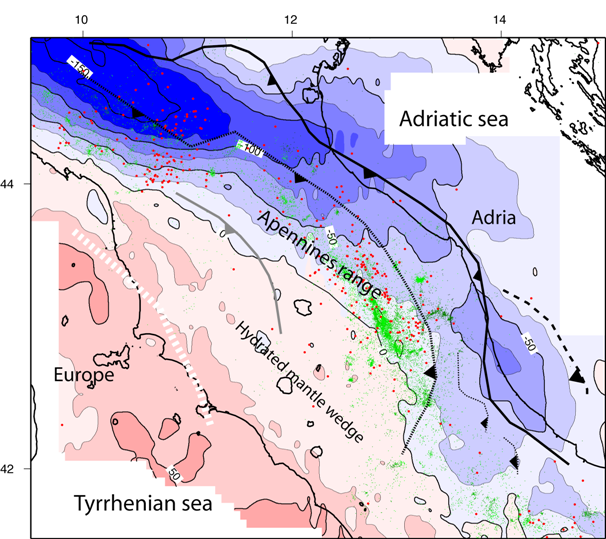
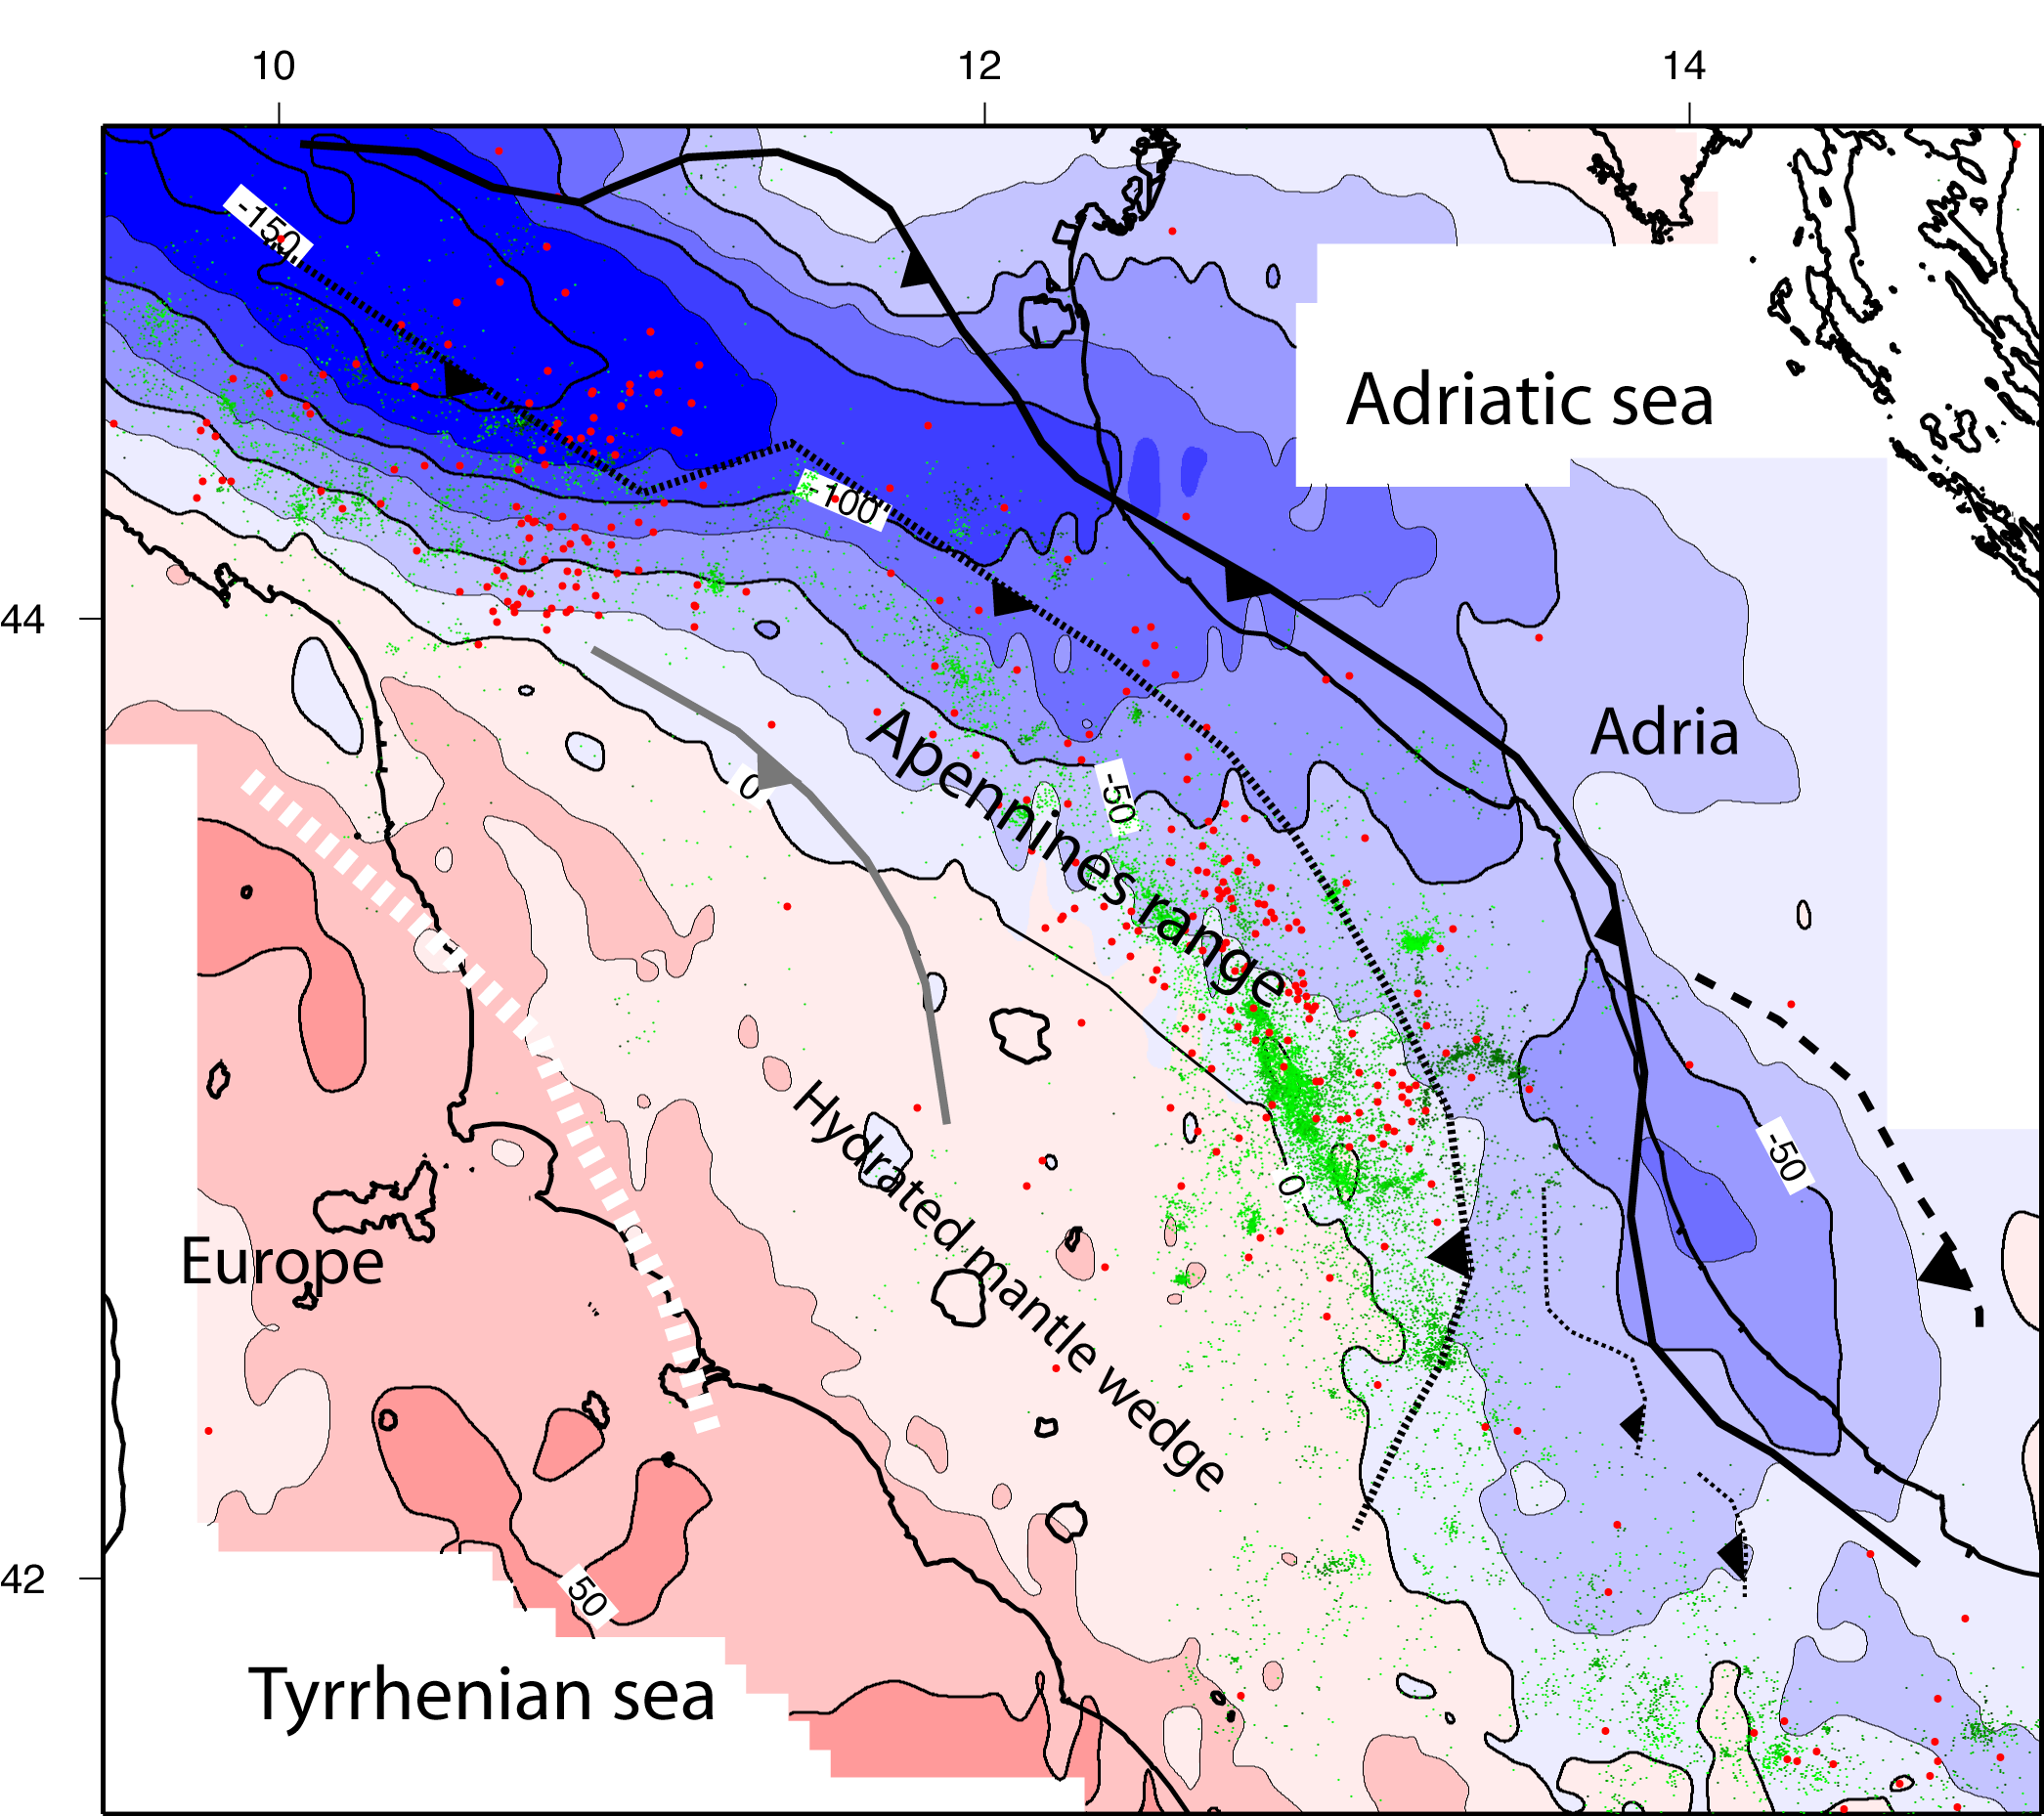
Figure 6. Bouguer anomalies and seismicity.
Bouguer anomaly map (data from the Geological Survey and elaborated by M.G. Ciaccio) and seismicity in the study area (CSI catalogue). Light to dark green dots are crustal earthquakes, with progressive greater depth; red dots are the intermediate-depth earthquakes. The main tectonic lines are shown, the dashed line is the outer fron from Scrocca (2006).
i) Lightly positive anomalies underneath the Tyrrhenian domain (20-40 mgal) consistent with the crustal thinning at the back of the Apennines wedge (see also Makris et al., 1988; Caratori Tontini et al., 2007). In the northern Tyrrhenian region, the gravity high is relatively small, suggesting that continental thinning did not lead to the break of the continental plate and oceanic opening, opposite to the southern Tyrrhenian region, where the ocean opening was triggered by the fast retreat of the Ionian slab (see Kastens et al., 1986; Chiarabba et al., 2008 and references therein).
ii) A diffuse area of relatively null anomalies from the belt axis to the Tyrrhenian margin (inland area). Since receiver function studies do not indicate a significant variation of crustal thickness between the Tyrrhenian Sea and the inland area (Piana et al., 2002; Mele et al., 2003; Di Bona et al., 2008; Piana and Amato, 2009), we argue that the minor gravity anomaly observed in the inland, thinned lithosphere might result from a low density in the uppermost mantle.
iii) Negative anomalies along the north-eastern part of the Apennines, consistent with a broad deflection of Adria beneath the Apennines (Royden et al., 1987). In the northern area, deep focus earthquakes occur within the strongly negative anomaly area (-150 mgal, see figure 3) suggesting the existence of a very thickened crust - a consequence of the continental collision. In the Umbria-Marche section of the Apennines, deep focus earthquakes occur in regions with null gravity anomaly, while the strongest negative values are observed more to the east, along the Adriatic coast and coincide with thick fore-deep basins. In the Abruzzi area, a diffuse negative anomaly is present (see also Tiberti et al., 2005). Since extremely high vp anomalies are observed in the shallow crust (figure 3, layer 8 km), we argue that the main cause of this negative Bouguer anomaly is a deep low-density body.
Seismotectonics of northern-central Apennines
Seismicity, tomographic results, gravimetric anomalies and geophysical data outline four main deep features that are significant in understanding the evolution of the Apennines:
a) The broad low vp, low-density anomaly in the Tyrrhenian inland uppermost mantle. In this inland area, local earthquake tomography (figure 2), Pn-wave modelling (Mele et al. 1996) and Bouguer anomalies revealed the existence of low P-wave velocity and low-density anomalies in the uppermost mantle. Recently, Piccinini et al. (2010) found a high attenuation of P and S waves for teleseismic events sampling this mantle volume, and interpreted this anomaly as due to a strong hydration of the Tyrrhenian mantle at temperature lower the near-solidus condition. All this evidence, along with the concomitant presence of trench parallel fast axes, point to the existence of a serpentinized mantle wedge. In the case of B-type olivine, i.e., fluid enriched mantle, the fast axes of anisotropy align perpendicular to the plate motion (Jung and Karato, 2001; Long and Van der Hilst, 2006; Kneller et al., 2008), as observed in subduction zones worldwide (Russo and Silver, 1994). The amount of splitting is consistent with a ten of kilometres thick serpentine layer and does not require a thicker anisotropic mantle, as in the case of A-type olivine. The lower temperature near the solidus condition indicates the mantle wedge is cold and not significantly melted, but warm enough to prevent significant magnetic anomalies typical of serpentinized mantle.
b) The outer ring of low vp anomalies. Di Stefano et al. (2009) interpreted this feature as crustal material down-dragged in the subduction of Adria beneath the Apennines. Intermediate-depth earthquakes indicate that the thickness of this crustal layer is of about 10 km (figure 7), much thinner than the extent of the low velocity anomaly. A high-resolution velocity model recently obtained for the area (Chiarabba et al., 2009a) shows low velocity anomalies located above the west-dipping seismic plane (see section in the lower panel of figure 7) and supports the explanation of part of this anomaly as a "bob-up" wedge nose, i.e. the easternmost advanced portion of the Tyrrhenian hydrated mantle, a seismic signature of the asthenospheric nose described by Cavinato and De Celles (1999).
c) Low vp spots in the Apennines lower crust. These anomalies are distributed widely beneath the Apennines range, just underneath the extensional seismic belt. We hypothesize that the major contribution to the lowering of P-wave velocity is given by super-critical CO2 filled volumes stocked in the middle-lower crust. In support of this hypothesis, Chiodini et al. (2000; 2004) showed a close relationship between seismicity and the very high CO2 flux observed in the Apennines. Velocity reductions in the middle-lower crust are also interpreted as CO2 filled volumes underneath the thrust stack units (Chiarabba et al., 2009a). The location of these fluid-filled volumes just underneath the normal faulting belt suggests an active role of fluids in promoting seismicity in the Apennines. We hypothesize that the fluids temporarily stocked in the crust are those coming from the strongly hydrated Tyrrhenian mantle.
d) Extensive high vp bodies in the crust. Underneath the Apennines belt, several high vp bodies are evident in the crust, especially in the Abruzzi region (figure 5). Although the origin of such bodies is highly debated (see Chiarabba and Amato, 1997; Chiarabba et al., 2010), they might define basement rocks ripped by the compressional tectonics and stack in the belt. The extremely high P-wave velocities, of about 6.7-7.0 km/s, are more compatible with a mafic basement.
To better visualize the structure of the Apennines, we show vertical sections of seismicity and P-wave velocity across the belt (Figures 7 and 8 for the Umbria-Marche and Latium-Abruzzi regions, respectively). The general feature emerging from tomograms is that the compressive features developed during the wedge accretion dominate the deep structure. At a broad scale, the architecture of the belt consists of deep thrusts that stack composite piles of sedimentary and, probably, basement rocks. The warping and trend of the 7.0 km/s iso-velocity line describe the geometry of the deep crust material stack in the Apennines wedge. If we accept the interpretation of the high velocity anomalies as basement rocks, this isoline maps the top of the basement involved in thrust tectonics.
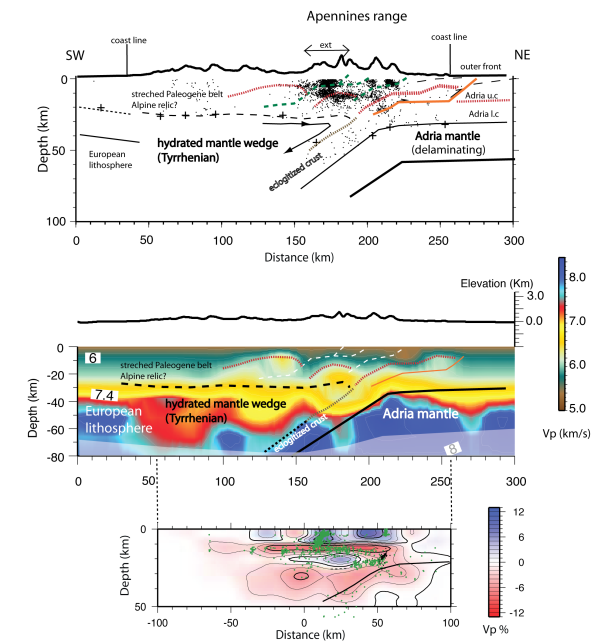
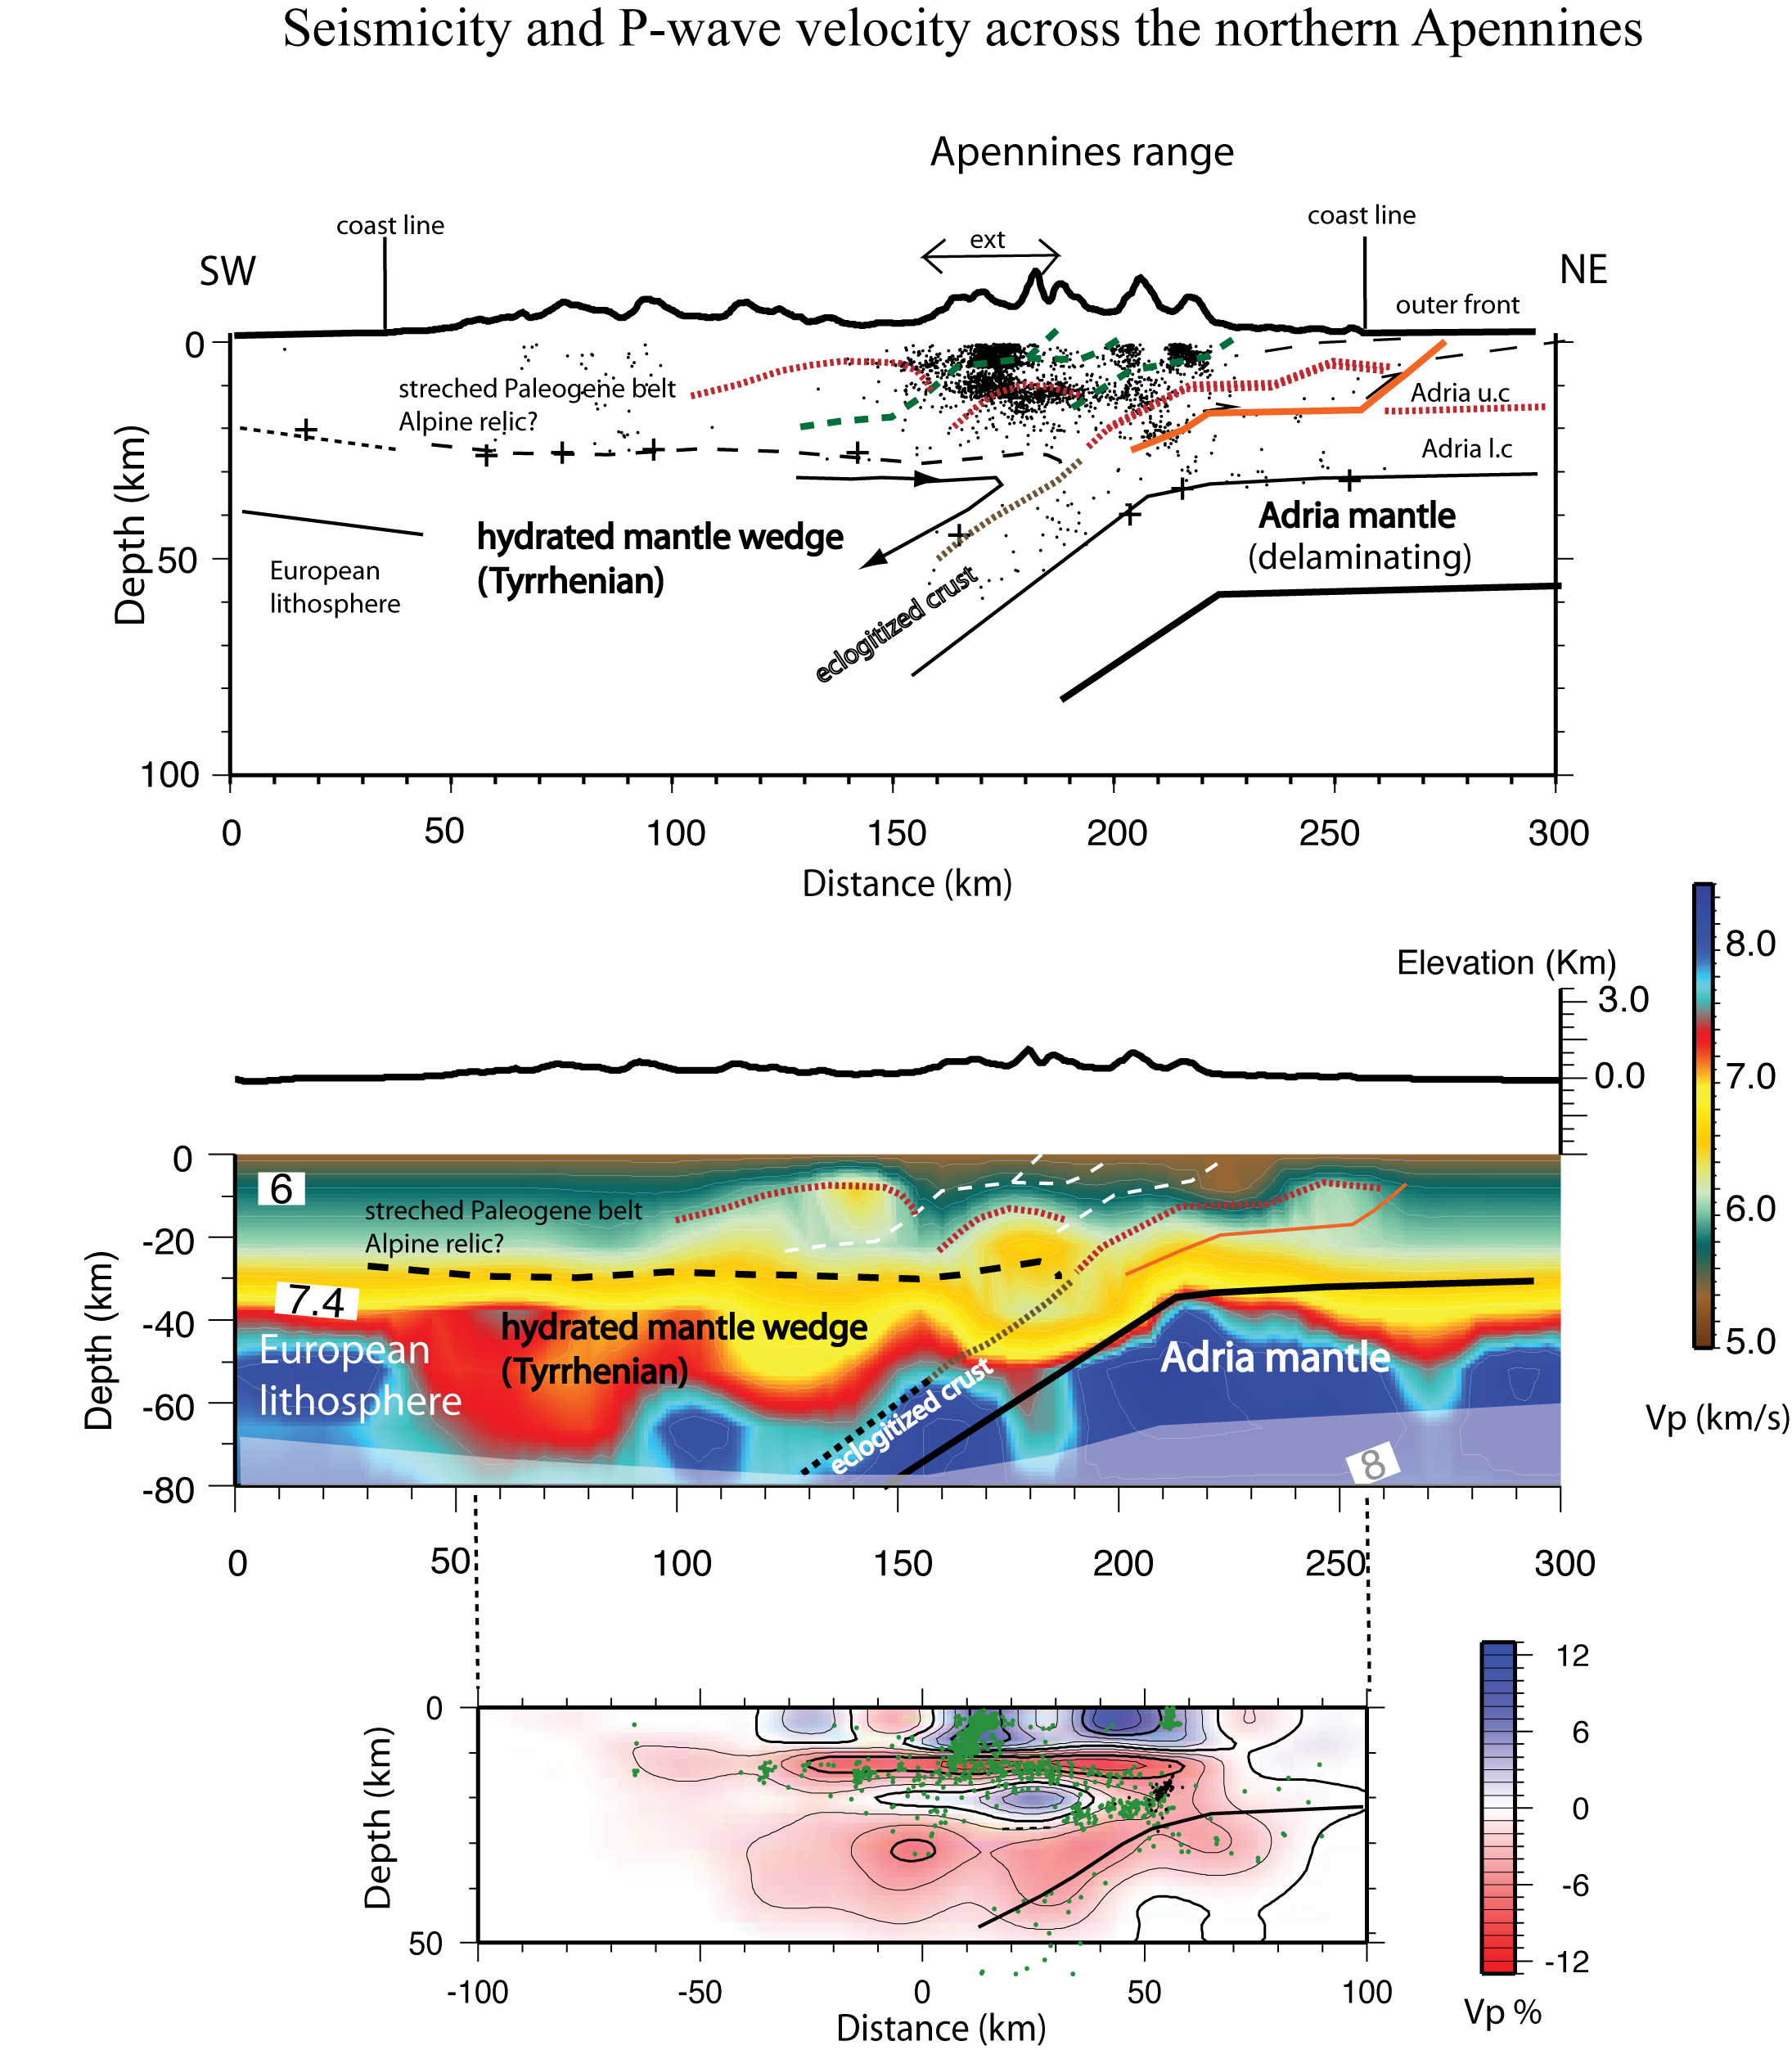
Figure 7. Seismicity and P-wave velocity across the northern Apennines.
Vertical sections of seismicity (top panel), P-wave velocity from Di Stefano et al. (2009, middle panel) and P-wave perturbations from Chiarabba et al. (2009a, lower panel) across the northern Apennines (see the track in Figure 1). The dashed area in the tomographic model is poorly resolved. The crosses are the Moho depth from Piana and Amato (2009). The bold and dashed black lines are the Adria and Tyrrhenian Moho discontinuities, respectively. The geometry of the deep units, drawn in the tomographic panel, are reported in the upper panel on the seismicity and interpreted. In the lower panel, the green dots are the 3D located seismicity (from Chiarabba et al., 2009a), while the black dots are the earthquakes during the January 2010 sequence, delineating a steep SW-dipping ramp.
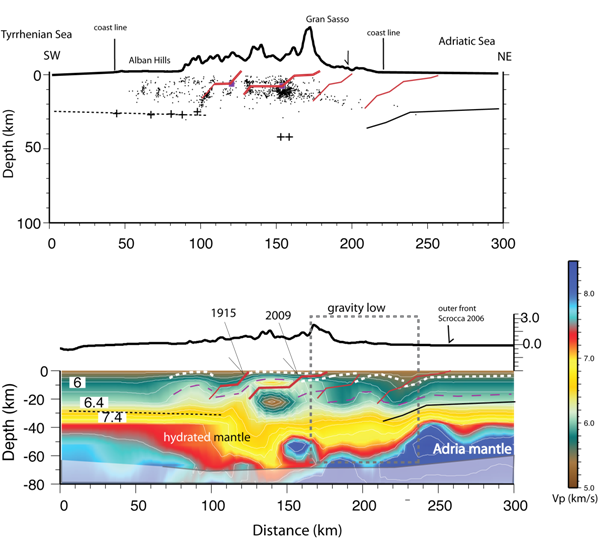
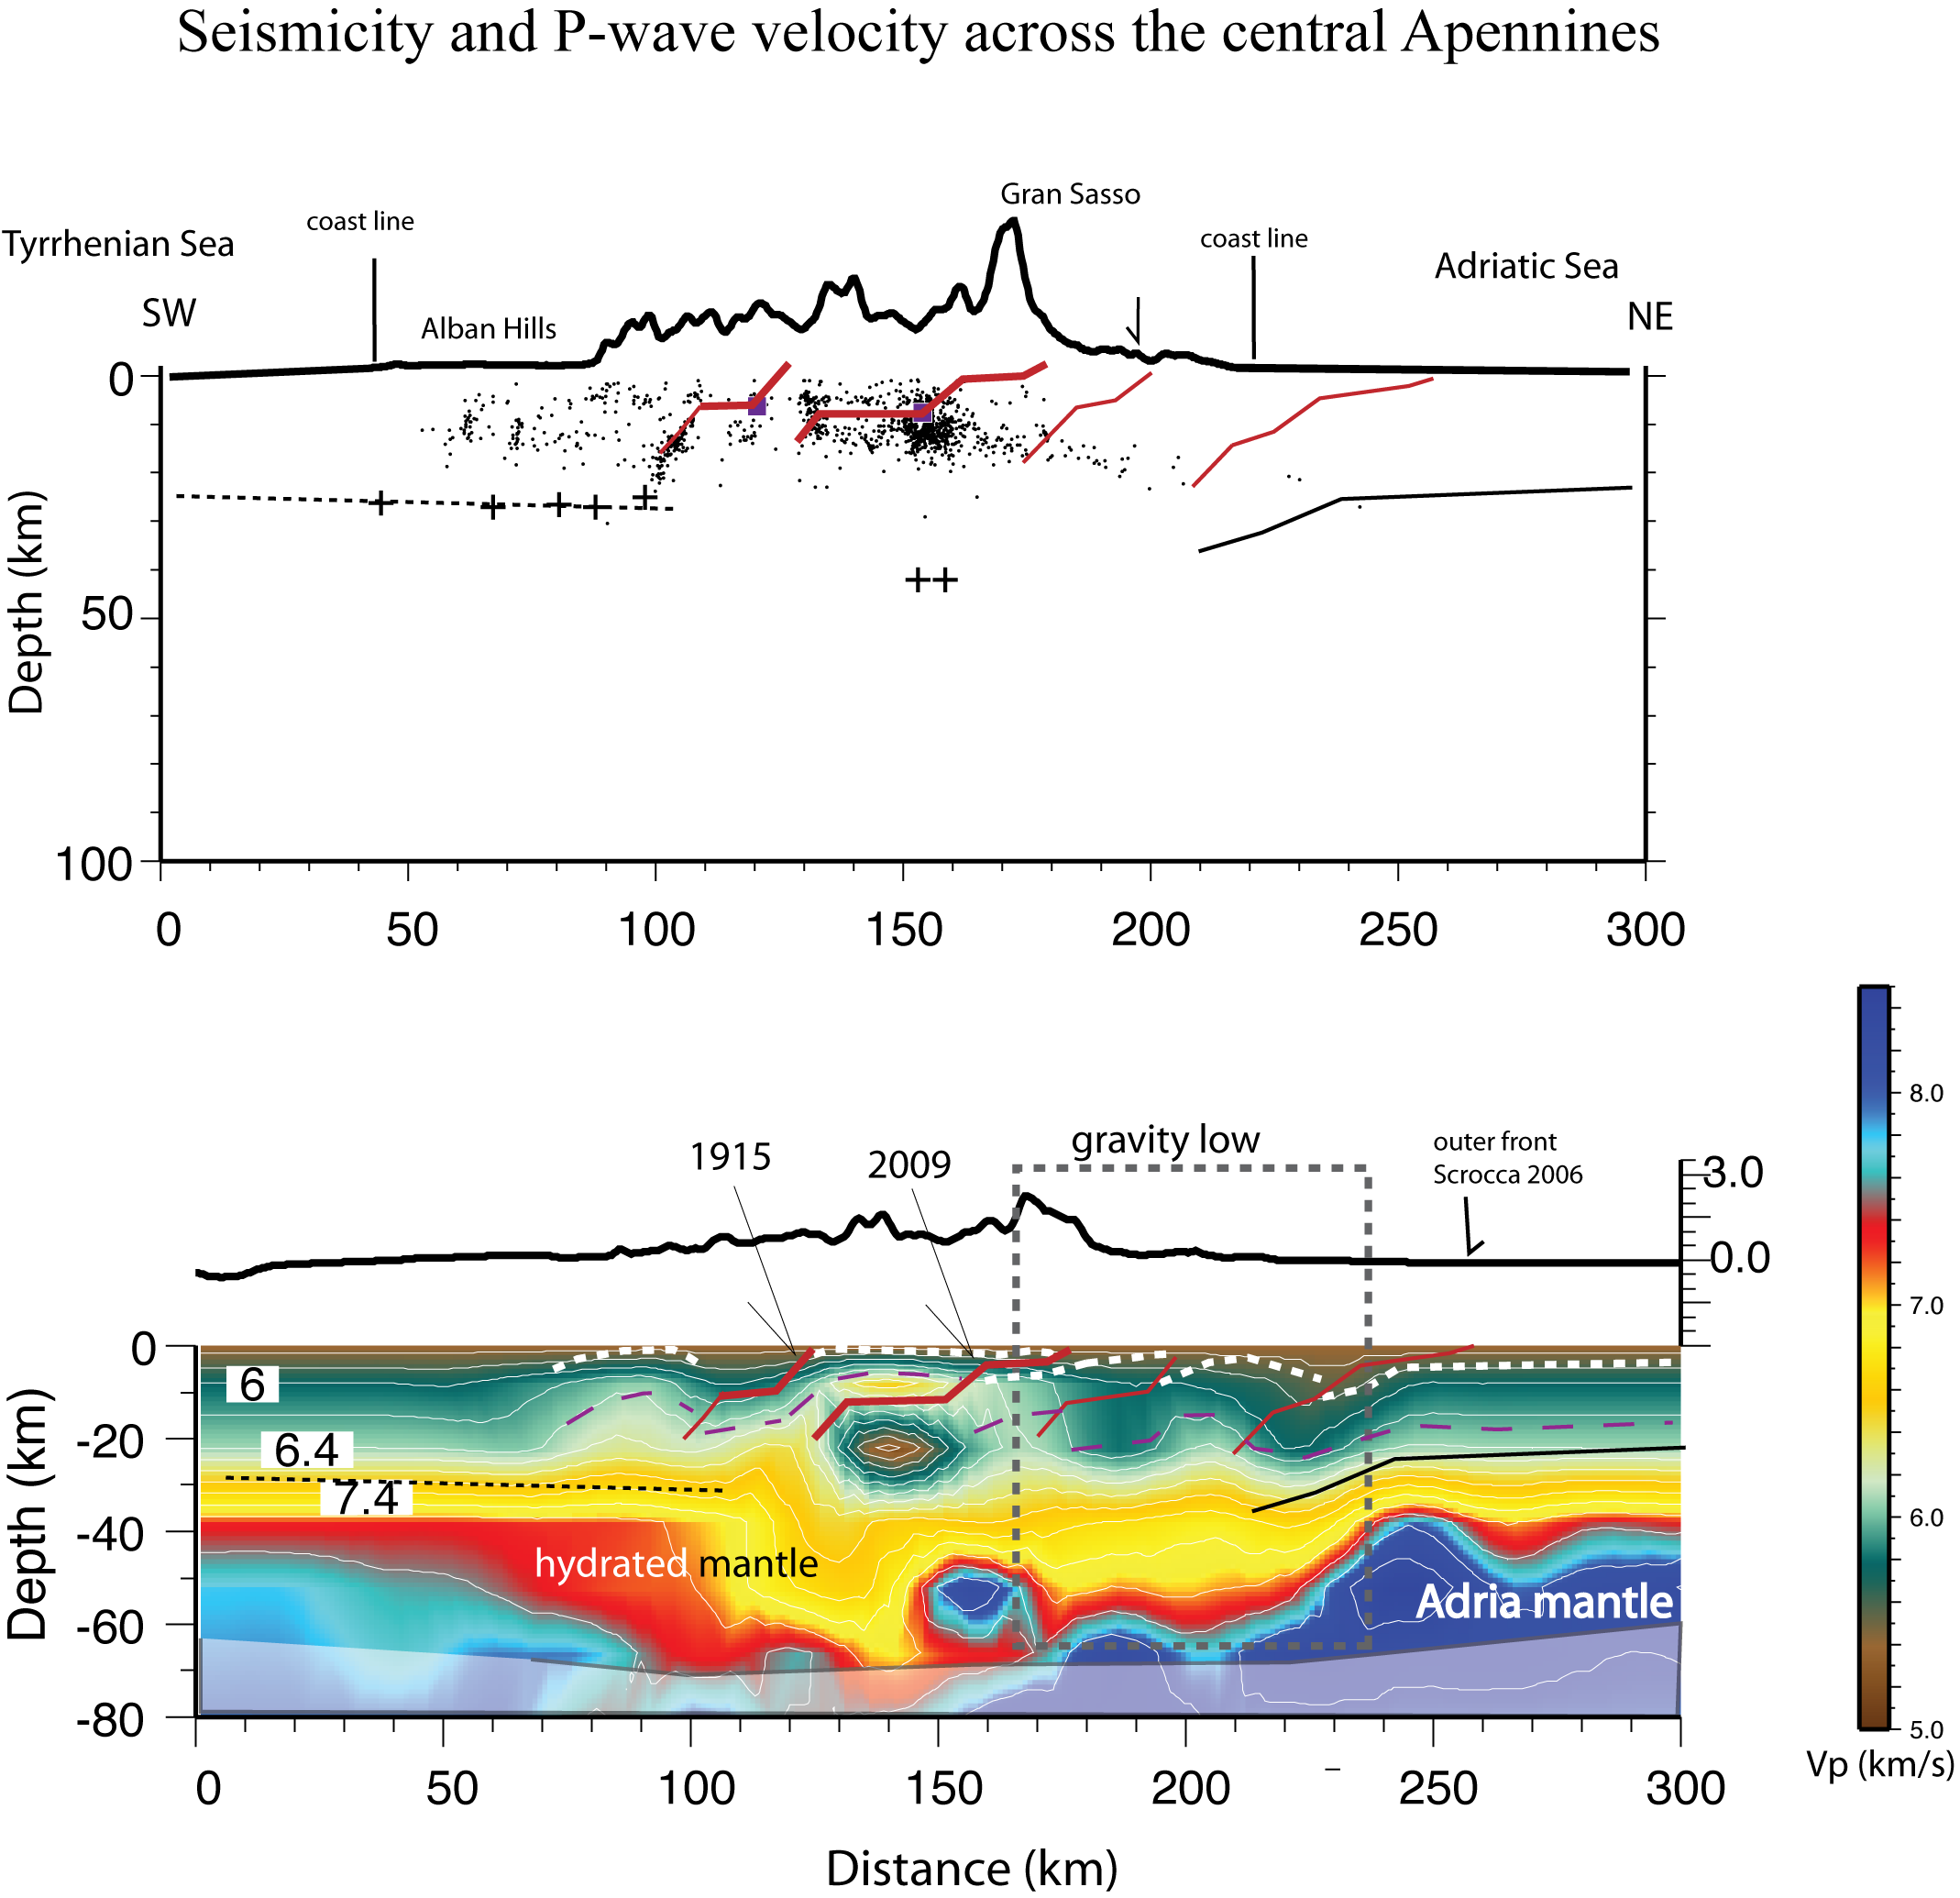
Figure 8. Seismicity and P-wave velocity across the central Apennines.
Vertical sections of seismicity (top panel) and P-wave velocity from Di Stefano et al. (2009, middle panel) across the central Apennines (see the track in figure1). The dashed area in the tomographic model is poorly resolved. The crosses are the Moho depth from Piana and Amato (2009). The geometry of the deep units, drawn in the tomographic panel, are reported in the upper panel on the seismicity and interpreted. The dashed white line is the top of the Adria limestone, the violet dashed line is the top of the high vp bodies, reasonably the metamorphic basement. The bold and dashed black lines are the Adria and Tyrrhenian Moho discontinuities, respectively.
Northern area
In this area, a paired couple of extension and compression is documented by geologic data and recent seismicity (Calamita and Deiana, 1988; Frepoli and Amato, 1997; Chiaraluce et al., 2004; Chiarabba et al., 2005; Carminati et al., 2010). Barchi et al. (1898a,b) Barchi et al. (2006), and Collettini et al. (2006) proposed a model of progressive eastward migration of paired crustal stretching, at the back and in the upper cover, and frontal shortening, from the Tyrrhenian to the Adriatic areas. Seismicity distribution (figure 7) shows that the eastward thrust, whose emersion fit the location of the compression front at the surface, is rooted down to 20-30 km depth and still active. Deep crustal seismicity (see also figure 1) originates on flat and ramp of this thrust accommodating, with steep angle inverse faults, a low-rate compression in the wedge. Historical earthquakes with M<6.0 are documented in this region probably originating on the ramps of the system. The compression is paired with the extension of about a few mm/yr revealed by GPS data and localized at the contact between the Adria lithosphere and Tyrrhenian mantle wedge. In this narrow belt, the normal fault system is fragmented into small segments, which have a lateral extent less than 10 km and rupture during M6.0 earthquakes (Chiaraluce et al., 2004).
Central area
Differently from the northern area, stress indicators do not indubitably reveal active compression (Montone et al., 2004). Instrumental data show the absence of deep crustal seismicity and intermediate depth earthquakes (see figure 1). These features document a first order variation in active tectonic process along the northern-central Apennines.
The velocity structure shows the existence of several strongly positive anomalies (vp around 7.0 km/s) describing the incorporation of deep crust units in the wedge, even at very shallow depth. We observe two main deep high-velocity antiforms, located in the western and eastern sides of the mountain range, the former is also seen by sharp reflections in the CROP11 seismic profile and interpreted as a deep compressional feature (Billi et al., 2006; Billi and Tiberti, 2009). The main feature is a central uplifted high velocity body (basement and overlaying sedimentary cover?). As already said, the nature of these high vp, high vs bodies is speculative. Based on the extremely high velocity, Chiarabba et al. (2010) proposed that mafic, strongly exhumed, rocks compose the basement upon which the Mesozoic sedimentary cover was deposed. This exhumation probably occurred during the Mesozoic rifting episodes of the Tethys Ocean and thinning of the continental margin. The accretion of this thin continental lithosphere to the Apennines wedge during the Mio-Pliocenic compression is probably a cause of the structural complexity revealed by tomography (Figure 8).
The external high vp deep antiform (X=200, in the section) might represent an uplifted block on the hanging wall of an inverted normal fault. Its upward extent, that follows the warping of anomalies at shallow depths, matches the thrust front proposed by Scrocca (2006). In this recent reconstruction, the front, which incorporates the Mid Adriatic Ridge, is located in the Adriatic offshore tens of kilometres eastward of that commonly accepted (Figure 1). Our velocity model agrees with this model and favours the eastward location of the thrust front. The overall resulting geometry is a progressive eastward retreated flexure of Adria from northern Apennines moving southward, until the Gargano region.
Today, the active extension concentrates in the central part of the Apennines range (Galadini and Galli, 2001). The normal faults responsible for the two most relevant earthquakes of the region (the Mw6.7 1915 Avezzano earthquake and the Mw6.3 2009 L'Aquila earthquake) follow the location and geometry of the central uplifted unit.