The shape of the Northern Apennines and the Calabrian Arc
Paleomagnetism is a fundamental tool to assess kinematic models of curved orogenic systems around the world because of its great potential in quantifying vertical axis rotations (e.g., Carey 1955; Eldredge et al. 1985; Marshak 1988; Van der Voo et al. 1997; Weil and Sussman 2004; Cifelli et al. 2008). On the basis of the spatial and temporal relationship between deviations in structural trend and the vertical axis rotation that took place within the belt, curved belts have been interpreted as primary, secondary or composite features. Primary arcs initiate in their present curved shape and their curvature does not increase during subsequent deformation. In this type of arcs, paleomagnetic declinations remain parallel along the arc and do not correlate with changes in thrust and fold-axis trend. Conversely, secondary arcs are originally linear fold-thrust belts that acquire curvature in a second phase of tectonic deformation, accompanied by opposite large-scale vertical axis rotations shaping the arc. In oroclines (e.g., Carey 1955; Marshak 1988) paleomagnetic declinations change direction along the arc and follow changes in thrust and fold-axis trend with a one-to-one correlation. Between these two end-members, progressive arcs represent either orogenic belts that acquire their curvature during progressive deformation or belts that acquire a portion of their curvature during a subsequent deformation phase (Vogt et al. 1976; Weil and Sussman 2004). This intermediate category describes the formation of most of ancient and modern curved orogenic systems (Fig, 2).
The origin of the arcuate shape in the Northern Apennines and in the Calabrian Arc represent a long debated paleomagnetic subject in the scientific community. In the following, results from the oroclinal tests for the two sectors of the Italian peninsula are described, in order to define whether the shape of these two arcs can be referred to the same mechanism or to different causes.
OROCLINAL TEST FOR NORTHERN APENNINES
For the oroclinal test, we focused on data coming from the external arc. The relationship between paleomagnetic declinations and structural directions was investigated using the method originally proposed by Schwartz and Van der Voo (1983) for the Appalachians and later applied in different curved orogenic systems, Northern Apennines included (Eldredge et al. 1985; Lowrie and Hirt 1986; Speranza et al. 1997). Differently from the previous oroclinal tests, in our analysis we directly compared paleomagnetic rotations with relative fold axis deviation. We used 315° as the reference fold axis direction, whereas fold axes at each site were determined either from the original publications or from geological maps of appropriate scale. When available, anisotropy of magnetic susceptibility data were used to estimate fold axis directions, representing the in-situ site mean direction of the principal maximum susceptibility a good indicator of the local fold axis direction (e.g., Kligfield et al. 1983; Kissel et al. 1986; Cifelli et al. 2005). We did not consider those data where the relationship between paleomagnetic rotation and structural elements were poorly constrained or those that could not be located in the map because information from the original papers was missing.
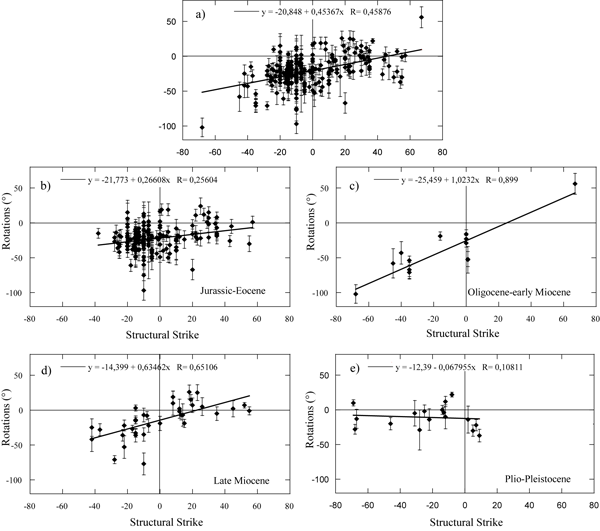
Figure 9. Oroclinal test for the Northern Apennines
Oroclinal test for the Northern Apennines considering the totality of data (a), Jurassic-Eocene data (b), Oliogocene-early Miocene data (c), late Miocene data (d), and Plio-Pleistocene data (e). Rotations are those reported in Fig. 4. Strike is the difference between a reference fold axis direction (315) and the structural direction at the site scale (see text for further details).
The huge number of data used in this analysis and the wide geographic distribution of sites, make data representative of the Northern Apennines. The totality of data is reported in Fig. 9a. Data are dispersed in the diagram, with the slope of the regression line far from 1, indicating a scarce correlation between changes of paleomagnetic declinations direction and changes in thrust and fold-axis trend. In order to analyze the temporal variations of paleomagnetic rotations paleomagnetic data were grouped into four distinct age intervals, representative of different stages of the Northern Apennines evolution: Jurassic-Eocene, Oligocene-early Miocene, late Miocene, Pliocene-Pleistocene (Fig. 9b-e). Data from the Jurassic-Eocene sediments come from the internal part of the chain, mostly from the Umbrian sequence, which represent the pre-orogenic tectonic history of the Northern Apennines (Fig. 9b). The geographic distribution of data is limited compared to the total extension of the arc (Fig. 3), whereas data span over a large temporal interval. This area is also characterized by a complex faulting and folding, often cut by normal faults. The scatter of paleomagnetic declinations may therefore result from local tectonic effects. Paleomagnetic data from Oligocene- Miocene mainly come from the external part of the chain and have a representative geographic distribution along the arc. Most of these sites have been sampled in the Epiligurian units which record the progressive thrusting of the Ligurian nappes toward the Adriatic foreland. Calculation of the best fit line of the Oligocene-early Miocene data gives a correlation coefficient of 0.899, which describe a close one-to-one correlation with the variation between changes in declination and the structural trend (Fig. 9c). These data suggest that at least this part of the arc is not a primary feature. Data from late Miocene, coming from the external flysch units of the Umbrian domain, show the same trend, with a correlation coefficient of 0.65 and a slope of 0.63 (Fig. 9d). This result is different from result published by Speranza et al. (1997), as they excluded sites from the Acquasanta structure, which are instead included in our calculation. Notwithstanding these values indicate quite a good correlation between changes in declination and the orogen trend, ideal oroclinal bending would display a line of unite positive slope. In Fig. 9c, in fact, rotations range between the slope of zero and one, similar to that expected in a progressive arc. In Plio-Pleistocene sediments, which represent the foredeep sediments related to the last stages of the Northern Apennine deformation, the correlation coefficient is very low, indicating that the process of curvature was almost finished (Fig. 9e).
OROCLINAL TEST FOR THE CALABRIAN ARC
The distribution of paleomagnetic rotations along the Calabrian Arc indicates that the limbs of the arc underwent circa-symmetrical opposite rotations, with counterclockwise rotations in the Southern Apennines and clockwise rotations in Sicily (Fig. 4). An oroclinal test allows verifying whether this distribution correlates with changes in the trend of the orogen, supporting the orocline model. Paleomagnetic data described above indicate that the Calabria-Peloritane Domain had a different tectonic history compared to the other portions of the Calabrian Arc (see Cifelli et al. 2008 for a full discussion). For this reason, we excluded paleomagnetic data collected in the Calabria-Peloritane Domain from the oroclinal test, focusing only on data from the Southern Apennines and Sicily. We directly compared paleomagnetic rotations with structural strikes determined from the original publications, geological maps or Anisotropy of Magnetic Susceptibility (AMS) data. We did not consider those data where the relation between paleomagnetic rotation and structural elements was poorly constrained (for more details refer to Cifelli et al., 2008).
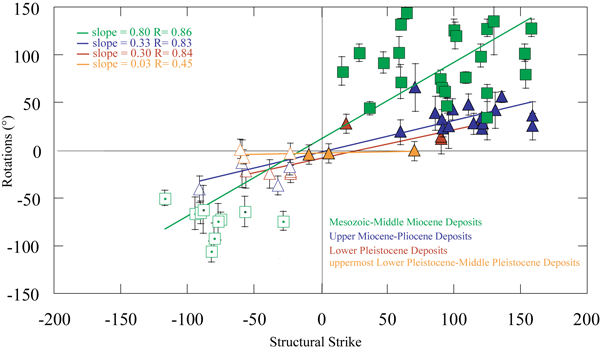
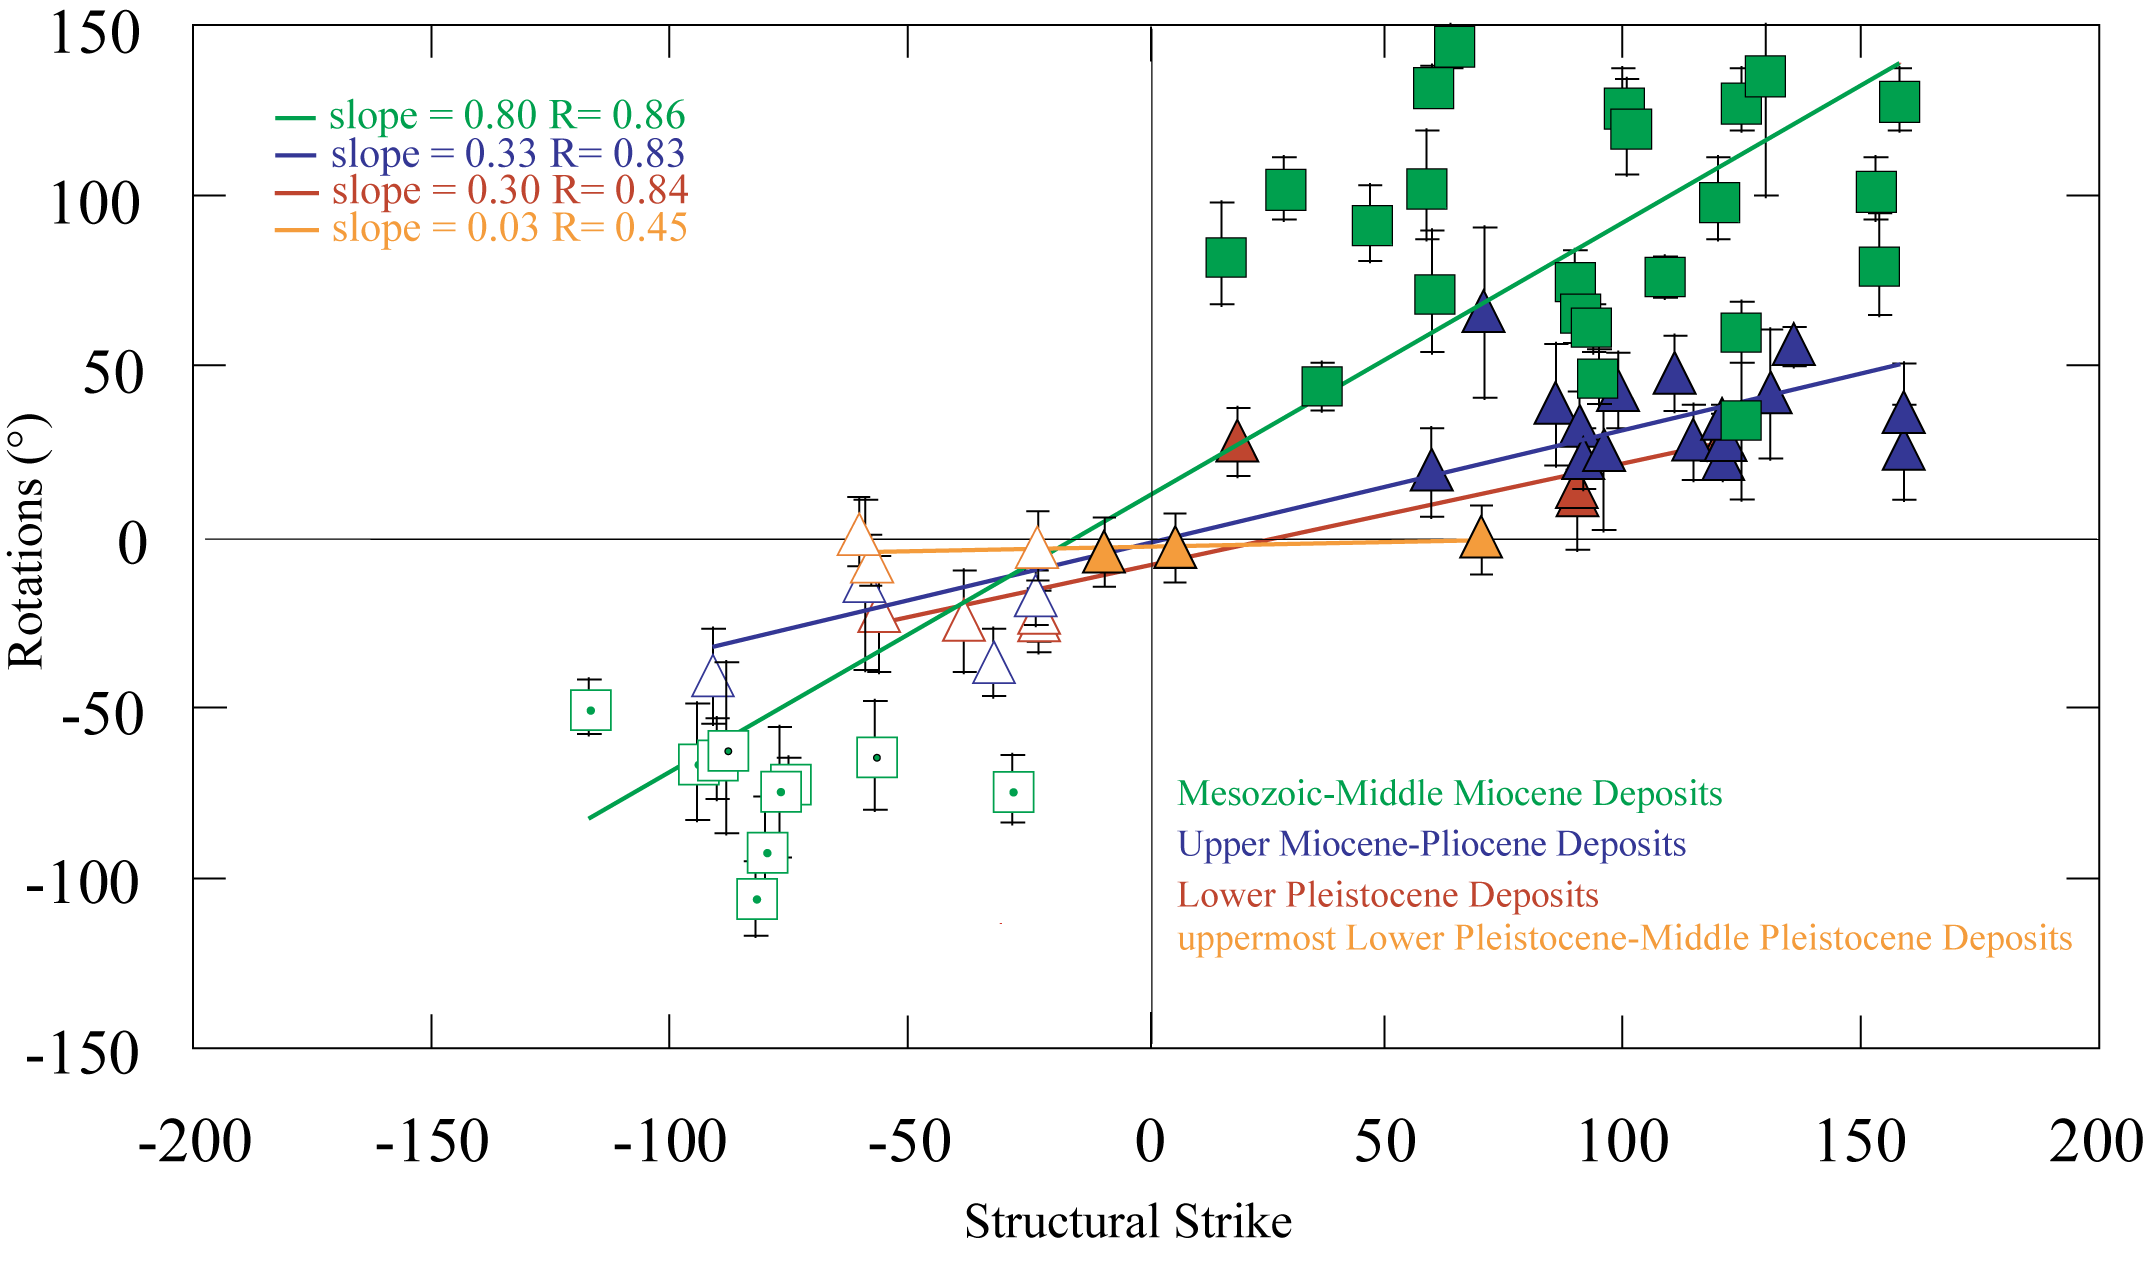
Figure 10. Oroclinal test for the Southern Apennines and Sicily.
Oroclinal test for the Southern Apennines and Sicily. The different colours describe the temporal distribution of paleomagnetic rotations as a function of the structural trend of the chain. (modified from Cifelli et al., 2008).
In order to quantify the temporal variation in paleomagnetic directions as a function of change in the regional structural trend, we used a linear regression technique (e.g., Eldredge et al. 1985; Schwartz and Van der Voo 1983), grouping paleomagnetic data into four distinct age intervals, representative of the different stages of Calabrian Arc evolution: Mesozoic to middle Miocene, late Miocene-Pliocene, early Pleistocene, and uppermost early Pleistocene-middle Pleistocene. The distribution of the data in Fig. 10 indicates that tectonic rotations in the two edges of the Calabrian Arc are well correlated with the structural trend. Calculation of the best-fit line of the data gives a correlation coefficient of 0.73, with a line of slope 0.55 (black solid line in Fig. 10). This value indicates quite a good correlation between changes in declination and the orogen trend, indicating that Calabrian Arc curvature is not a primary feature. However, the distribution of paleomagnetic rotations ranges between the slope of zero and one, similar to that expected in a progressive arc. The distribution of vertical axis rotations through time indicates that paleomagnetic rotations systematically decrease in progressively younger sedimentary deposits in both the Southern Apennines and in Sicily. These data clearly indicate that the curvature of the Calabrian Arc was acquired progressively and that, taking into account only the Southern Apennines and Sicily, the Calabrian Arc could be considered a progressive arc, following the kinematic classification proposed by Weil and Sussman (2004).