Chapter 2. Crust and mantle structure: Tyrrhenian vs. Adriatic domain
The NA can be divided into two different crustal domains, whose distinction is based on their peculiar geophysical and geological features: a western Tyrrhenian Domain (TD), where extensional deformation destroyed the pre-existing compressional belt; and an eastern Adriatic Domain (AD), where the compressional structures are more recent and still preserved. The transition between the two domains is pretty sharp and occurs along a relatively narrow, arcuate strip, which is here referred to as the “transition zone” (TZ).
The TD and the AD are characterised by contrasting gravity anomalies and heat flow values, and show relevant differences in the crustal thickness and internal structure, revealed by both active and passive seismic surveys.
Gravimetric and heat flow data
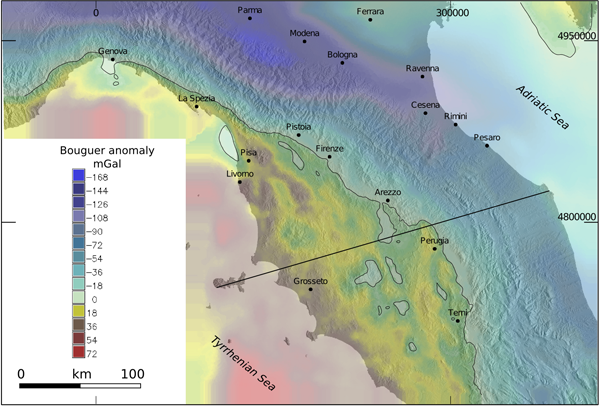
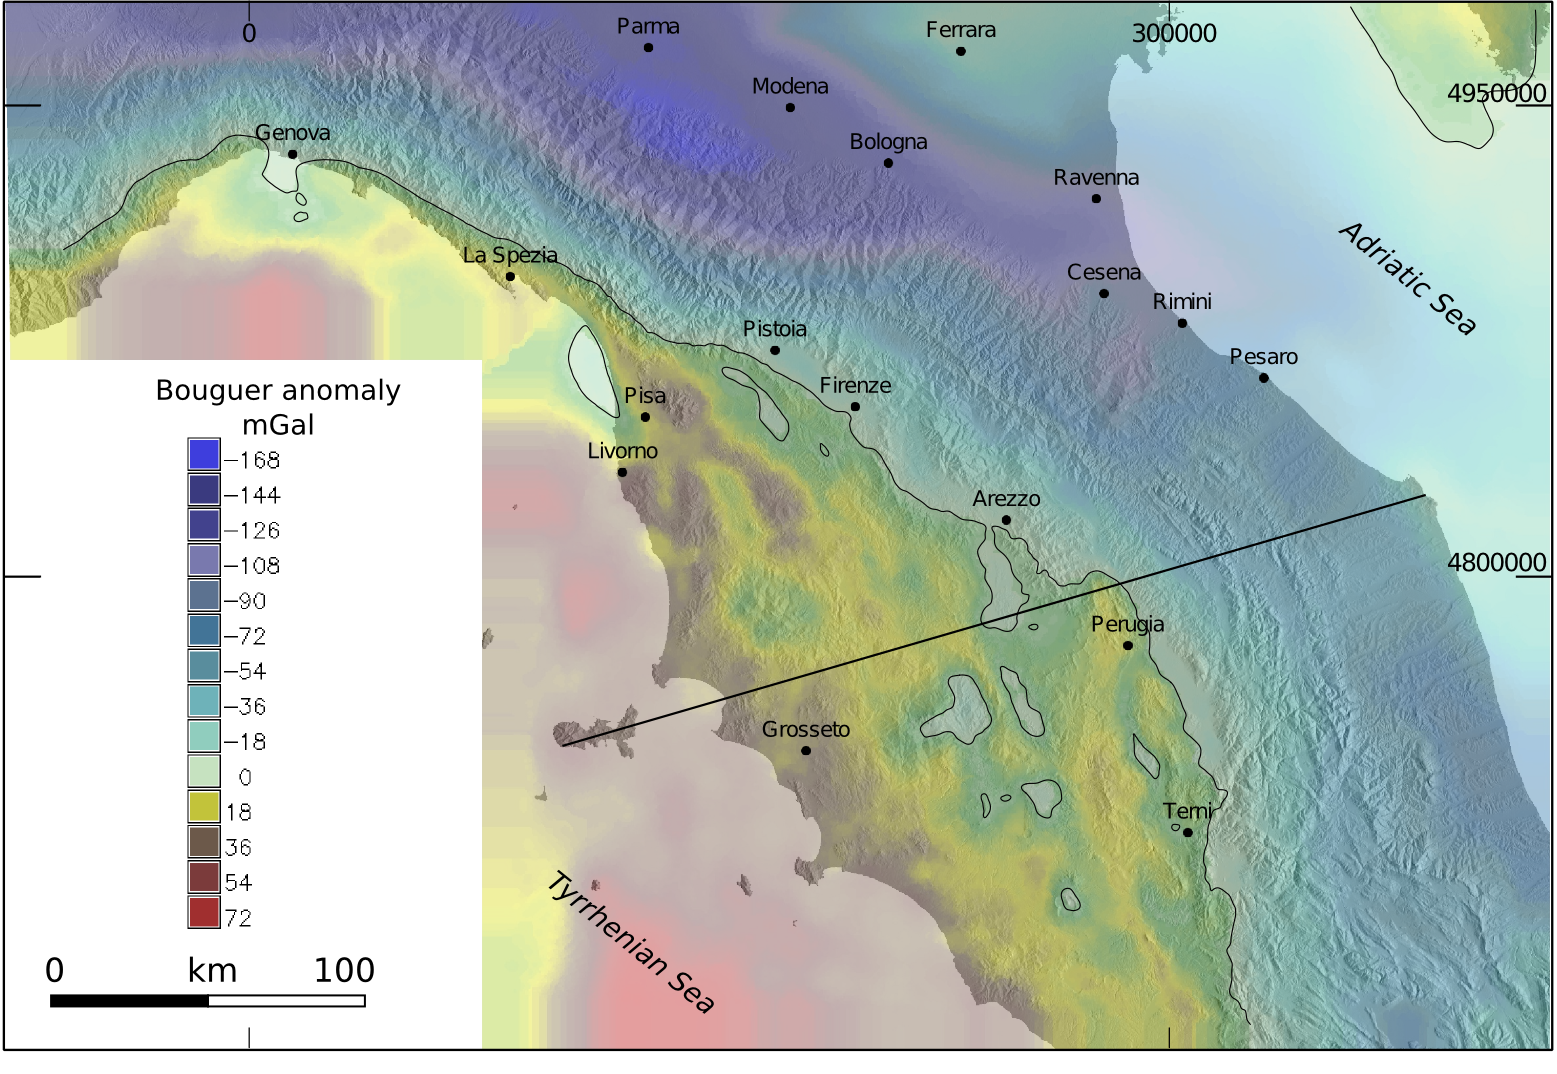
The gravity map (ISPRA, ENI, OGS, 2009) of the region (Bouguer anomalies, fig. 2) shows that the TD and the AD are characterised by positive and negative anomalies, respectively, and are separated by a sharp, arc-shaped step, corresponding to the TZ. On this map, the long-wavelength anomalies reflect the crustal structure whilst the short-wavelength anomalies reflect local and shallower features, mainly corresponding to recent syntectonic basins, filled with soft and light sediments.
The TD is characterized by long-wavelength positive anomaly (maximum +50 to +70 mGal), possibly imaging a mantle dome, centred beneath the Tyrrhenian coast. Scattered, short-wavelength anomalies correspond to the distribution of the recent (Late Miocene-Quaternary) hinterland basins of Tuscany, and of the intervening structural highs.
By contrast, the AD is characterized by long-wavelength negative anomaly (minimum < -150 mGal): the two gravimetric minima grossly correspond to the location of the depocenters of the Po Plain-Adriatic foredeep (beneath Reggio Emilia and Pescara respectively). If the negative anomaly is not due only to the light siliciclastic material of the foredeep (Royden and Karner, 1984), further contributes can derive from the stacking of slices of continental crust beneath the adjacent mountain ridge. In the AD the short-wavelength anomalies are less pronounced than in the TD and seem to be related to the thrust-top basins.
Heat flow data, collected in the NA (Della Vedova et al., 1991; 2001; Mongelli and Zito, 1991) show that the TD is characterised by higher values of surface heat flow (usually > 150 mW m-2) with respect to the AD (30-70 mW m-2). From heat flow data Della Vedova et al. (2001) derived the temperature distribution with depth, highlighting the effect of shallow processes, active in the upper few km of the crust, such as fresh water circulation (within the carbonates of the Apennines ridge), sedimentation (in the foredeep areas), rapid erosion (mainly in the Alps), recent volcanic activity (in the geothermal areas of the TD). Correcting these disturbing effects (which still derive from the tectonic setting and evolution), Della Vedova et al. (2001) estimated the average values of the “undisturbed conductive heat flow” for the main tectonic provinces of Italy, rapidly decreasing moving from the TD (> 100 mW m-2) to the Apennines Ridge (65-75 mW m-2) till the Po Plain-Adriatic foredeep (40-50 mW m-2).
Figure 2. Gravity map (Bouguer anomalies) of the Northern Apennines.
The map is obtained from rasterization of gravity anomaly contours from ISPRA, ENI, OGS (2009). The solid black contour line is the zero value. The underlying shaded relief is derived from the SRTM (Shuttle Radar Topography Mission) 90 m resolution DEM available at http://srtm.csi.cgiar.org/index.asp (Jarvis et al., 2008). The straight solid line is the trace of the section of fig. 3.
Active and passive seismic data
Since the 70's of the last century seismic refraction experiments investigated the crustal structure of the NA and of the adjacent regions. The results were synthesised on Moho isobath maps (e.g. Scarascia et al., 1994; Scrocca et al., 2003), highlighting the presence of a relatively thin Tyrrhenian crust (20-25 km thick), contrasting a thicker Adriatic crust (30-35 km), separated by a sharp Moho step beneath the TZ (the same area where the larger variation of the gravimetric anomalies is observed, see fig. 2). The re-elaboration of these data and the acquisition of new seismic refraction profiles showed a doubling of the crust beneath the TZ (Val di Chiana-Val Tiberina region), laterally extending for about 30 km (Ponziani et al., 1995; De Franco et al., 1998). Seismic refraction data also highlighted a relatively slow Moho (7.7 km/s) in the TD and a faster Moho (about 8.0 km/s) in the AD; gravity modelling confirms the presence of a softer and warmer upper mantle beneath the Tuscany and a denser and older one as proper of the Adria lithosphere (Marson et al., 1998).
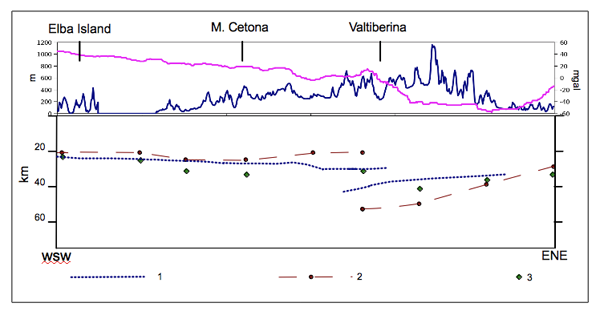
The structure of the deep crust and of the upper mantle has been also imaged analyzing the teleseismic waveforms recorded by a regional array crossing the northern Italian peninsula (Piana Agostinetti et al., 2002; Mele and Sandvol, 2003). The crust-mantle boundary revealed by the receiver function analyses is generally consistent with the results of the seismic refraction experiments (Fig. 3), showing a shallow Thyrrenian Moho, slightly deepening towards the east from 22 to 25 km, and a deeper west-dipping Adriatic Moho. However, significantly different estimates were proposed for the depth of the Adriatic Moho below the main ridge of the Apennines, e.g. > 50 km in Mele and Sandvol (2003) and about 35 km in Piana Agostinetti et al. (2002).
Figure 3. Moho depth profiles across the Northern Apennines.
Moho depth after: 1- Ponziani et al., 1995; 2- Mele and Sandvol, 2003; 3- Piana Agostinetti et al., 2002. In the upper diagram: the blue line is topography; the red line is a gravimetric profile (data after ISPRA, ENI, OGS, 2009). The trace of the section is on fig. 2.
The map of the lithosphere thickness, derived by passive seismology, shows that the TD is characterized by a strongly reduced lithosphere (about 30 km), whilst the AD lithosphere reaches a thickness of 70 to 90 km (Calcagnile and Panza, 1981; Suhadolc and Panza, 1989). In the TD a thin lithosphere is also supported by a study of thermal data that locates the lithosphere-asthenosphere boundary (1600 K isotherm) at a depth of about 30 km (Pauselli and Federico, 2002). The overall thinning of the lithosphere is reflected in the high surface heat flow and in the positive Bouguer anomalies found in this domain (Marson et al., 1998) . The reduced thickness of the lithospheric mantle (less than 15 km thick) indicates a considerable amount of partial melting (Peccerillo and Panza, 1999). More controversial is the lithosphere thickness in the AD: beneath the Apennine chain, a thickness of about 60 km is derived from the dispersion of the surface waves (Suhadolc and Panza, 1989), whereas a larger thickness (100-150 km) is derived from the P-Wave analysis (Babuska and Plomerova, 1995).
During the 90's, a further contribution to the knowledge of the crustal structure of the NA was offered by the Italian deep crust seismic project (CROP), which acquired crustal scale seismic reflection data across the NA, both onland and offshore. The profile CROP03 (Pialli et al., 1998) extends across the whole central Italy, from Punta Ala (Tyrrhenian coast) to Gabicce (Adriatic coast), intersecting all the main tectonic units of the NA. CROP profiles M12A and M16 represent the offshore continuation of the CROP03 profile across the Tyrrhenian and the Adriatic Sea, respectively (Finetti et al., 2001; Scrocca et al., 2003). A further profile (CROP18) was acquired onland across the geothermal areas of southern Tuscany (Brogi et al., 2005).
The CROP 03 profile has shown that the TD and the AD exhibit a distinct reflectivity pattern at any crustal level. In the upper crust of Tuscany (TD), extensional tectonics, active since the late Miocene, has largely obliterated the previous compressional structures. In contrast, compressional structures are still clearly preserved in the Umbria-Marche Apennines (AD) where extension has been active for a much shorter time period, about 3Ma, and has only affected the westernmost part of the region. Local earthquake tomography confirms that the compressional structures are still the most visible features of the upper crust, as they have not been obliterated by the active extension, yet (e.g. Chiarabba and Amato, 2003; Di Stefano et al., 2009).
The TD lower crust is characterized by several, discrete sub-horizontal reflections, some of them laterally continuous for as much as 10 km, whilst the AD lower crust possesses a weak and diffuse reflectivity, without any prominent reflections (Magnani, 2000).
Beyond these valuable researches and results, the deep crustal structure and the Moho geometry of the NA is still partially unresolved, particularly in the zone where the transition between the TD and the AD occurs. The Moho doubling is poorly imaged by the CROP03 profile, where the TZ is characterised by the presence of a highly reflective window, which includes some diffraction hyperbola down to a depth of 10 s; in this region a major, west-dipping crustal shear zone can be hypothesized. These problems are reflected by the contrasting interpretations, which have been proposed for the CROP03 profile by different Authors (Barchi et al., 1998a; Decandia et al., 1998; Finetti et al., 2001; Lavecchia et al., 2003; Pauselli et al., 2006). It is also worth to note that significant differences affect the velocity models of the NA crust, derived by active seismic (e.g. De Franco et al., 1998) and passive seismic (e.g. Di Stefano et al., 2009) experiments.
Approximately beneath the TZ (where the doubling of the crust was detected by the refraction data) tomographic images obtained by different Authors with different methods (e.g. Amato et al., 1993; Spakman et al., 1993; Piromallo and Morelli, 2003) show a pronounced high-velocity anomaly, recognised till the depth (670 km) of the mantle transition zone. This anomaly is commonly interpreted as a submerged slab possibly linked to the crust of the AD. The shape and position of the velocity anomaly are slightly different in the different studies. The most relevant differences pertain to the length of the slab and its lateral and along-dip continuity. At least the shallower part of the slab (down to 100-200 km of depth) should consist of thinned continental crust (i.e. the passive margin of Adria), which was the original substratum of the Apennines units, now stacked in the NA fold-and-thrust belt.
The anomalous high S-wave velocity at depths exceeding 50 km confirms the presence of lithospheric roots below the TZ (Calcagnile and Panza, 1981; Du et al., 1998; Pontevivo and Panza, 2002). These roots are also marked by rare, but regularly recorded, seismic activity (Amato et al., 1997) that reaches a maximum depth of 90 km below the Val Tiberina Basin (see chapter 5).