Exploring the Collision Process: Mantle anisotropy and the Mantle Transition Zone (the Mantle thermometer)
The Mantle thermometer
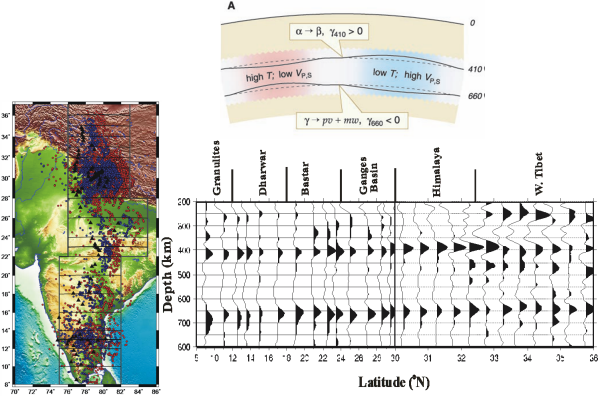
The ongoing Indo-Eurasian collision, by deforming a large part of the continental lithosphere to transform much of their earlier structures into the world’s largest high-altitude plateau and its southern rim of the spectacular Himalaya remains the most dominant geodynamic process operating on earth. It is thus potentially the most evocative natural laboratory to investigate the yet obscure processes that are responsible for their dramatic expressions and of lesser ones elsewhere on the globe. High resolution imaging of the crust and upper mantle expected to reveal some of their implied signatures, now made possible by broadband seismology and new insights from mineral physics, make it a particularly propitious time to address this problem. Two end-member models envisage India’s continued underthrusting of Himalaya-Tibet by penetration i) of the entire Indian plate into Tibet (Argand 1924; Barazangi and Ni, 1982), and ii) only of its delaminated crust (Bird, 1978; Houseman et al., 1981; Molnar, 1988). Fortunately, these models have mutually exclusive implications which are testable. The first model would be expected to show high velocities in the shallow upper mantle across the Himalaya and Tibet upto the leading edge of the penetrating Indian plate, with little lateral perturbation of the underlying mantle temperature distribution which can be detected by variations in the relative depths of the two prominent mantle zone discontinuities governed by the Clapeyron condition. The second model, on the other hand, should show low velocities in the shallow upper mantle overlying the dipping, high velocity subducted or delaminated lithosphere. If the cool, higher velocity sinking slab were to reach transition zone depths, its thermal affects should then result in the appearance of a significant transition zone topography. Results of an experiment designed (Prakasam et al. 2009) to image the prominent mantle zone discontinuities at ~410 and 660km, across India, western Himalaya and Ladakh (the Indian territory of south-western India) whilst at the same time constraining the shear wave speed structure in the crust to improve the resolution, show that these two second order discontinuities run parallel to each other right across the north Indian plains and Himalaya to the Karakoram (Figure 9), except for an upwarp beneath Himalaya-Tibet, most likely because of the presence of the high velocity Indian mantle above. This result coupled with the higher shear wave speed below 100km in Tibet, reported by Priestley et al.(2006), based on Rayleigh wave tomography, strongly argue for the reality of Argand’s model setting the scene for the fusion of the transcontinental cratonic cores Beneath northern India and Tibet.
Figure 9. Cold mantle depth
Showing depths to the base of the lithosphere extending to over 280km beneath Eurasia-northern India, mapped through multimode Rayleigh wave dispersion velocities. The image clearly shows the existence beneath all of Tibet, of an extensive cold mantle forming a cratonic core (Copley and McKenzie, 2007).
Anisotropy
Another detectable signature of the deformation field, both in the crust and the upper mantle, is the induced alignment of rock fabrics and elastically anisotropic minerals, which is amenable to investigation through the observed birefringence of shear waves. Most rock forming minerals are anisotropic, principally quartz (~40% Vs anisotropy) in the crust and olivine in the mantle. Shear waves split into fast and slow orthogonally polarized waves when encountering such materials except when their initial planes of polarization are either parallel or perpendicular to the axes of anisotropy. The component polarized along the fast direction leads the other. Its azimuth and the lead time which can be determined from data, are measures of the anisotropy of the medium which can be calculated from these observed quantities. Non split polarization or null results would therefore signify either the absence of anisotropy or, if present, its fast or slow direction. A largely preferred approach to investigating mantle abisotropy is to study the core refracted phases (SKS) which are simpler to detect and interpret, because being converted from longitudinal waves at the core-mantle boundary, they are cleansed of all information about the source side anisotropy and are necessarily polarized in the radial direction because their energy is confined to the plane of propagation. Inferences about the causative strain field drawn from seismic anisotropy generally assume the mediating processes of Asthenospheric flow which, in simple shear, will have the tendency to align the olivine a axis, or creep which may occur as dislocation creep involving motion of crystalline dislocations within grains or diffusion creep involving solid state diffusion between grain boundaries. The former is understood to preferentially align the a axis of the mantle mineral olivine along the minimum strain axis. Diffusion creep which for long was regarded as producing no anisotropy (e.g., Savage, 1999), has, however, been shown (Sundberg et al., 2008) to produce crystal preferred orientation in materials possessing significant grain boundary anisotropy, with a tendency to minimize the viscosity of the aggregate. Non-null results over much of the shield reported from several studies in the past, have engendered the view that the Indian continental lithosphere had no detectable anisotropy and somehow escaped being branded by deformation events. Results of an experiment designed to generate the maximally consistent picture of anisotropic fast directions in the Indian continent and the Himalaya, using both null and non-null determinations are shown in Figure 10 (Maggy Heintz et al. 2009). The most remarkable result of this analysis demonstrates that the Indian plate, contrary to the hitherto held view of being isotropic, is definitely not so, and that it has ingrained in it consistent NNE-SSW anisotropic fast axis over much of the shield south of the Himalayan foredeep, aligned to its convergence velocity with respect to Eurasia, mediated by the relative asthenospheric flow underneath. Indeed, one of the attendant consequences of the alignments thus induced, would be to create foliations in the horizontal plane which would inhibit splitting of the near vertically traveling shear waves such as the SKS. The relative poverty of detectable shear wave splittings over India, could therefore be a signature, more strongly, of the shear mediated horizontal foliation planes in the basal lithosphere rather than the result of a nearly isotropic plate. Notably, however, these NNE-SSW striking fast axes dominating the continent from as far south as Sri Lanka, turn almost by 90º on approaching the Himalayan belt, to become perpendicular to the compression axis. This result would have been easier to interpret in terms of dislocation creep with its tendency to align the a axis of olivine perpendicular to the maximum compressive stress, if this trend had been observed throughout the plate, because the Indian plate being manifestly very strong, must transmit stresses within the plate without any significant stress drops within. The only other process that would explain it, would be the turning of the asthenospheric flow by the under-thrusting Indian plate acting as a barrier, a result observed in several subduction zones (Savage, 1999). Further north at Ladakh stations, the fast anisotropy directions have highly variable directions from the NUVEL 1A orientation at Hanle to along strike orientations further north at Khardungla (Figure 11). A coherent explanation for this wide variation is at presented not warranted by the data, although it must be mentioned that 10 years of well constrained GPS Geodesy results attest to the fact that the thick Ladakh crust south of the Karakoramm, flows arc normally over the Indian plate at ~18 mm/yr (Figure 12) accompanied by an equal stretching of the arc represented by the Leh-Lhasa line (Jade et al., 2008), also corroborated by the work of Copley & Mckenzie (2007) who visualize Tibet flowing over India much like honey (Figure 13), a condition facilitated by its hotter lower crust alluded to earlier.
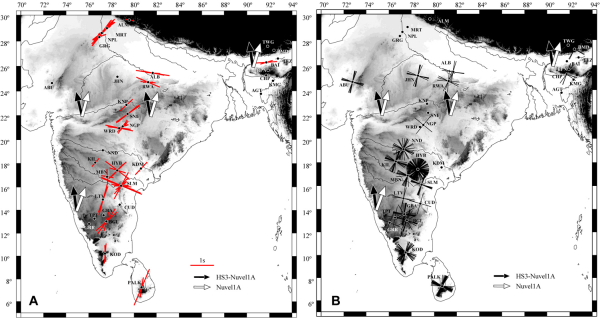
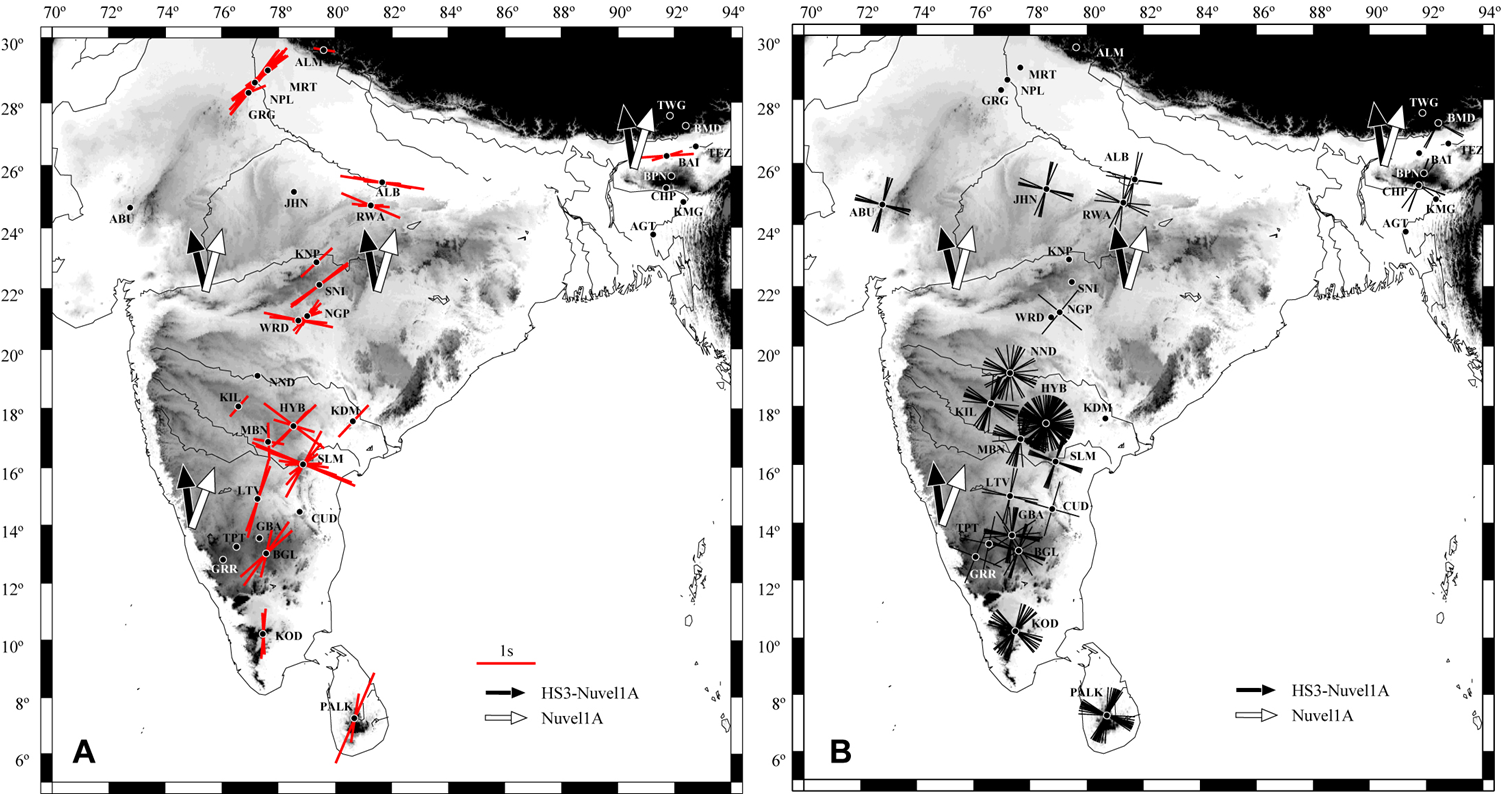
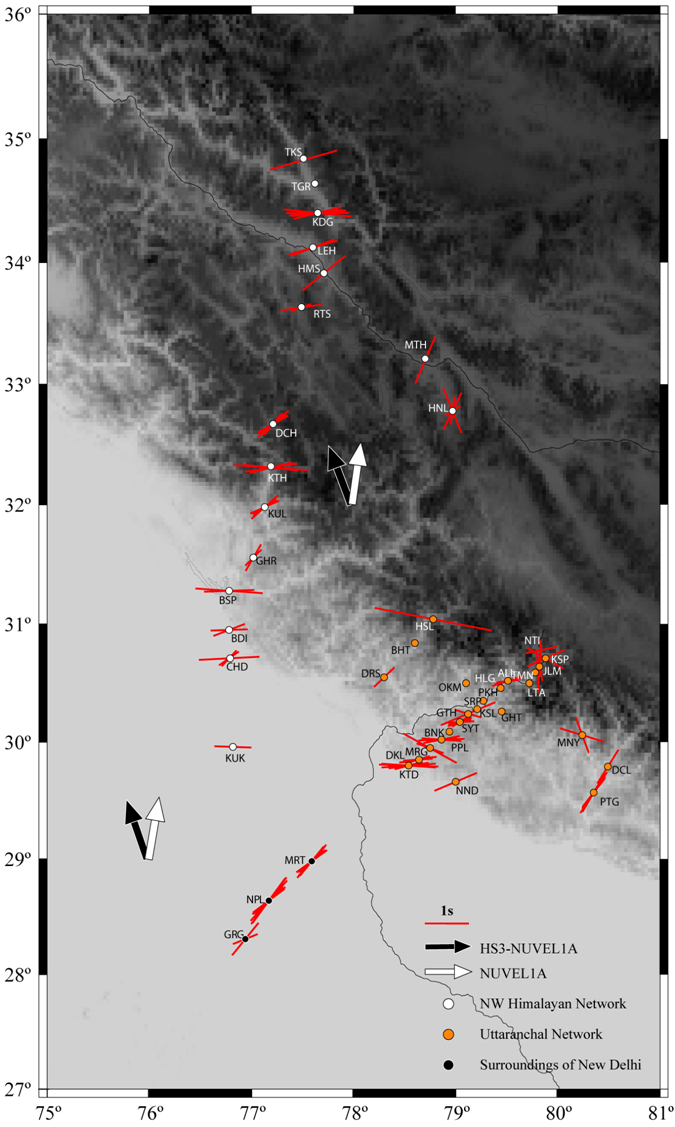
Figure 10. Analyzed anisotropy
Maps showing the analyzed anisotropy, A (non-nulls), fast polarization direction in red (length proportional to dt, and B (Nulls) marking the two potential directions at right angles. Black and white arrows represent Indian plate velocities in two reference frames: HS3-NUVEL1A (Gripp & Gordon 1990), constrained with respect to the deep mantle, and NUVEL1A (DeMets et al. 1990), with respect to a fixed Eurasia (Maggy Heintz et al., 2009).
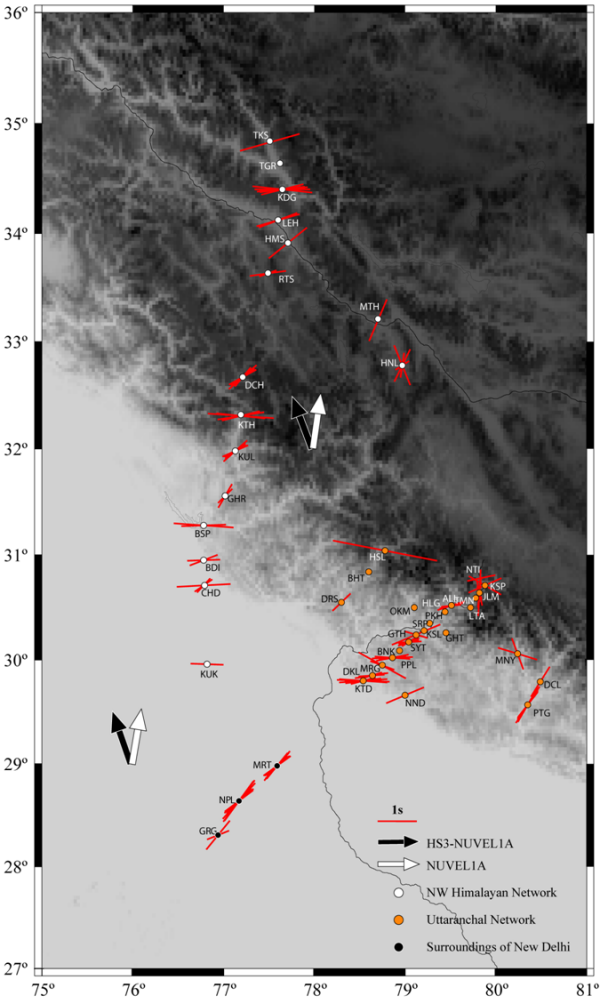
Figure 11. Fast anisotropy polarization directions
Showing the fast anisotropy polarization directions of core refracted shear wave phases, determined at northwestern India sites from the Ganga plains to the Karakoram (Maggy Heintz et al., 2009).
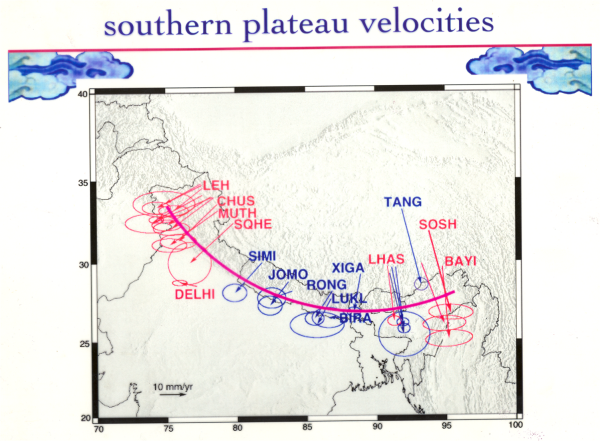
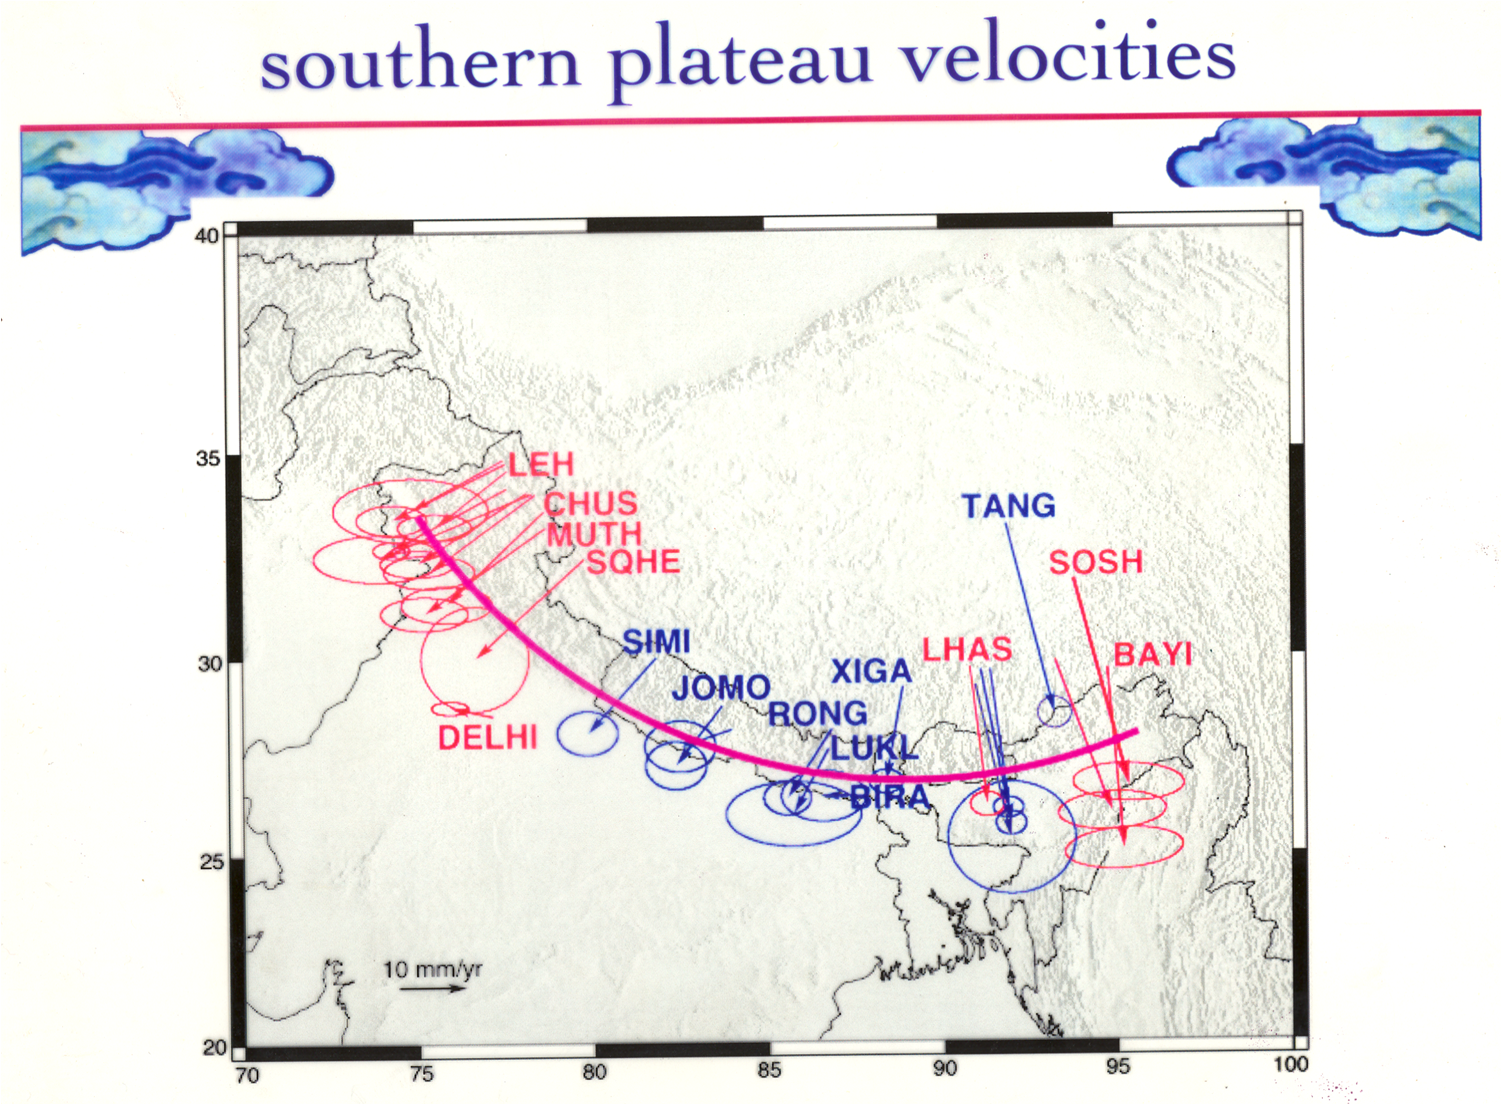
Figure 12. Site velocities
Showing site velocities along the arc from Ladakh in the trans-Himalayan northwest to Bomdila in the eastern Himalaya. The arc normal convergence at about a uniform 18 mm/y all along the arc testifies to the viscous like flow of the western Tibet crust in Ladakh over the Indian plate. A consequential distending of the arc represented by the annual extension of the Leh-Lhasa line by ~16 mm, not shown in the figure, corroborates this interpretation (Jade et al., 2005).
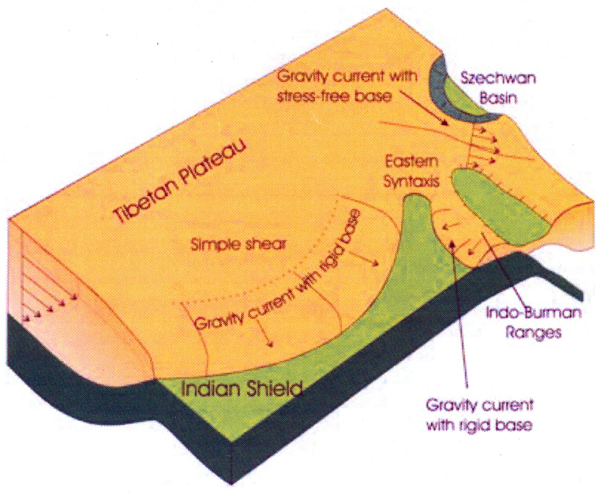
Figure 13. Cartoon
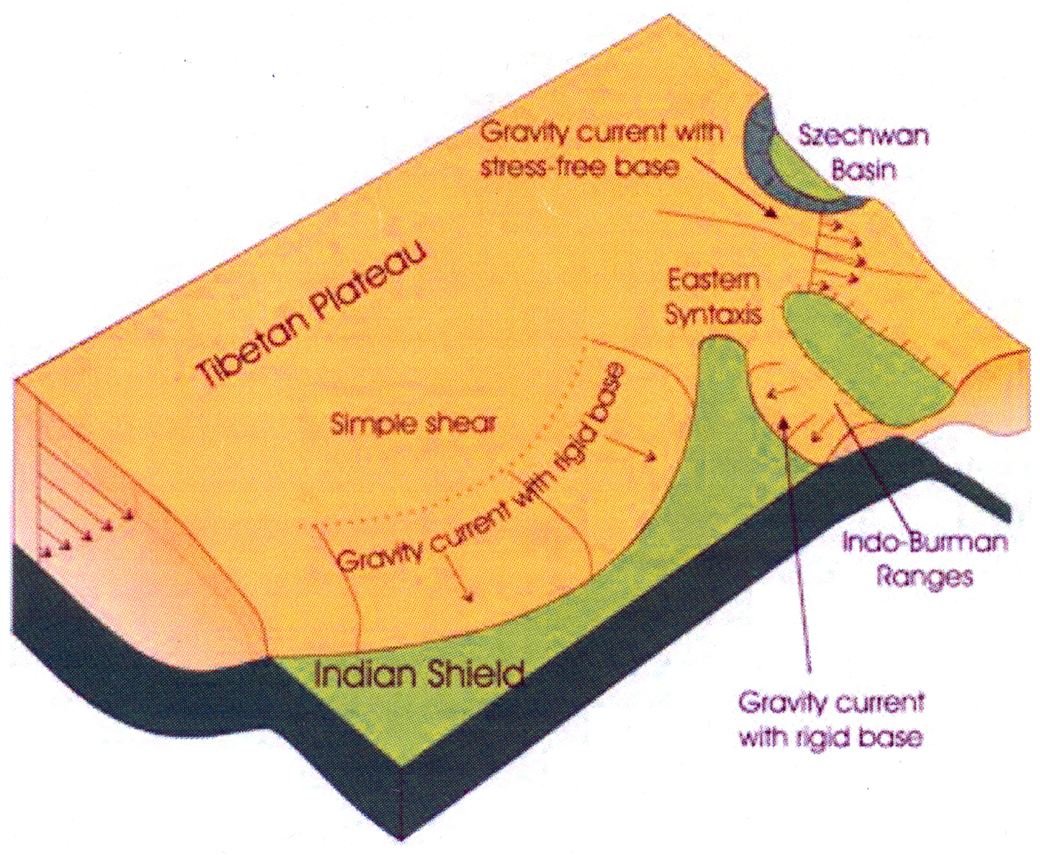
A cartoon Copley and McKenzie (2007) showing the southward flow of the Tibettan crust over the rigid underthrusting Indian plate, using the fluid flow equations of Newtonian rheology, driven by topographically exerted pressure gradients. A viscosity of 1020 Pa s, reproduced the surface velocities at Muth and Leh in Ladakh, determined by Jade et al. (2005), vide the previous figure.