Geochemistry
Analytical techniques
Basalt, amphibolite and dolerite dyke samples, collected from wide spread localities from the study area (Fig.1a, 1b and 1c) were broken into small pieces using steel mortar. These were then reduced into small chips using jaw crusher. These were thoroughly washed, air dried and homogenised before making fine powder of -230 mesh using agate mills. The fine powdered samples were used for the analysis of major and trace elements including the rare earth elements at NGRI, Hyderabad. Major elements were determined by X-ray fluorescence spectrometry (XRF) (Philips Magix Pro Model 2440). Trace elements including the Rare Earth Elements (REE) were analysed using ICP-MS (Perkin Elmer, Sciex Elan DRC II). The procedure for major and trace analyses is described in Balaram et al. (1996). The analytical data are listed in Tables 1-3.
Table 1. Major element (wt%) and trace elements (in ppm) for Betul Mafic Volcanics
| Samples | ND1 | ND06 | ND07 | ND12 | ND13 | ND14 | ND15 | ND16 | ND17 | ND18 | ND19 | ND20 | ND21 |
|---|---|---|---|---|---|---|---|---|---|---|---|---|---|
| SiO2 | 51.89 | 48.46 | 53.29 | 50.19 | 49.25 | 49.33 | 48.99 | 44.88 | 49.99 | 51.74 | 56.03 | 49.98 | 53.9 |
| Al2O3 | 8.99 | 11.72 | 11.07 | 13.55 | 12.93 | 12.33 | 11.48 | 9.92 | 12.96 | 12.31 | 10.58 | 9.78 | 12.91 |
| Fe2O3 | 11.98 | 13.06 | 11.96 | 12.49 | 14.02 | 14.59 | 12.89 | 16.49 | 11.9 | 13.12 | 10.95 | 12.76 | 12.47 |
| MnO | 0.25 | 0.2 | 0.18 | 0.16 | 0.16 | 0.18 | 0.17 | 0.22 | 0.17 | 0.18 | 0.2 | 0.18 | 0.17 |
| MgO | 9.68 | 9.99 | 7.4 | 7.06 | 7.65 | 7.21 | 9.74 | 18.94 | 8.07 | 7.71 | 5.59 | 9.46 | 6.81 |
| CaO | 12.58 | 12.23 | 10.26 | 10.45 | 10.09 | 11.33 | 13.48 | 7.66 | 12.53 | 9.8 | 10.97 | 14.33 | 8.08 |
| Na2O | 1.33 | 1.46 | 2.9 | 1.99 | 1.73 | 1.83 | 1.1 | 0.19 | 1.75 | 2.77 | 2.6 | 0.65 | 3.16 |
| K2O | 0.67 | 0.47 | 0.21 | 0.86 | 1.14 | 0.65 | 0.3 | 0.12 | 0.5 | 0.35 | 0.27 | 0.49 | 0.17 |
| TiO2 | 0.64 | 0.72 | 0.89 | 1.18 | 1.24 | 1.26 | 0.72 | 0.43 | 0.66 | 0.67 | 0.8 | 0.77 | 0.56 |
| P2O5 | 0.19 | 0.2 | 0.18 | 0.25 | 0.22 | 0.18 | 0.1 | 0.08 | 0.11 | 0.13 | 0.14 | 0.12 | 0.03 |
| LOI | 2.31 | 1.51 | 1.68 | 1.02 | 0.89 | 0.97 | 0.78 | 0.82 | 1.62 | 0.87 | 2.02 | 1.73 | 1.6 |
| Total | 100.51 | 100.02 | 100.02 | 99.2 | 99.32 | 99.86 | 99.75 | 99.75 | 100.26 | 99.65 | 100.15 | 100.25 | 99.86 |
| Trace Elements | |||||||||||||
| Sc | 28 | 28 | 43 | 33 | 34 | 41 | 35 | 22 | 33 | 39 | 38 | 33 | 36 |
| V | 171 | 190 | 225 | 203 | 273 | 337 | 224 | 142 | 215 | 216 | 212 | 199 | 204 |
| Cr | 422 | 92 | 183 | 58 | 82 | 75 | 219 | 389 | 111 | 92 | 73 | 83 | 79 |
| Co | 68 | 38 | 52 | 42 | 46 | 43 | 61 | 75 | 40 | 46 | 47 | 33 | 49 |
| Ni | 574 | 101 | 98 | 68 | 72 | 57 | 193 | 582 | 73 | 65 | 49 | 44 | 64 |
| Cu | 22 | 46 | 66 | 102 | 127 | 103 | 143 | 16 | 83 | 81 | 45 | 22 | 20 |
| Zn | 108 | 64 | 72 | 58 | 60 | 68 | 63 | 53 | 50 | 64 | 68 | 53 | 51 |
| Ga | 12 | 14 | 12 | 18 | 17 | 18 | 13 | 9 | 14 | 15 | 12 | 16 | 11 |
| Rb | 7 | 10 | 3 | 10 | 9 | 8 | 4 | 2 | 5 | 5 | 5 | 11 | 2 |
| Sr | 259 | 280 | 98 | 260 | 203 | 212 | 217 | 23 | 237 | 240 | 272 | 112 | 230 |
| Y | 17 | 20 | 20 | 24 | 22 | 21 | 14 | 12 | 15 | 17 | 21 | 19 | 16 |
| Zr | 65 | 61 | 75 | 114 | 90 | 91 | 41 | 23 | 49 | 57 | 83 | 53 | 58 |
| Nb | 3 | 2 | 4 | 5 | 3 | 5 | 2 | 5 | 4 | 4 | 4 | 4 | 3 |
| Ba | 351 | 110 | 124 | 388 | 319 | 357 | 295 | 92 | 121 | 190 | 114 | 99 | 144 |
| La | 26.01 | 6.63 | 11.33 | 13.66 | 9.93 | 9.49 | 4.77 | 6.95 | 7.36 | 7.31 | 9.72 | 7.81 | 4.88 |
| Ce | 50.09 | 13.66 | 24.88 | 28.94 | 21.01 | 20.85 | 10.53 | 14.15 | 15.35 | 15.29 | 21.40 | 15.37 | 10.48 |
| Pr | 4.61 | 1.53 | 2.65 | 3.01 | 2.22 | 2.24 | 1.12 | 1.48 | 1.58 | 1.62 | 2.28 | 1.64 | 1.23 |
| Nd | 22.52 | 9.11 | 14.89 | 16.65 | 12.63 | 12.45 | 6.30 | 7.39 | 8.48 | 9.09 | 12.76 | 8.93 | 7.51 |
| Sm | 3.70 | 2.15 | 3.05 | 3.38 | 2.75 | 2.92 | 1.57 | 1.41 | 1.75 | 1.96 | 2.85 | 1.97 | 1.80 |
| Eu | 1.12 | 0.90 | 0.86 | 1.41 | 1.17 | 1.21 | 0.72 | 0.60 | 0.76 | 0.77 | 0.87 | 0.70 | 0.75 |
| Gd | 4.97 | 2.86 | 3.97 | 4.75 | 3.80 | 4.01 | 2.20 | 1.97 | 2.45 | 2.87 | 4.00 | 2.88 | 2.45 |
| Tb | 0.54 | 0.45 | 0.57 | 0.67 | 0.57 | 0.60 | 0.36 | 0.26 | 0.38 | 0.45 | 0.58 | 0.43 | 0.40 |
| Dy | 2.38 | 2.49 | 3.04 | 3.53 | 2.97 | 3.18 | 2.09 | 1.34 | 2.12 | 2.45 | 3.20 | 2.47 | 2.19 |
| Ho | 0.47 | 0.54 | 0.63 | 0.71 | 0.62 | 0.68 | 0.46 | 0.31 | 0.47 | 0.54 | 0.69 | 0.55 | 0.47 |
| Er | 1.70 | 1.88 | 2.16 | 2.37 | 2.00 | 2.16 | 1.56 | 1.04 | 1.52 | 1.78 | 2.28 | 1.83 | 1.47 |
| Tm | 0.27 | 0.31 | 0.35 | 0.39 | 0.31 | 0.36 | 0.27 | 0.18 | 0.25 | 0.29 | 0.37 | 0.29 | 0.25 |
| Yb | 1.39 | 1.63 | 1.81 | 2.05 | 1.73 | 1.97 | 1.42 | 1.01 | 1.41 | 1.68 | 2.13 | 1.67 | 1.37 |
| Lu | 0.21 | 0.25 | 0.27 | 0.30 | 0.26 | 0.28 | 0.22 | 0.16 | 0.22 | 0.24 | 0.32 | 0.26 | 0.20 |
| Pb | 2.44 | 3.70 | 3.77 | 2.81 | 2.52 | 3.27 | 9.31 | 2.38 | 2.87 | 4.17 | 3.93 | 7.39 | 2.48 |
| Th | 3.49 | 0.46 | 1.50 | 1.63 | 0.97 | 1.14 | 0.62 | 0.73 | 0.82 | 1.05 | 1.44 | 0.95 | 0.79 |
| U | 1.21 | 0.57 | 0.82 | 0.58 | 0.53 | 0.65 | 0.77 | 0.54 | 0.53 | 0.74 | 0.69 | 0.94 | 0.38 |
| Mg# | 47.31 | 45.95 | 40.75 | 38.58 | 37.75 | 35.45 | 45.65 | 56.07 | 42.98 | 39.51 | 36.20 | 45.17 | 37.77 |
Table 2. Major element (wt%) and trace elements (in ppm) for amphibolite and dolerite dykes from TGC
| Samples | M4 | M5 | M6 | M8 | M10 | M12 | M13 | M16 | M18 | M19 | M20 | M22 | M23 | M25 | M26 |
|---|---|---|---|---|---|---|---|---|---|---|---|---|---|---|---|
| SiO2 | 50.42 | 49.58 | 48.2 | 52.93 | 49.81 | 49.95 | 49.91 | 51.97 | 48.67 | 56.19 | 50.7 | 54.1 | 53.97 | 48.05 | 55.45 |
| Al2O3 | 13.7 | 13.39 | 13.61 | 10.92 | 12.67 | 13.7 | 13.2 | 12.54 | 12.23 | 13.67 | 12.54 | 13.19 | 12.33 | 13.84 | 12.53 |
| Fe2O3 | 13.98 | 14.7 | 13.71 | 13.2 | 15.32 | 13.65 | 14.38 | 14.73 | 16.22 | 8.58 | 11.99 | 10.78 | 12.41 | 10.65 | 9.46 |
| MnO | 0.17 | 0.18 | 0.17 | 0.16 | 0.21 | 0.16 | 0.17 | 0.17 | 0.18 | 0.11 | 0.16 | 0.13 | 0.15 | 0.15 | 0.15 |
| MgO | 5.18 | 5.26 | 5.1 | 5.48 | 5.27 | 5.8 | 5.03 | 4.48 | 5.81 | 5.12 | 7.71 | 5.57 | 5.6 | 10.34 | 5.79 |
| CaO | 9.99 | 10.09 | 10.13 | 11.56 | 9.18 | 10.26 | 9.94 | 8.57 | 9.95 | 4.61 | 13.44 | 5.61 | 9.95 | 13.46 | 13.28 |
| Na2O | 2.41 | 2.34 | 2.4 | 1.75 | 2.34 | 2.16 | 2.22 | 2.27 | 1.99 | 2.37 | 0.74 | 2.13 | 2.74 | 0.94 | 0.79 |
| K2O | 0.67 | 0.7 | 0.64 | 0.42 | 1.04 | 0.78 | 0.72 | 0.87 | 0.4 | 4.78 | 0.29 | 3.75 | 0.31 | 0.18 | 0.24 |
| TiO2 | 2.13 | 2.26 | 2.14 | 2.02 | 2.73 | 1.96 | 2.17 | 2.54 | 2.36 | 2.22 | 0.7 | 2.19 | 0.66 | 0.46 | 0.62 |
| P2O5 | 0.25 | 0.26 | 0.24 | 0.16 | 0.37 | 0.26 | 0.29 | 0.36 | 0.29 | 1.07 | 0.12 | 0.82 | 0.11 | 0.11 | 0.24 |
| LOI | 1.49 | 1.59 | 1.5 | 1.67 | 1.84 | 1.15 | 1.89 | 1.86 | 2.87 | 0.49 | 0.68 | 0.92 | 0.81 | 1.07 | 0.51 |
| Total | 100.39 | 100.35 | 97.84 | 100.27 | 100.78 | 99.83 | 99.92 | 100.36 | 100.97 | 99.21 | 99.07 | 99.19 | 99.04 | 99.25 | 99.06 |
| Trace Elements | |||||||||||||||
| Sc | 33 | 30 | 34 | 25 | 30 | 32 | 32 | 30 | 34 | 15 | 18 | 16 | 40 | 27 | 34 |
| V | 350 | 315 | 356 | 266 | 293 | 339 | 335 | 368 | 390 | 151 | 184 | 156 | 223 | 130 | 221 |
| Cr | 51 | 37 | 42 | 35 | 35 | 38 | 41 | 35 | 42 | 31 | 25 | 31 | 113 | 178 | 119 |
| Co | 47 | 42 | 49 | 36 | 44 | 46 | 45 | 43 | 51 | 23 | 27 | 23 | 52 | 47 | 39 |
| Ni | 31 | 26 | 29 | 23 | 24 | 27 | 27 | 22 | 28 | 15 | 15 | 16 | 35 | 50 | 34 |
| Cu | 214 | 194 | 213 | 214 | 278 | 210 | 195 | 265 | 229 | 59 | 51 | 50 | 34 | 32 | 49 |
| Zn | 116 | 115 | 100 | 75 | 104 | 97 | 94 | 109 | 101 | 89 | 87 | 89 | 101 | 44 | 53 |
| Ga | 25 | 22 | 25 | 16 | 24 | 23 | 23 | 25 | 25 | 23 | 23 | 22 | 19 | 12 | 18 |
| Rb | 14 | 14 | 11 | 7 | 21 | 15 | 12 | 20 | 6 | 105 | 86 | 109 | 5.0 | 2 | 5 |
| Sr | 245 | 232 | 248 | 193 | 225 | 237 | 232 | 177 | 201 | 608 | 599 | 367 | 189 | 136 | 153 |
| Y | 21 | 22 | 20 | 19 | 28 | 21 | 21 | 28 | 19 | 55 | 52 | 62 | 14 | 8 | 11 |
| Zr | 112 | 112 | 109 | 118 | 166 | 116 | 124 | 152 | 93 | 379 | 344 | 299 | 49 | 18 | 32 |
| Nb | 25 | 20 | 22 | 18 | 30 | 19 | 22 | 20 | 15 | 51 | 56 | 45 | 6 | 2 | 3 |
| Ba | 247 | 312 | 236 | 255 | 280 | 248 | 208 | 198 | 161 | 160 | 157 | 95 | 195 | 94 | 117 |
| La | 17.72 | 17.42 | 17.67 | 13.71 | 22.52 | 16.08 | 17.35 | 19.65 | 13.95 | 129.26 | 99.65 | 73.18 | 9.37 | 3.49 | 7.54 |
| Ce | 41.00 | 39.06 | 39.92 | 31.35 | 51.19 | 36.97 | 38.45 | 44.90 | 32.27 | 239.56 | 194.50 | 140.83 | 19.89 | 7.37 | 15.67 |
| Pr | 4.39 | 4.12 | 4.28 | 3.43 | 5.47 | 4.04 | 4.19 | 4.88 | 3.64 | 21.39 | 17.66 | 13.02 | 2.19 | 0.78 | 1.60 |
| Nd | 24.65 | 23.27 | 24.36 | 19.48 | 31.23 | 22.97 | 23.61 | 28.20 | 21.50 | 96.16 | 82.23 | 61.90 | 11.88 | 4.18 | 8.56 |
| Sm | 5.55 | 5.08 | 5.33 | 4.31 | 6.68 | 5.16 | 5.12 | 6.67 | 5.31 | 12.99 | 11.86 | 9.74 | 2.68 | 1.00 | 2.00 |
| Eu | 1.91 | 1.75 | 1.91 | 1.53 | 2.27 | 1.85 | 1.80 | 2.16 | 1.89 | 3.53 | 3.40 | 2.53 | 0.97 | 0.44 | 0.74 |
| Gd | 7.29 | 6.95 | 7.14 | 5.70 | 9.05 | 7.02 | 6.97 | 8.90 | 7.06 | 19.42 | 16.97 | 14.11 | 3.92 | 1.42 | 2.82 |
| Tb | 1.05 | 0.98 | 1.06 | 0.81 | 1.29 | 0.99 | 1.02 | 1.35 | 1.08 | 1.70 | 1.63 | 1.50 | 0.61 | 0.22 | 0.43 |
| Dy | 5.25 | 4.86 | 5.26 | 4.17 | 6.35 | 4.90 | 5.03 | 6.88 | 5.57 | 6.29 | 6.23 | 6.34 | 3.35 | 1.22 | 2.30 |
| Ho | 1.06 | 0.96 | 1.09 | 0.81 | 1.28 | 1.00 | 1.02 | 1.44 | 1.13 | 1.18 | 1.22 | 1.28 | 0.73 | 0.27 | 0.54 |
| Er | 3.38 | 3.00 | 3.38 | 2.59 | 4.02 | 3.15 | 3.027 | 4.37 | 3.57 | 4.04 | 4.13 | 4.18 | 2.49 | 0.90 | 1.79 |
| Tm | 0.53 | 0.48 | 0.53 | 0.41 | 0.62 | 0.50 | 0.50 | 0.72 | 0.56 | 0.52 | 0.56 | 0.63 | 0.43 | 0.16 | 0.32 |
| Yb | 2.95 | 2.62 | 2.93 | 2.21 | 3.35 | 2.67 | 2.79 | 3.88 | 3.11 | 2.89 | 3.11 | 3.46 | 2.36 | 0.82 | 1.78 |
| Lu | 0.44 | 0.38 | 0.43 | 0.32 | 0.50 | 0.39 | 0.42 | 0.56 | 0.46 | 0.41 | 0.45 | 0.52 | 0.36 | 0.13 | 0.28 |
| Pb | 4 | 4 | 3 | 6 | 2 | 3 | 4 | 3 | 2 | 7.5 | 5.5 | 5.0 | 4.6 | 2.5 | 2.6 |
| Th | 2 | 2 | 2 | 2 | 3 | 2 | 2 | 2 | 2 | 8.4 | 4.4 | 6.9 | 1.4 | 0.5 | 1.2 |
| U | 2 | 2 | 2 | 3 | 2 | 1 | 2 | 2 | 2 | 2.5 | 2.0 | 2.0 | 1.7 | 0.6 | 1.6 |
| Mg# | 44.26 | 28.45 | 45.09 | 31.57 | 27.65 | 32.07 | 27.99 | 39.27 | 28.47 | 39.87 | 41.68 | 36.47 | 47.12 | 51.9 | 40.48 |
Table 3. Major element (wt%) and trace elements (in ppm) for amphibolite and dolerite dykes from AGC
| Samples | S1 | S2 | S6 | S10 | S11 | S15 | S19 | S20 | S21 | S22 | S23 | S25 | S33 | S34 |
|---|---|---|---|---|---|---|---|---|---|---|---|---|---|---|
| SiO2 | 49.63 | 49.18 | 50.83 | 49.89 | 47.47 | 48.55 | 47.24 | 47.95 | 46.01 | 49.79 | 49.66 | 47.41 | 48.37 | 48.65 |
| Al2O3 | 13.67 | 13.53 | 8.08 | 13.23 | 11.83 | 11.33 | 11.23 | 11.83 | 10.07 | 11.54 | 12.2 | 10.47 | 11.53 | 11.8 |
| Fe2O3 | 14.28 | 14.33 | 11.79 | 15.27 | 15.77 | 17.55 | 16.56 | 15.29 | 16.47 | 14.07 | 14.77 | 15.7 | 16.96 | 17.51 |
| MnO | 0.2 | 0.2 | 0.14 | 0.22 | 0.21 | 0.23 | 0.23 | 0.19 | 0.19 | 0.27 | 0.19 | 0.23 | 0.22 | 0.24 |
| MgO | 6.01 | 5.93 | 11.36 | 5.85 | 5.75 | 6.3 | 5.28 | 6.16 | 6.8 | 6.27 | 5.81 | 5.12 | 6.73 | 6.03 |
| CaO | 10.54 | 10.47 | 11.9 | 10.24 | 9.99 | 10.04 | 10.46 | 9.71 | 9.58 | 11.58 | 8.42 | 10.05 | 9.96 | 9.12 |
| Na2O | 2.41 | 2.37 | 1.24 | 2.24 | 1.81 | 2.2 | 2.86 | 2.53 | 2.46 | 3.3 | 3.79 | 2.71 | 1.95 | 2.34 |
| K2O | 0.29 | 0.3 | 0.14 | 0.22 | 0.21 | 0.23 | 0.23 | 0.19 | 0.09 | 0.27 | 0.19 | 0.23 | 0.22 | 0.24 |
| TiO2 | 1.74 | 1.7 | 0.94 | 1.47 | 1.21 | 1.08 | 1.66 | 1.42 | 1.69 | 1.59 | 2.04 | 1.4 | 0.92 | 1.22 |
| P2O5 | 0.21 | 0.22 | 0.01 | 0.1 | 0.1 | 0.17 | 0.14 | 0.13 | 0.14 | 0.12 | 0.16 | 0.11 | 0.14 | 0.17 |
| LOI | 0.79 | 0.69 | 1.45 | 0.76 | 1.04 | 1.07 | 1.59 | 0.4 | 1.29 | 0.54 | 0.65 | 0.34 | 0.82 | 0.96 |
| Total | 99.77 | 98.92 | 98.26 | 99.84 | 95.64 | 98.92 | 97.45 | 95.8 | 94.79 | 99.21 | 97.83 | 93.75 | 97.93 | 98.76 |
| Trace Elements | ||||||||||||||
| Sc | 44 | 45 | 52 | 44 | 44 | 46 | 38.2 | 45.9 | 39.7 | 44.5 | 48.6 | 43 | 43 | 42 |
| V | 327 | 334 | 343 | 290 | 290 | 284 | 350 | 375 | 361 | 378 | 370 | 358 | 359 | 318 |
| Cr | 234 | 269 | 538 | 276 | 276 | 123 | 124 | 209 | 197 | 199 | 276 | 198 | 191 | 214 |
| Co | 52 | 51 | 31 | 53 | 53 | 20 | 43 | 24 | 19 | 22 | 48 | 39 | 45 | 43 |
| Ni | 161 | 210 | 172 | 214 | 214 | 39 | 115 | 35 | 31 | 42 | 101 | 72 | 130 | 131 |
| Cu | 97 | 93 | 45 | 190 | 190 | 23 | 186 | 20 | 25 | 75 | 66 | 92 | 229 | 182 |
| Zn | 100 | 101 | 76 | 113 | 113 | 59 | 128 | 85 | 64 | 75 | 142 | 118 | 125 | 119 |
| Ga | 21 | 18 | 11 | 19 | 19 | 10 | 18 | 13 | 11.1 | 10 | 16 | 18 | 18 | 16 |
| Rb | 10 | 9 | 6 | 22 | 22 | 8 | 31.6 | 4.6 | 3.8 | 1.4 | 4.3 | 3.4 | 9 | 9 |
| Sr | 216 | 193 | 143 | 143 | 143 | 68 | 102.6 | 81.7 | 88.4 | 65.5 | 121.3 | 109.6 | 106 | 99 |
| Y | 45 | 41 | 10 | 42 | 42 | 20 | 53.3 | 28.8 | 20.3 | 26.4 | 42.0 | 41.6 | 43 | 41 |
| Zr | 114 | 110 | 36 | 90 | 90 | 46 | 108.3 | 66.1 | 52.2 | 68.2 | 102.8 | 111.8 | 96 | 93 |
| Nb | 7 | 8 | 3 | 7 | 7 | 3 | 5.0 | 4.4 | 3.6 | 4.2 | 6.3 | 7.2 | 6 | 5 |
| Ba | 264 | 201 | 111 | 164 | 164 | 120 | 199 | 36 | 30 | 22 | 94 | 91 | 144 | 98 |
| La | 12.06 | 11.7 | 12.26 | 9.17 | 9.2 | 8.35 | 6.66 | 6.22 | 4.20 | 6.54 | 6.27 | 2.9 | 5.70 | 6.64 |
| Ce | 28.34 | 28.13 | 28.59 | 21.33 | 21.33 | 18.33 | 19.48 | 18.44 | 14.3 | 20.12 | 17.8 | 9.93 | 16.3 | 16.13 |
| Pr | 3.96 | 3.9 | 4.56 | 2.87 | 2.87 | 2.49 | 2.68 | 2.95 | 2.26 | 3.22 | 2.81 | 1.963 | 2.44 | 2.48 |
| Nd | 16.95 | 16.26 | 20.5 | 12.11 | 12.11 | 10.22 | 11.87 | 14.24 | 11.1 | 15.52 | 13.63 | 9.94 | 11.1 | 10.7 |
| Sm | 4.63 | 4.5 | 5.16 | 3.32 | 3.32 | 2.93 | 3.71 | 4.33 | 3.45 | 4.45 | 4.05 | 3.48 | 3.54 | 3.22 |
| Eu | 1.62 | 1.54 | 1.45 | 1.17 | 1.17 | 1.1 | 1.25 | 1.5 | 1.13 | 1.38 | 1.35 | 1.18 | 1.22 | 1.11 |
| Gd | 5.43 | 5.32 | 4.76 | 4.06 | 4.06 | 3.77 | 4.5 | 5.13 | 4.1 | 5.35 | 4.73 | 4.26 | 4.37 | 4.13 |
| Tb | 0.91 | 0.9 | 0.62 | 0.72 | 0.72 | 0.71 | 0.79 | 0.92 | 0.73 | 0.94 | 0.82 | 0.78 | 0.79 | 0.74 |
| Dy | 5.51 | 5.45 | 2.84 | 4.5 | 4.5 | 4.55 | 5.01 | 5.64 | 4.61 | 5.82 | 5.2 | 4.8 | 5.12 | 4.74 |
| Ho | 1.16 | 1.15 | 0.49 | 0.99 | 0.99 | 1.02 | 1.08 | 1.25 | 1.01 | 1.28 | 1.16 | 1.08 | 1.14 | 1.04 |
| Er | 3.09 | 3.00 | 1.14 | 2.61 | 2.61 | 2.78 | 2.9 | 3.32 | 2.63 | 3.44 | 3.06 | 2.814 | 3.11 | 2.87 |
| Tm | 0.47 | 0.47 | 0.15 | 0.42 | 0.42 | 0.45 | 0.45 | 0.5 | 0.39 | 0.52 | 0.45 | 0.43 | 0.5 | 0.47 |
| Yb | 3.02 | 3.01 | 0.87 | 2.77 | 2.77 | 2.94 | 2.95 | 3.31 | 2.62 | 3.46 | 2.96 | 2.82 | 3.32 | 3.07 |
| Lu | 0.45 | 0.45 | 0.12 | 0.42 | 0.42 | 0.44 | 0.44 | 0.496 | 0.39 | 0.51 | 0.435 | 0.42 | 0.5 | 0.47 |
| Pb | 3.5 | 2.0 | 5.8 | 5.3 | 5.3 | 4.0 | 1.9 | 8.3 | 3.8 | 2.9 | 12.3 | 6.3 | 7.6 | 5.5 |
| Th | 2.0 | 2.1 | 2.1 | 2.3 | 2.3 | 2.5 | 1.0 | 4.0 | 0.5 | 0.5 | 0.5 | 0.5 | 1.1 | 1.2 |
| U | 1.0 | 1.0 | 0.5 | 0.6 | 0.6 | 0.5 | 0.4 | 0.1 | 0.1 | 0.1 | 0.1 | 0.1 | 0.2 | 0.2 |
| Mg# | 31.84 | 31.52 | 51.71 | 29.86 | 28.84 | 28.51 | 26.17 | 30.91 | 31.46 | 33.1 | 30.41 | 26.59 | 30.61 | 27.66 |
Alteration and elemental mobility
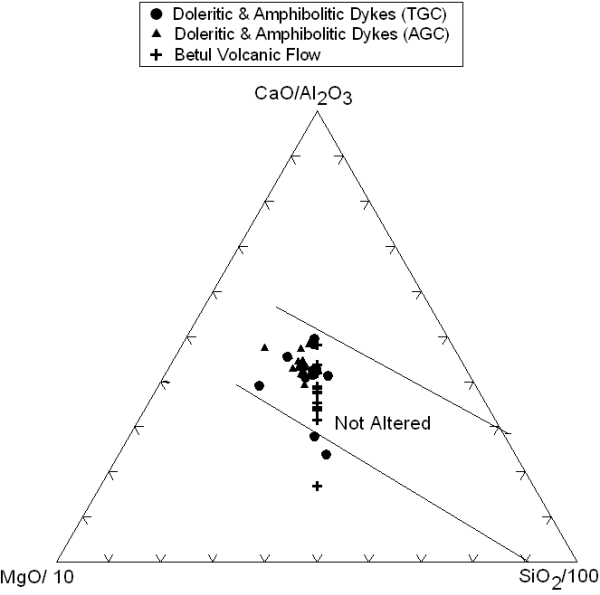
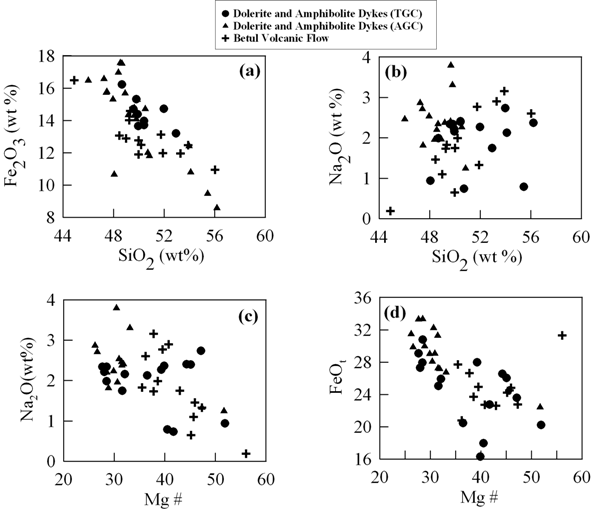
It is widely recognized that in Precambrian rocks some of the elements are mobile during alteration and metamorphism. For this reason, we have tried to select the least altered samples for geochemical analyses. Ternary CaO/Al2O3-MgO/10-SiO2/100 diagram (after Schweitzer and Kroner, 1985); which is widely used to distinguish between altered and unaltered rocks, a majority of the samples plot in the field of unaltered basalts (Fig. 2). Although the REE are considered to be somewhat mobile during alteration (Ludden and Thompson, 1979), the regularity of REE patterns in all the studied samples suggests that the REE were not significantly perturbed during alteration and metamorphism. Elements such as Zr, Y, Nb, Ti, Cr, and Ni are generally considered to be less mobile during low-temperature alteration and low-grade metamorphism (Murphy and Hynes 1986; Staudigel and Hart 1983; Grant 1986; Pearce and Norry 1979; Saunders et al., 1980; Shervais 1982). For our petrogenetic interpretation we will use only those elements that are observed to be least mobile. Our samples of mafic volcanics and dykes are either least metamorphosed (dolerite) or have been metamorphosed from greenschist to amphibolites grade. Igneous trends for various major elements vs SiO2 and Mg# in the Harker plots (Fig.3) indicate that among the major elements all the elements, except for Na2O and K2O, are not perturbed by post crystallization alteration.
Figure 2. CaO/Al2O3-MgO/10-SiO2/100 ternary diagram
CaO/Al2O3-MgO/10-SiO2/100 ternary diagram of the studied rocks sample showing their unaltered nature (Schweitzer and Kroner, 1985).
Figure 3. Harker variation diagram
Harker variation diagram showing (a) SiO2 vs. Fe2O3 wt%, (b) SiO2 vs. Na2O wt%, (c) Mg# vs. Na2O wt% and (d) Mg# vs. Fe2O3 wt% for the mafic volcanic and dykes from TGC and AGC.
Geochemical results
Most of the samples show large variation in their elemental concentration. For example, SiO2 which plays an important role in the determination of various rock types ranges from 44.88 wt% to 56.03 wt% with an average of 50.60 wt% for the Betul mafic volcanics. Fe2O3 contents in these volcanic ranges from 10.9 wt% to 16.4 wt% with an average of 12.98 wt%. Al2O3 varies from 8.9 wt% to 13.55 wt% with an average of 11.58 wt%. A range of variation is also observed in CaO contents. It ranges from 7.66 wt% to 14.33 wt% with an average of 11.06 wt%. TiO2 show fewer variations from 0.43 wt% to 1.26 wt% with an average of 0.81 wt%. P2O5 ranges between 0.03 wt% and 0.25 wt% with an average of 0.15 wt%.
We have plotted some of the major elements against SiO2 and Mg# to understand the differentiation processes for the studied samples. In SiO2 and Mg # Vs Fe2O3 diagrams (Fig. 3a and 3d); two distinct trends are depicted by the dykes and the mafic flow samples. The dyke samples of dolerite and amphibolites of the AGC have restricted variation of FeOt and Mg# compared to those from TGC, although they overlap each other showing well defined negative trends (Fig.3d). The plots indicate tholeiitic affinity and magma evolution through olivine and pyroxene fractionation causing decrease in Mg#. The two distinct trends for the Betul mafic volcanics and the dykes probably indicate that these rocks have undergone independent petrogenetic histories. In the case of Na2O vs Mg# and SiO2 (Fig. 3b and 3c) no clear trend is observed which may indicate mobile nature of these elements during post crystallization processes.
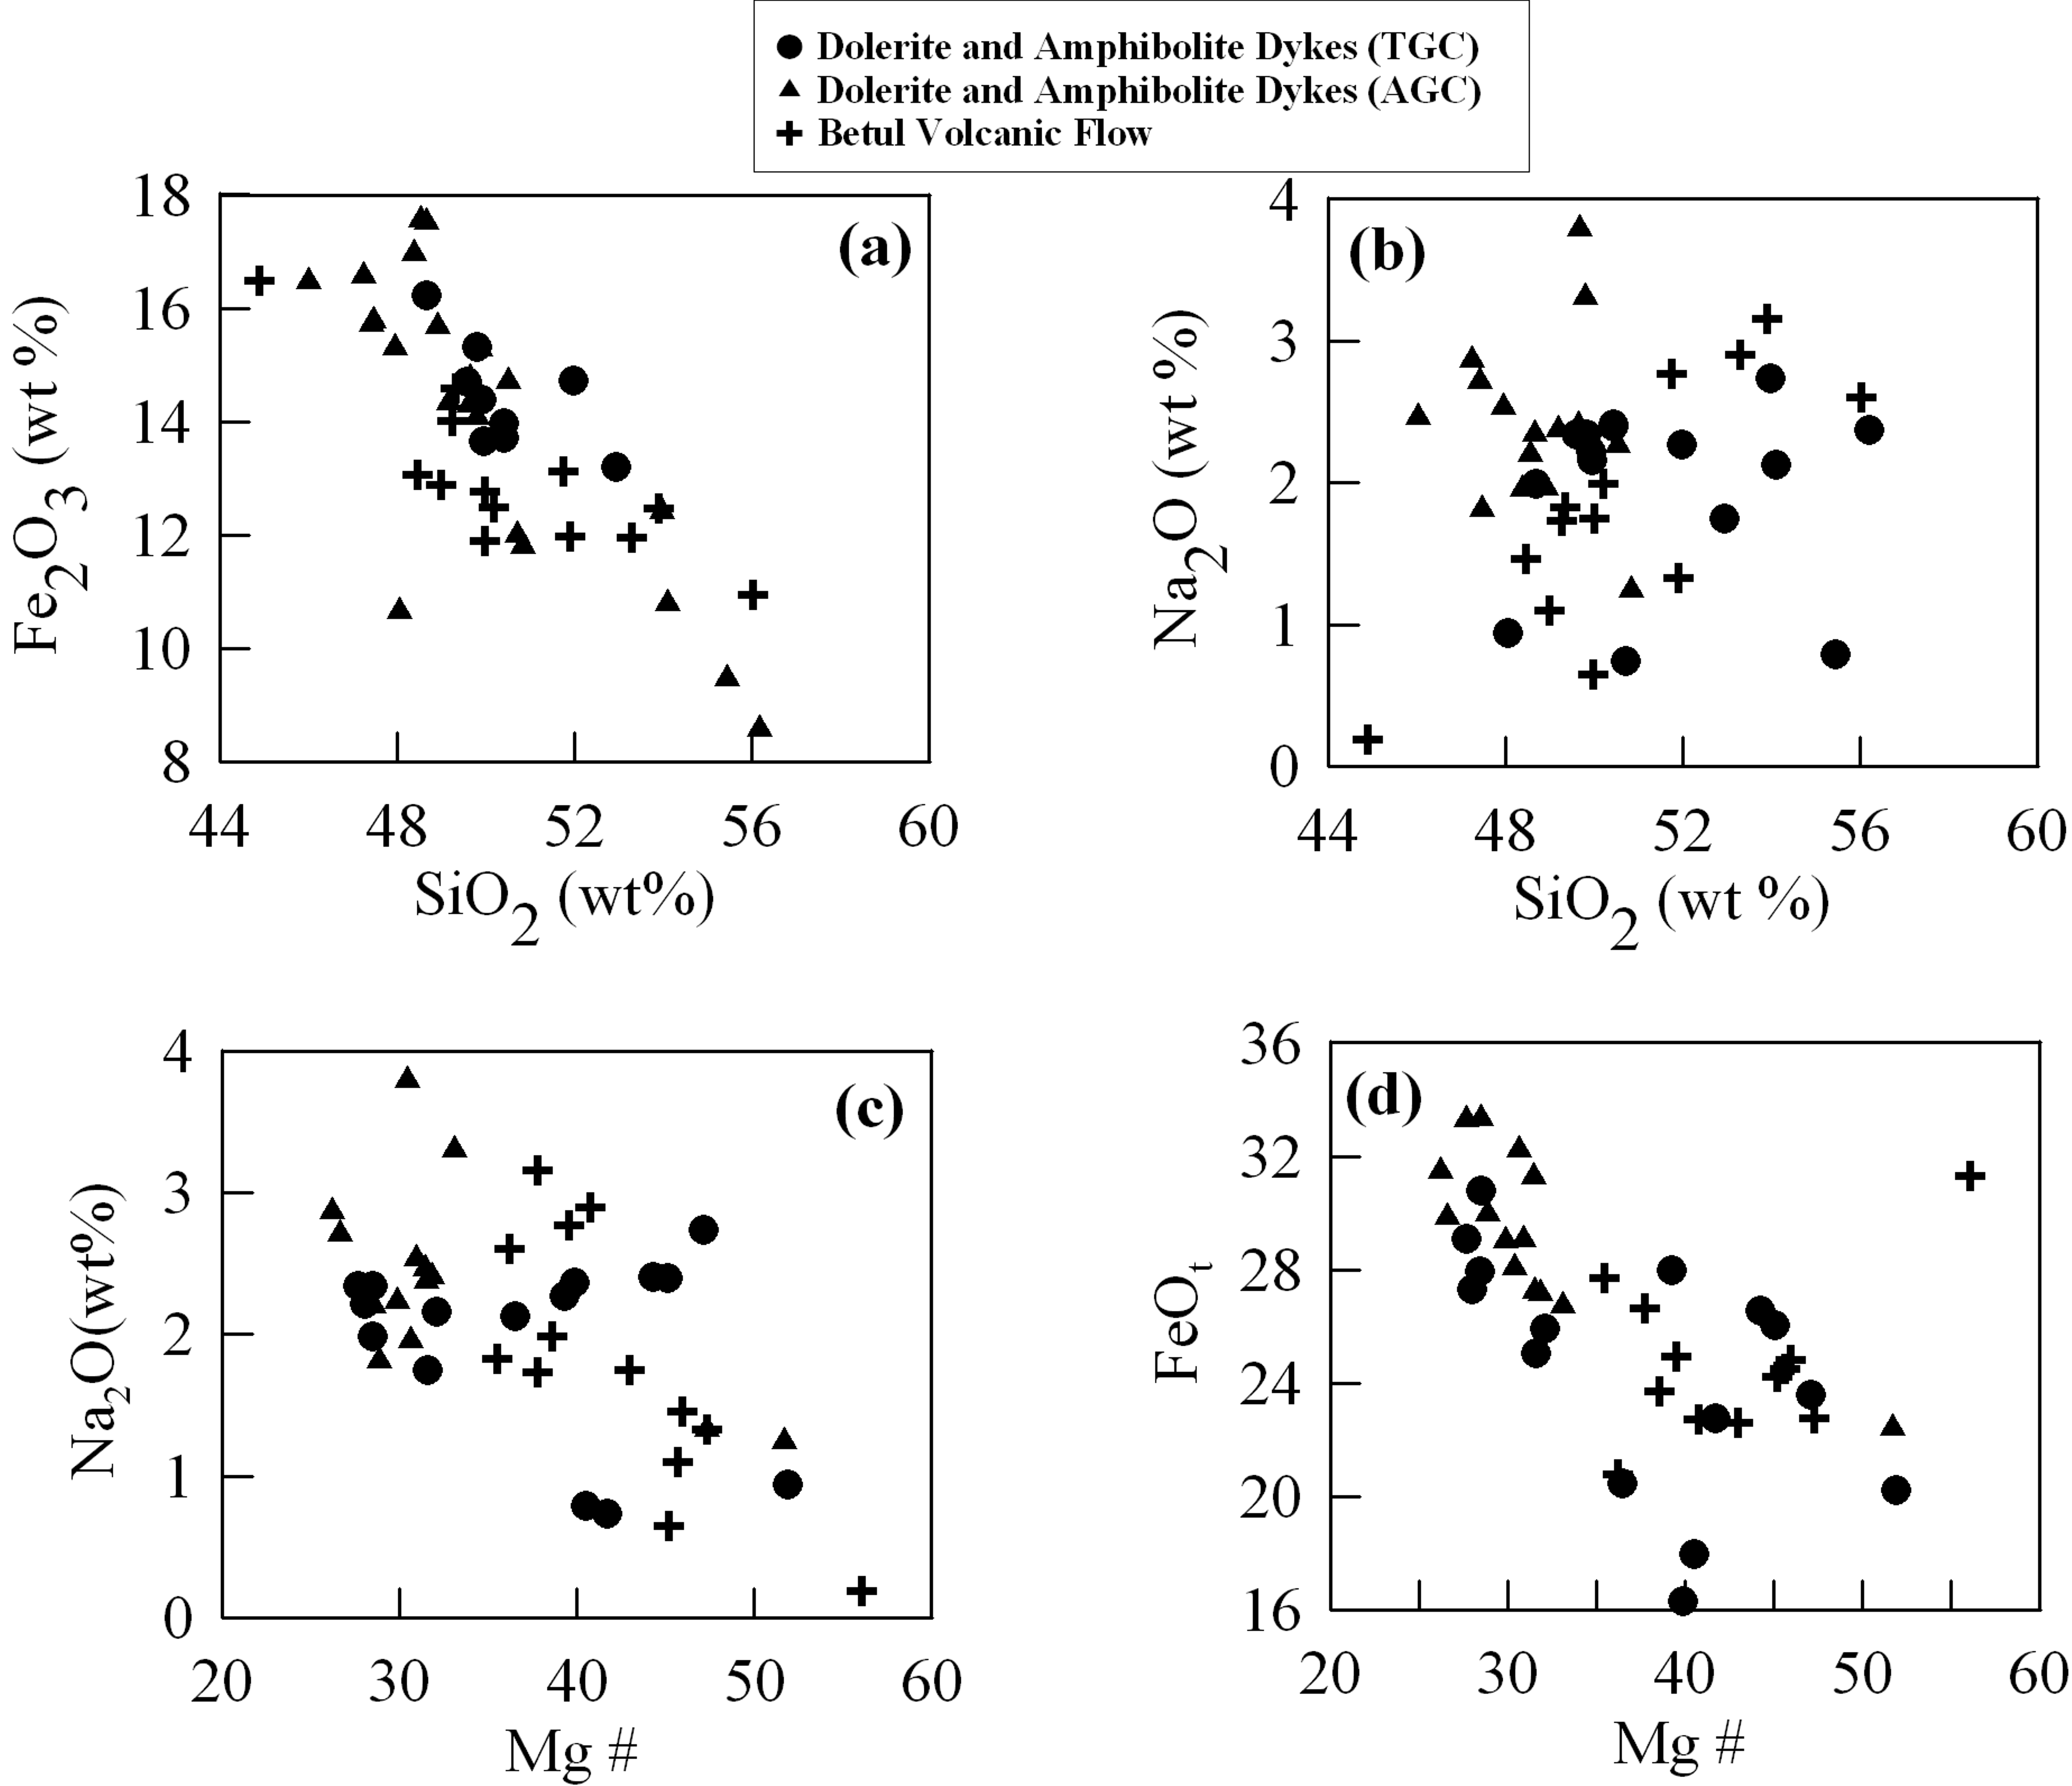
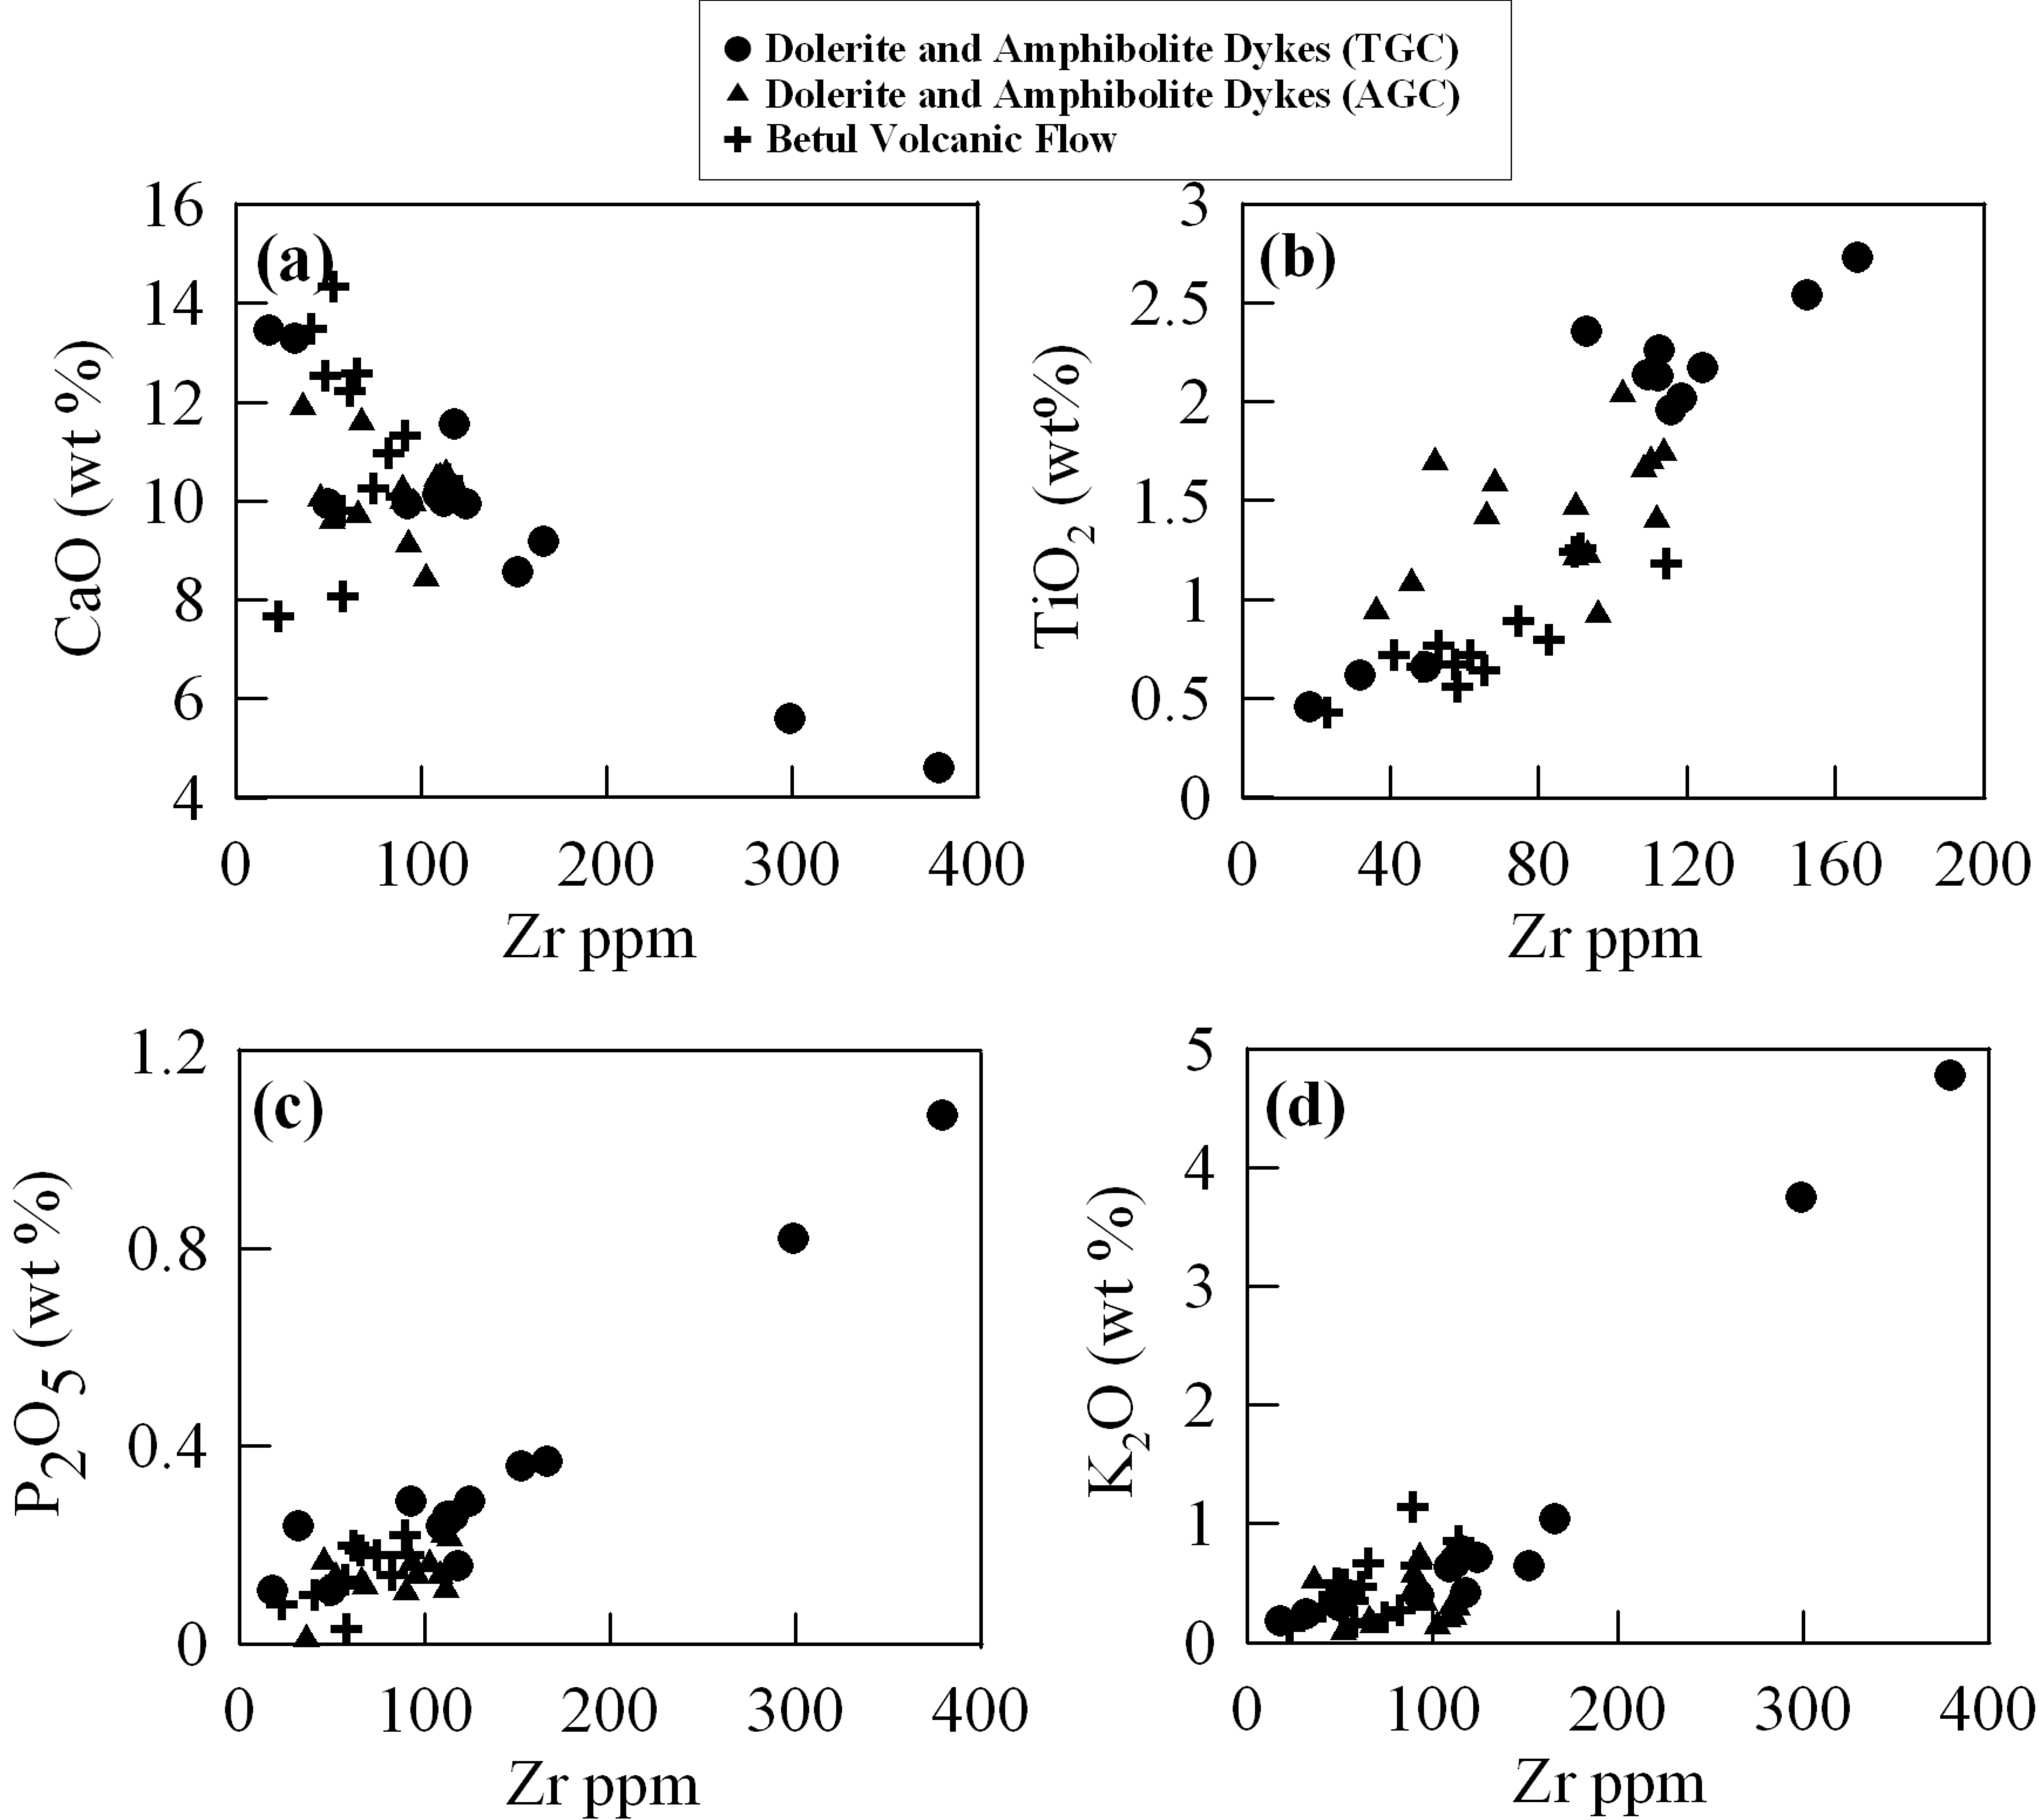
Figure 4 is a series of binary plots where some of the major elements are plotted against Zr. During low grade metamorphism Zr is considered to be relatively immobile (Floyd and Lees, 1976; Winchester and Floyd. 1977; MacDonald et al., 1988). Because of this reason we have used Zr content as a parameter for evaluating the elemental mobility and to understand the differentiation of magma series. CaO vs. Zr (Fig.4a) show negative relationship while TiO2, P2O5, and K2O vs Zr (Fig. 4b, 4c, and 4d) respectively show positive trend. These relationships probably indicate near primary magmatic characteristics for these major elements.
Figure 4. Binary plots of major elements vs Zr

Binary plots of (a) Zr vs CaO, (b) Zr vs. TiO2, (c) Zr vs. P2O5 and (d) Zr vs. K2O for the mafic volcanic and dykes from TGC and AGC.
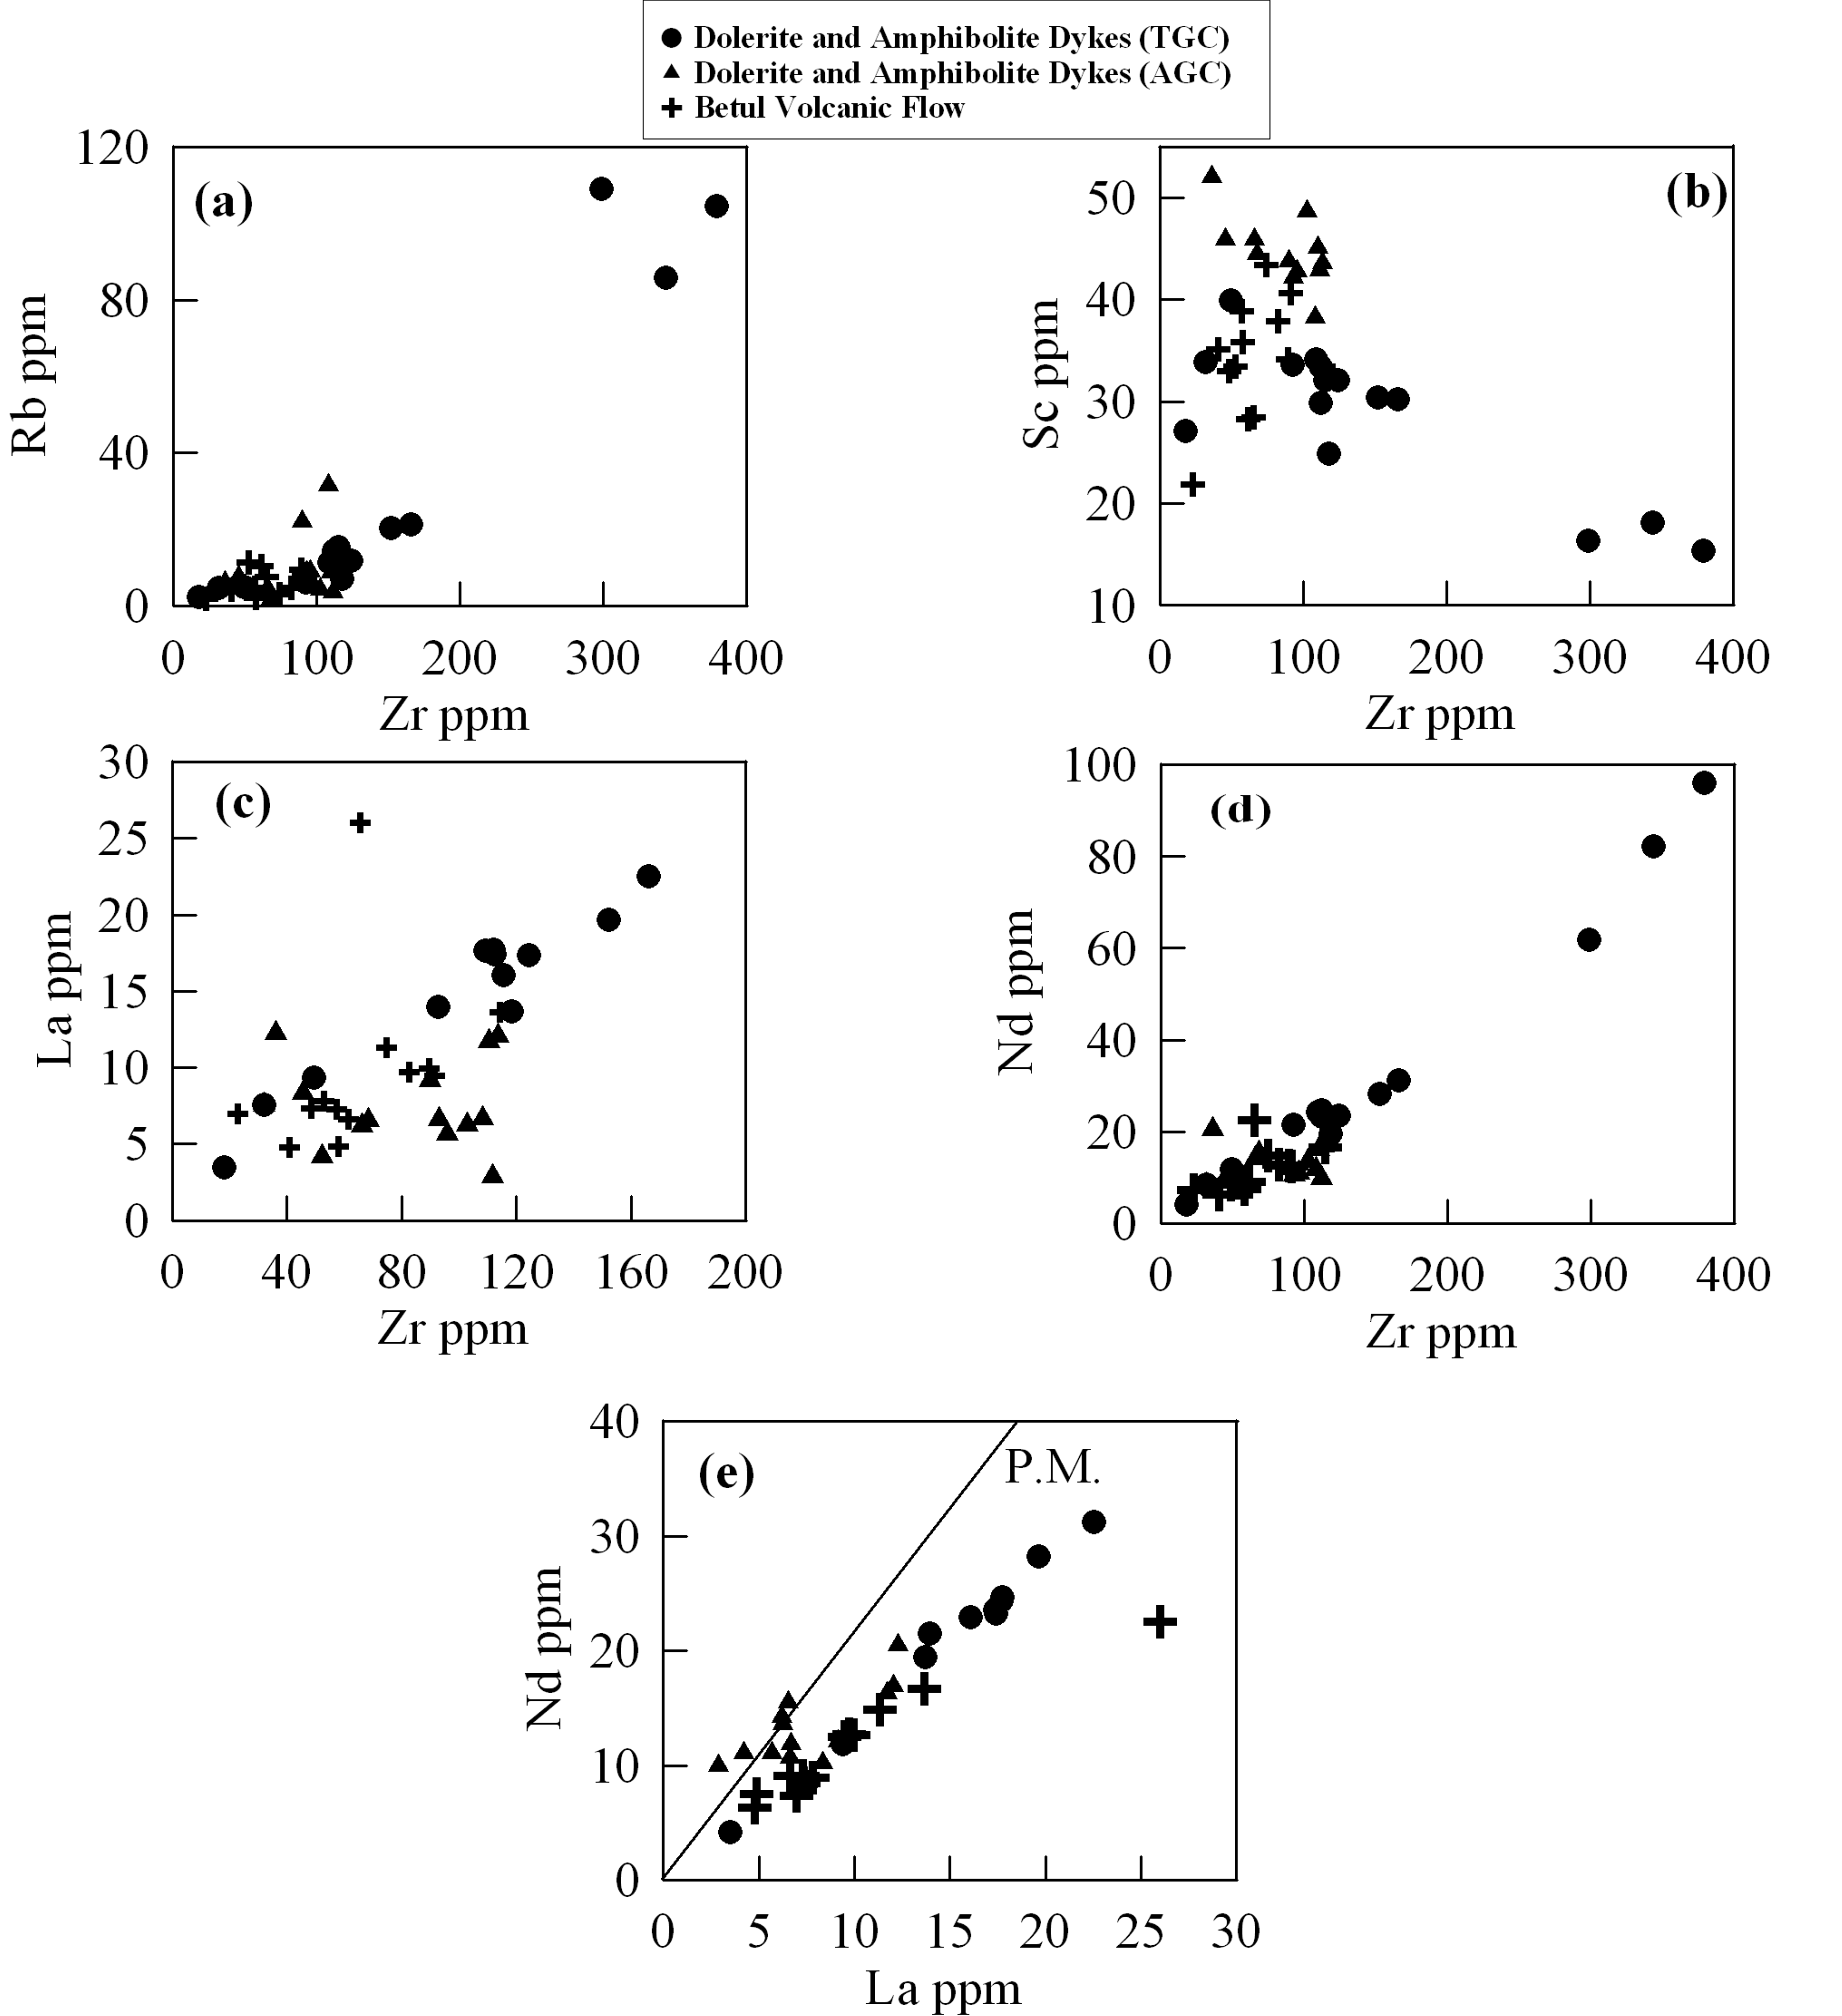
Figure 5 is series of binary plots where some trace such as La, Nd, Rb and Sc, are plotted against Zr, Nd is also plotted against La. All these elements have different compatibilities for basaltic /gabbroic phases (olivine, orthopyroxene, Clinopyroxene and plagioclase). These plots display magmatic trends in the form of positive relationship between Rb-Zr, La-Zr, Nd-Zr, Nd-La and with slightly perturbed negative relationship between Sc-Zr (Fig. 5b).the latter could have been affected by secondary processes to some extent. Thus most of the major and trace elements appear to have been least perturbed by post crystallisation processes and may represent near primary characteristics.
Figure 5. Binary plots of trace elements vs Zr

Binary plots of (a) Zr vs. Rb, (b) Zr vs. Sc, (c) Zr vs. La, (d) Zr vs. Nd and (e) La vs. Nd for the mafic volcanic and dykes from TGC and AGC.
In Figure 5d and 5e, all the data plots toward Nd and La side compared to the primitive mantle ratio line for Zr/Nd and La/Nd ratios. During melting of mantle sources Nd behaves more incompatibly than Zr and La behaves more incompatibly than Nd. Plots of the data points in these diagrams (Fig. 5d and 5e), therefore, indicate their derivation from lower degrees of partial melting of enriched mantle sources relative to primitive mantle.
Magma type
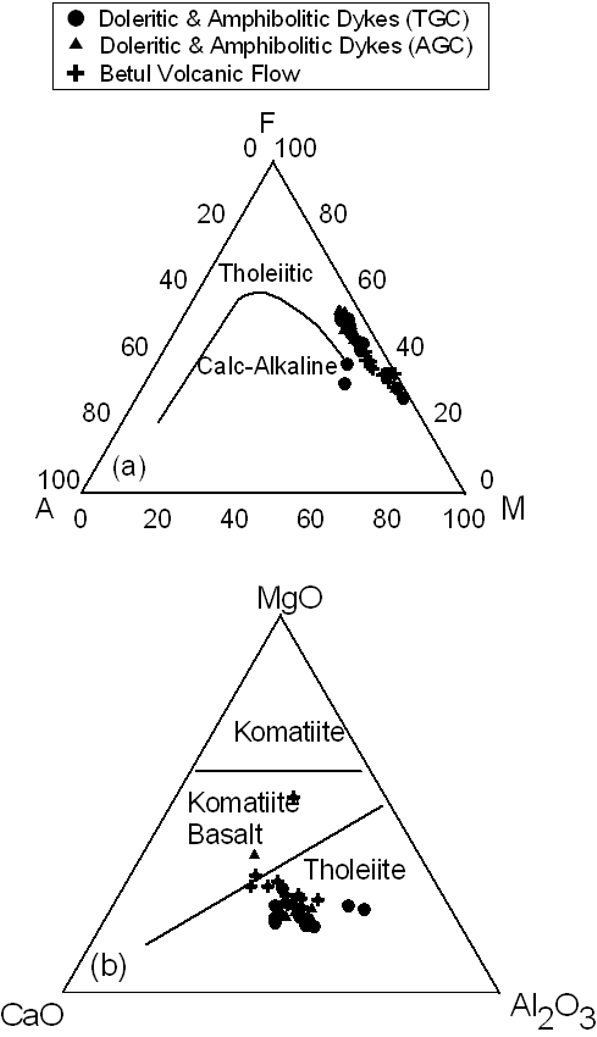
A number of simple diagram are commonly use to characterize different magma types. We reproduce two diagrams here to illustrate the nature of the Betul volcanic rocks and the dykes traversing through Tirodi and Amgaon Gneissic Complex (Fig.1). In Figure 6a, the classical AFM diagram shows a typical tholeiitic iron enrichment trend for all the studied samples. Davies et al. (1979) have suggested an equivalent diagram based on the immobile trace elements (Y + Zr vs 100*Ti vs Cr) which are normally immobile during alteration, does show the samples following a clear tholeiitic trend (figure not shown here). In Fig.6b, triangular MgO-CaO-Al2O3 after Viljoen et al. (1982), all the samples depict their tholeiitic nature.
Figure 6. AFM diagram
(a) Plots of A (Na2O+K2O) - F (FeOt) – M (MgO) and (b) MgO-CaO-Al2O3 show the tholeiitic nature for the mafic volcanic and dykes from TGC and AGC. Compositional fields in (a) and (b) after Irvine and Baragar (1971) and Viljoen et al. (1982), respectively.
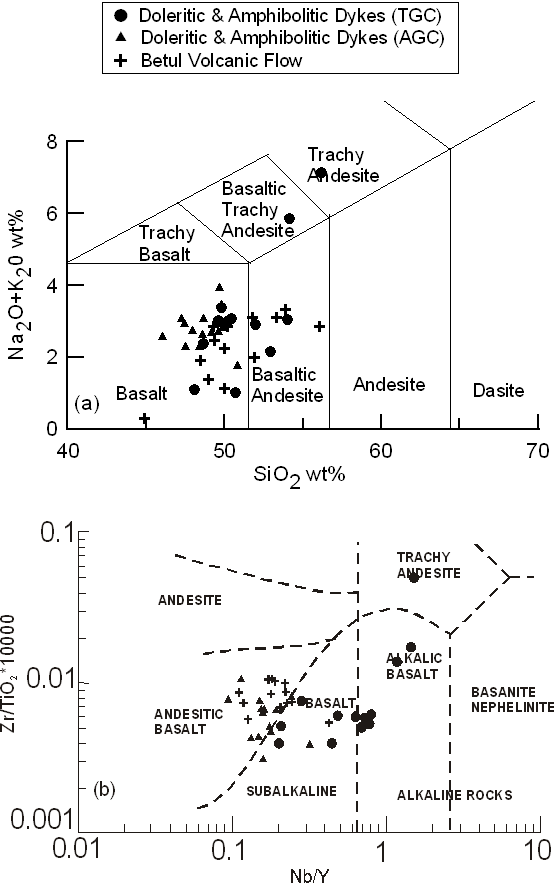
The major element classification of wt% Na2O+K2O versus wt% SiO2 plot (TAS diagram after Le Bas et al., 1986: Fig. 7a) is commonly used in order to classify the rock samples into basalt, basaltic-andesite, andesite, dacite and rhyolite either of sub-alkaline or alkaline series. In Figure 7a all studied samples plot within basalt and basaltic andesite fields, except for two samples (M19 and M22) which plot in basaltic trachy-andesite and trachy-andesite fields respectively. We suggest that mobile nature of Na and K may cause some deviation, but Na2O+K2O together may approximate to the original abundance. This inference is further substantiated by using more robust trace element criteria (Fig. 7b).
Figure 7. TAS diagram and Nb/Y vs. Zr/TiO2 *10000 diagram

(a) Plots of SiO2 vs. Total Alkali (TAS diagram: Le Bas et al., 1986; Le Maiture, 1989) and (b) Nb/Y vs. Zr/TiO2*10000 diagram (Wichester and Floyd, 1978) for the mafic volcanics and dykes from TGC and AGC.
Plot of Nb/Y vs. Zr/TiO2*10000 (Fig.7b) shows the fields for common volcanic rocks (Winchester and Floyd, 1977). In this diagram our rocks plot in subalkaline series that range from basalt to andesitic basalt except three samples that classify as alkaline rocks, like the TAS diagram (Fig. 7a). Since subalkaline series consists of tholeiitic and calc-alkaline series, the AFM plot is useful to indicate tholeiitic nature of the studied samples.
Trace element characterization
Doleritic Dyke (TGC and AGC)
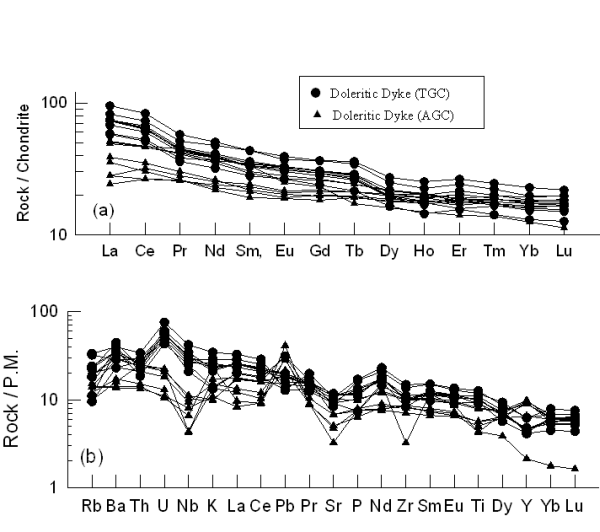
Chondrite normalized rare earth elements (REE) and primitive mantle normalized spidergram plots of the studied mafic magmatic rocks are shown in Figures 8 to 10. Figures 8a and 8b represent the REE and Multi-elements patterns respectively for the doleritic dyke of the both areas. These diagrams show the enriched patterns in which sample of doleritic dyke from Tirodi Gneissic Complex (TGC) are more enriched than doleritic dykes from Amgaon Gneissic complex (AGC) which shows lower REE abundances.
Figure 8. REE and multi-element plot for doleritic dykes from TGC and AGC
(a) C1 normalized rare earth element (REE) patterns and (b) Primitive Mantle (PM) normalized multi-element patterns for doleritic dyke from TGC and AGC. Normalizing values after Sun and McDonough (1989).
The ∑LREE (La-Sm) abundance varies between 72 and 117 ppm for the doleritic dykes from TGC, while for doleritic dyke from AGC the variation is between 39 and 65 ppm. However, the ∑HREE (Gd-Lu) vary from 17 to 28 ppm and from 5 to 32 ppm respectively for the TGC and AGC. Average (La/Yb)N and Zr abundances are 4.25 and 138ppm respectively for doleritic dyke from TGC, while doleritic dyke from AGC has these values as 2.36 and 85ppm, indicating lesser enriched nature for the Amgaon dyke compared to those from TGC. The most primitive sample (S6) from AGC, contain higher Cr abundances of ~538ppm and Ni of ~172ppm, these abundances indicate its derivation of parental magma from a peridotite mantle source. Decrease of Ni to 22-31ppm and Cr to 35-52ppm in the in the dykes of the TGC probably indicate olivine ± spinel ± Cpx fractionation.
Normalised multi-element patterns (Fig. 8b) depict distinct patterns for dolerite from the two regions. AGC samples show strong negative anomalies for Nb and Sr and positive anomaly for Pb. There is also slight depletion of high field strength elements (HFSE) especially Ti and P. The samples from TGC show less pronounced anomalies except for strong positive U anomaly. These chemical features are commonly observed in many of the continental rift volcanic (Weaver and Tarney, 1983; Thompson et al., 1983; Ahmad and Tarney, 1994).
Amphibolitic Dyke (TGC and AGC)
Figures 9a and 9b, represent the normalised REE and multi-elements patterns respectively for the amphibolitic dykes from both the areas. These diagrams show highly enriched patterns for some and not so enriched patterns for other sample of amphibolitic dyke from TGC, probably indicating their derivation from two distinct sources or they represent different degrees of partial melting of similar sources. Amphibolitic dykes from AGC region show nearly flat to slightly LREE depleted patterns, probably indicating their derivation from more primitive mantle source. The abundances of ∑LREE of highly enriched sample of Amphibolitic dykes (M19, M20 and M22) from TGC are varying between 298 and 499 ppm and ∑HREE from 32 to 36 ppm. The lesser enriched samples (M23, M25 and M26) have ∑LREE abundances varying from 16 to 46 ppm and ∑HREE varies between 5 and 14 ppm. The abundances of ∑LREE and ∑HREE for amphibolitic dyke from AGC region vary from 39 to 65 ppm and 28 to 49 ppm respectively. Average (La/Yb)N and Zr abundance are 12.9 and 186ppm respectively for amphibolitic dyke from TGC, while amphibolitic dyke from AGC has these values as 1.16 and 85ppm, respectively.
Figure 9. REE and multi-element plot for amphibolite dykes from TGC and AGC

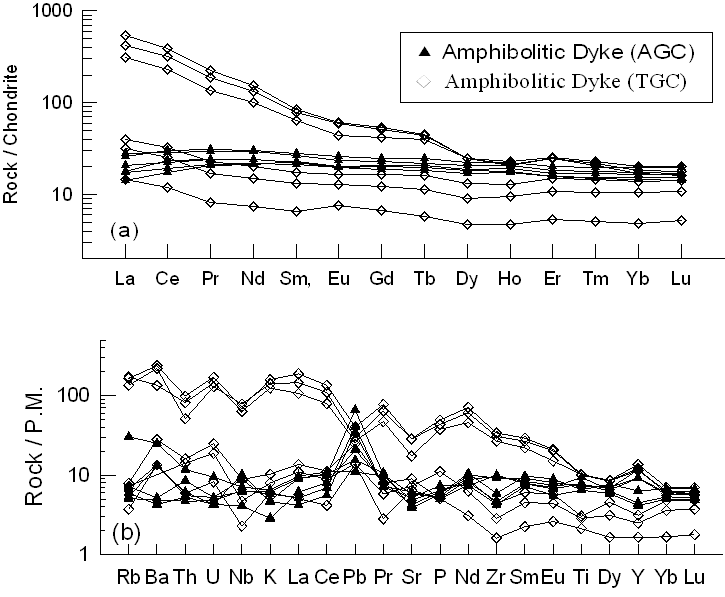
(a) C1 normalised rare earth element (REE) patterns and (b) PM normalised multi-element patterns for amphibolitic dykes from TGC and AGC. Normalizing values after Sun and McDonough (1989).
Betul Volcanic Flow
Chondrite-normalized rare earth elements (REE) and primitive mantle normalized incompatible multi-element patterns for the Betul mafic volcanic are shown in Figures 10a and 10b. These diagrams show enriched pattern for incompatible trace elements especially for the light rare earth elements (LREE) and large ion lithophile elements (LILE). The LREEs are about 20-60 times chondrite and the HREEs are about 10 times chondrite for the mafic volcanic rocks of the area. The multi-element patterns depict negative Nb, P and Ti anomalies for the Betul volcanic rocks (Fig. 10b). In general the REE patterns show less fractionated to nearly flat MREE-HREE patterns. The negative Nb, P and Ti anomalies commonly observed in many Phanerozoic continental rift volcanics (Weaver and Tarney, 1983., Thompson et al., 1983., Ahmad and Tarney, 1994., Ahmad and Rajamani, 1991., and Ahmad and Bhat, 1987), observed anomalies in our samples probably indicate a similar tectonic setting for our study area.
Figure 10. REE and multi-element plot for Betul mafic volcanics
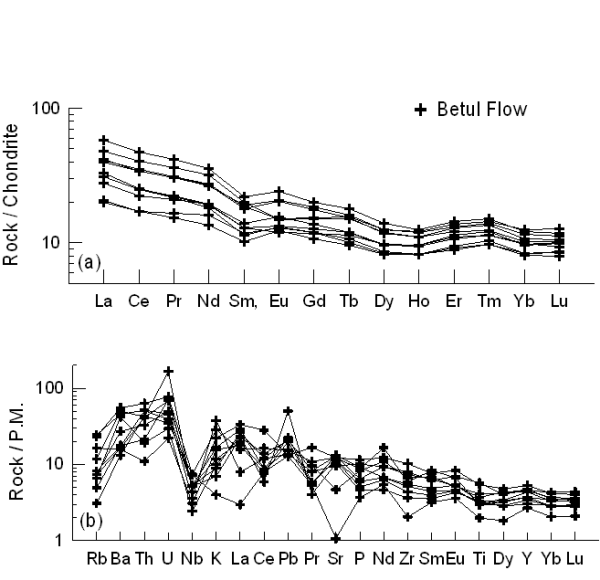
(a) C1 normalized rare earth element (REE) patterns and (b) Primitive Mantle normalized multi-element patterns for Betul volcanic flows. Normalizing values after Sun and McDonough (1989).
The Nb/La and Nb/Ce ratios for the Betul volcanic range from 0.120 to 0.743 and 0.06 to 0.36 respectively. La/Yb and La/Sm ratios range from 3.35 to 18.68 and 2.71 to 7.02. The average values of Nb/La, Nb/Ce, La/Yb and La/Sm for the Betul volcanic samples are 0.422, 0.20, 6.06, and 3.90 respectively. The REE patterns are characterized by fractionated trends with (LaN/YbN = 1.44 to 11.83) probably indicating varying degree of partial melting. No Eu anomaly is observed in any of the REE patterns indicating little role of plagioclase in their genesis.
Sm/Yb is susceptible to the presence or absence of residual garnet in the source. The Sm/Yb ratio varies from 1.10 to 2.65 with an average of 1.47 and the La/Sm ratios are variable between about 2.71 to 7.02 for the Betul mafic samples, which may indicates generation of magma in the absence of garnet, probably indicating shallow depths of magma generation (Huang et al., 2000).The absence of residual garnet in the source is also supported by the REEs patterns (Fig. 10a) which shows the less depletion of HREE. The Nb/La values ranges from 0.12 to 0.74 whereas La/Sm ratio varies between 2.71 to 7.02. Some of the samples show extremely low Nb/La ratios probably suggesting fractionation of titanites or their stabilization in the residual source.
Average values of (Nb/La) and (Nb/Ce) ratios of the doleritic dykes of TGC vary between 1.22 and 0.56 while the ranges for AGC dyke for these ratios are 0.61 and 0.25 respectively. The Average values of (Nb/La) and (Nb/Ce) ratios for the amphibolitic dyke of TGC vary between 0.50 and 0.26 while the values for AGC dyke are 0.94 and 0.31 respectively. These values of doleritic dykes for the TGC and AGC are much higher and lower respectively as com¬pared to Nb/La and Nb/Ce values of primitive mantle which are 1.04 and 0.40. Nb/La and Nb/Ce ratios for AGC amphibolitic dykes close to primitive mantle ratios. The negative Ba anomaly in some samples may be due to either alteration or fractionation of feldspar, hornblende and biotite during genesis of these rocks because Ba substitutes for K in K-feldspar, hornblende and biotite.
Discussion
Three samples of the Betul Mafic volcanics have been analyzed for their Sm-Nd isotopic ratios at the Department of Geology, University of Cambridge, U.K, following the procedure given in Ahmad et al. (2000). The 143Nd/144Nd for the three samples is 0.511653±0.000006 (Sample BT-55), 0.512159±0.000008 (BT-55) and 0.512027±0.000009 (BT-8) (2 sigma error) and 147Sm/144Nd for these samples is 0.1105, 0.15363 and 0.1530886 (1 sigma error) respectively. Calculated depleted mantle model ages for these samples are 1951 Ma, 2054 Ma and 2320 Ma respectively and their εNd(t=2000 Ma) is +2.98, +1.76 and -0.68. These values indicate derivation of the protoliths (for these volcanics) from nearly chondratic to slightly depleted mantle sources during ca. 2320 Ma to 1951 Ma. This information is compatible with similar data available on the associated Tirodi Gneissic Complex (Ahmad et al., 2009) and other published data.
Figure 11 shows the multi-element and REE plots of averages of all the studied samples from different groups. The amphibolitic dyke samples of the TGC have much higher LREE/HREE ratios and LREE enrichment compared to all the studied samples. The dolerite dyke samples from the TGC are less enriched with lower LREE/HREE ratios than the amphibolites from the same area but have higher abundances and LREE/HREE ratios than samples from the AGC and the Betul mafic volcanics. The amphibolite and dolerite samples from AGC have close similarity in terms of LREE abundance and LREE/HREE ratios, prob¬ably indicating that they share common source character¬istics and petrogenetic histories. Samples of the Betul mafic volcanic have lower LREE abundances and LREE/ HREE ratios than all the other studied samples, however, their patterns are parallel to the dolerite and amphibolites samples of the TGC, probably indicating derivation of the volcanic by higher degrees of partial melting of simi¬lar sources as for amphibolites and dolerite from the TGC.
Figure 11. Multi-element and REE and for averages of all group of samples
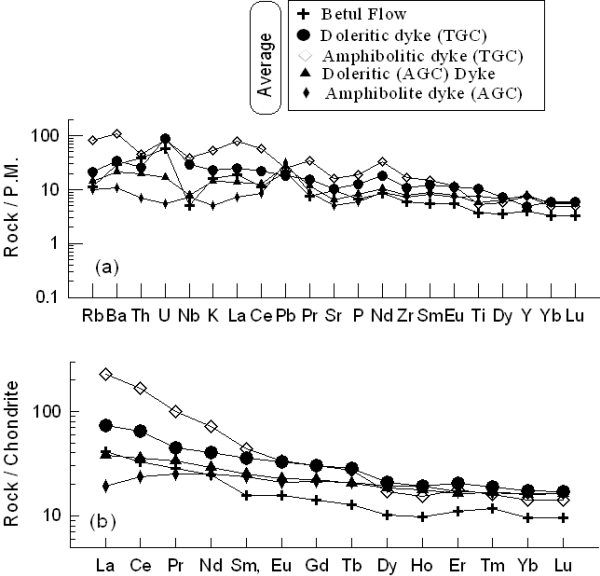
(a) Primitive mantle normalized multi-element patterns, and (b) C1 normalized rare earth element (REE) patterns of the average values for the various groups of mafic magmatic rock samples under consideration. Normalizing values after Sun and McDonough (1989).
The studied samples are plotted in the Zr/Y vs Zr diagram (Fig.12) of Floyd (1993) that shows two calculated partial melting curves (after Drury, 1983) corresponding to two distinct source mineralogy (Curve I: olivine 60% + orthopyroxene 20% + clinopyroxene 10% + plagioclase 10%; Curve II: olivine 60% + orthopyroxene 20% + clinopyroxene 10% + garnet 10%) for Archean mantle source (Sun and Nesbitt, 1977). Most of the doleritic and amphibolitic dykes of TGC and Betul volcanic flow samples plot along curve II indicating derivation from common sources by varying degrees of partial melting. The lateral variation of the TGC dykes probably indicates subsequent fractionation of Cpx ±O1+Plag during the evolution of the magma. The volcanic samples appear to represent relatively higher degrees of partial melting of similar source but appear to have suffered little fractionation of these phases. The AGC samples plot closer to or below the curve I, probably indicating derivation by higher degrees of partial melting at shallower source region.
Figure 12. Zr/Y vs. Zr diagram

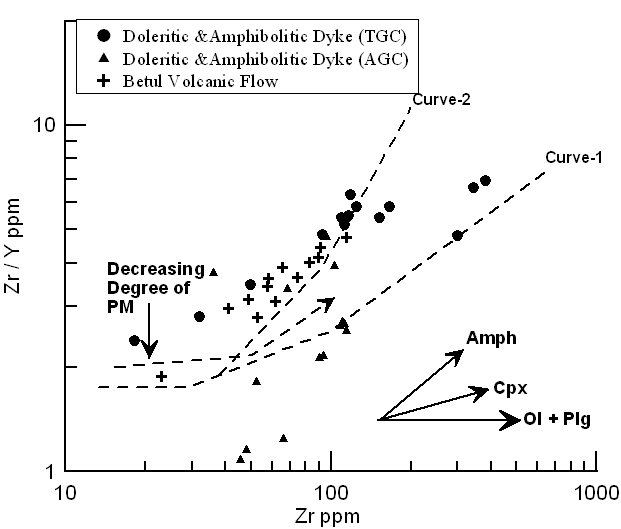
Binary plot of Zr/Y vs. Zr for the mafic volcanic and dyke samples of study area. Melting Curve (I and II) are after Drury (1983); vectors for fractional crystallization are after Floyd (1993).
In Figure 13a samples are plotted in Ni-Ce space showing calculated partial melting curves for primitive mantle (PM) and modified mantle (MM) and a line for fractional crystallisation after Rajamani et al. (1989). It is observed that none of the samples plot along the partial melting curve for PM, but some of the AGC samples do plot closer to that for the MM. All the samples of the TGC plot parallel to the partial melting curve for the MM but with much lower Ni abundances of ~30ppm. This probably indicate their derivation from MM type source followed by severe fractional crystallisation of olivine ± pyroxenes ± plagioclase or they are derived from low degrees of partial melting of mantle sources much more enriched than MM shown in Figure 13a.
Figure 13. Ni-Ce and Ce-Nd diagrams
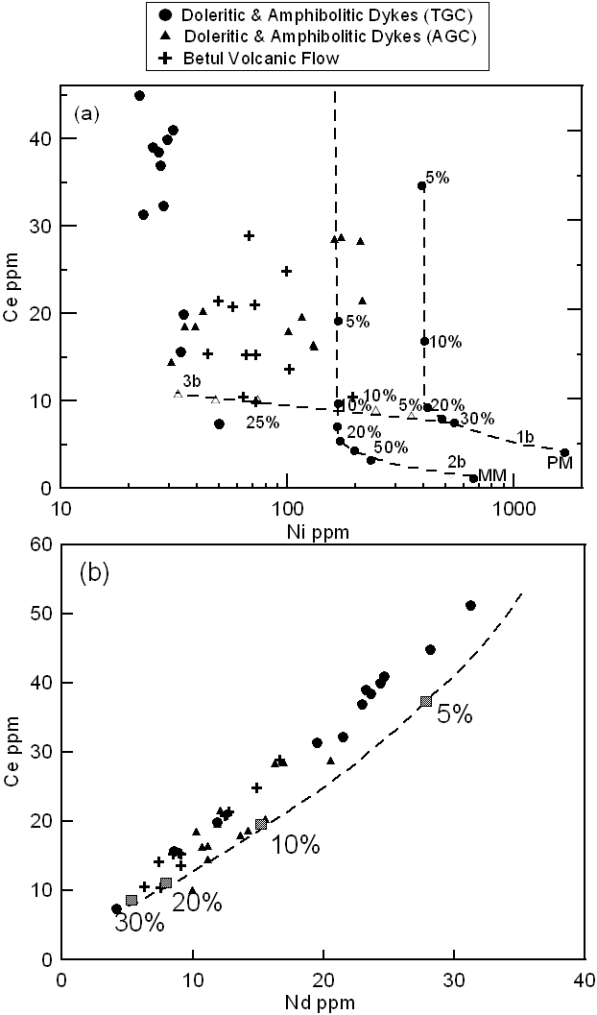
(a) Ni vs Ce plots for the studied samples, lines 1b and 2b are calculated batch melting path for Primitive Mantle (PM) and Modified Mantle (MM), respectively. Line 3b is calculated melt evolution curves for the fractional crystallization (after Rajamani et al., 1989) and (b) Nd vs Ce plot for the mafic magmatic samples of the study area. Calculate partial melting curve (after Ahmad and Tarney, 1991).
In Figure 13b samples are plotted in Ce-Nd diagram, where calculated partial melting curve for primitive mantle is shown after Ahmad and Tarney (1991). All the samples plot parallel to the partial melting curve but on the Ce side with higher Ce/Nd ratio than primitive mantle, probably indicating their derivation from enriched mantle sources as indicated by many other diagrams discussed above. The amphibolites and dolerite samples from TGC show higher abundances of Ce and Nd indicating their derivation from lower (~5-10%) degrees partial melting of an enriched mantle source. The amphibolites and dolerite from the AGC do follow the same partial melting curve but have lower abundance of Ce and Nd than those from TGC, probably indicating derivation of the AGC samples by relatively higher degrees of partial melting. The Betul mafic volcanic samples plot on the same curve but with much lower abundances for Ce and Nd, probably indicating derivation by relatively higher degrees of partial melting than amphibolites and dolerite from the same area (TGC).
Above discussion based on the trace elements characteristics clearly indicate that the studied samples are derived from enriched mantle sources by varying degrees of partial melting followed by fractionation of olivine, pyroxcene and plagioclases for some of the doleritic and amphibolitic samples. The Betul mafic volcanic appear to have suffered little fractional cryatallisation compared to their hypabyssal equivalents.
The tectonic discriminant Ti-V diagram (Fig. 14) after Shervais (1982) is also being used to understand the tectonic setting of the studied samples. The basis of this plot is the variation in the crystal/liquid partition coefficients for vanadium, which range with increasing oxygen fugacity from >1 to <<1. Since the partition coefficient for Ti is almost always <<1, the depletion of V relative to Ti is a function of the ƒO2 of the magma and its source, the degree of partial melting and subsequent fractional crystallization. Most of the studied samples plot in the “Within Plate Basalt (WPB)”/ Rift volcanic field, indicating their emplacement in a rift tectonic environment. This is well supported by the associated continentally derived sediments and huge granitoid basement.
Figure 14. Ti/1000 vs. V diagram
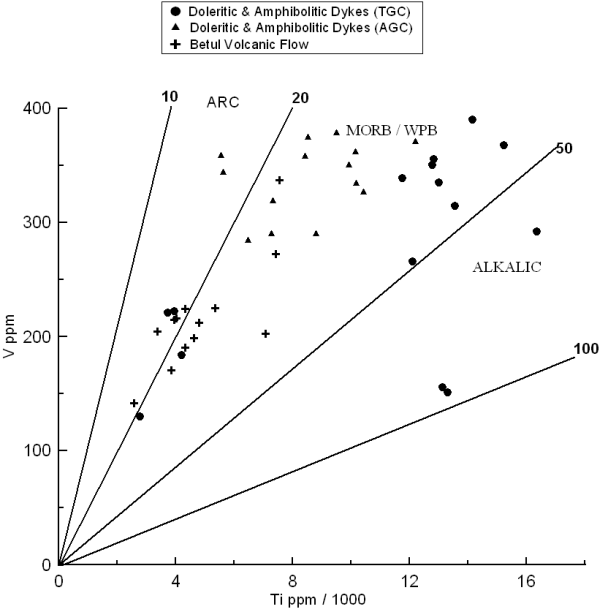
Binary plots of Ti/1000 vs. V diagram indicating within plate setting for the studied mafic magmatic rock samples of the TGC and AGC area. (after Shervais, 1982).