Discussion
This study demonstrates a methodology for displaying multi-dimensional geological data in Google Earth. The animation time range of the granite emplacement model is configured to commence at 488 Ma (Lower Ordovician), and to end at 360 Ma (Late Devonian). These dates were chosen to enable the animation to have a time lapse prior to and following to emplacement of the models. It is herein acknowledged that the display of monthly information on the time-slider is unnecessary, however this appears to be a default component of the Google Earth time-slider. Much of the study area is represented by relatively low-resolution imagery and DTM data, this is not deemed to be a significant issue for this kilometric scale study.
Emplacement Models
The 3D granite emplacement models demonstrate the intrusive episodes of late-Caledonian granites in Connemara during time period of approximately 40 Ma. The Galway Granite batholith is considered by the Leake (1978) to be a stitching pluton that postdates the Skird Rocks Fault (Figure 2). Leake (1978) suggests that Skird Rocks Fault is a splay off the Southern Uplands Fault and a major influence in the siting of the pluton. The emplacement model demonstrates how the near east-west trending major axis of the batholith is almost parallel to the Skird Rocks Fault and Southern Uplands Fault.
3D KML models representing the separate granite units are used to enhance the visual footprint of the units, and to augment the ‘appearance’ of each of the units in relation to their respective emplacement age. The 3D models are not representative of the space form of the granite plutons. The purpose of these visualizations is to demonstrate the geochronology of the emplacement of the Connemara granites. It is herein argued that this method of presenting dynamic visualizations conforms with the principles of congruence and apprehension (Tversky et al. 2002; Dutrow 2007). To satisfy the principle of apprehension, animations must be slow and clear enough for the viewer to perceive movement, change, and any associated temporal components, and to understand changes in the sequence of events. Viewers can control the speed of the Google Earth time-slider, thus maintaining control over the animation speed. The use of interactive animations is known to facilitate learning (Schnotz et al. 1999; Dutrow 2007). The use of coloured 3D volumetric models to represent the granite units is intended to simplify visualization of a complex system of plutonic emplacement.
Fundamental to the success of all geological visualizations is the requirement for the graphical information to be comprehensible by the observer. Tversky et al. (2002) suggest that effective graphics conform to the congruence principle when the content and format of the graphic corresponds to the content and format of the concepts being conveyed. Through the use of volumetric models to represent granite bodies, instead of image overlays or 2D polygons, the concept of a 3D volume of granitic rock is conveyed. The concept of emplacement is presented via the time-slider, giving the viewer the impression of a plutonic mass appearing, or being emplaced. It is the objective of this study to demonstrate the application of Google Earth for communicating 3D geoscience visualizations and the incorporation of a fourth (temporal) dimension to enhance the communicative effectiveness.
Gravity modelling of the Galway Granite batholith indicates a large volume of low-density material extending to maximum crustal depths of 10-12km (Madden 1987). However, the vertical extrusion of the KML granite emplacement models does not reflect the measured thicknesses of the individual granite bodies. Madden (1987) modelled the thickness of the eastern, central and western regions of batholith (Figure 4 and Table 2) using two different density (ρ) contrast values (ρ contrast = [ρ unknown body] – [ρ country rock]). A density value of 2.74 Mgm-3 was used for the country rock. Using a density contrast value of -0.05 Mgm-3 for the Costelloe-Murvey Granite, an estimated thickness of 2-3km is assumed (Madden 1987).
Figure 4. Cross-section of the Galway Granite Batholith showing thickness of the western, central and eastern batholith blocks (after Madden 1987).
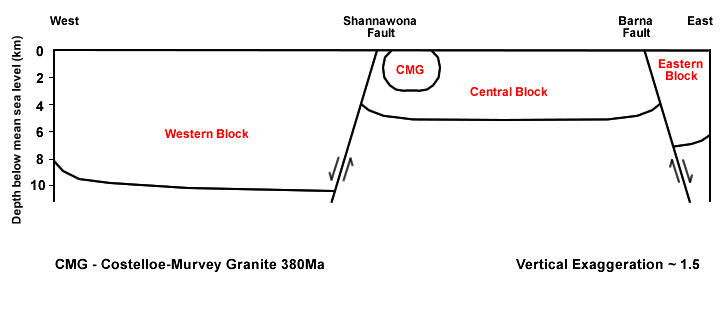
Table 2. Estimated thicknesses of the western, central and eastern batholith blocks as determined from gravity modelling (after Madden 1987)
| Western Block | Central Block | Eastern Block | |
| Model One: ρ contrast = -0.090 Mgm-3 | 8-12km | ~6km | 8-10km |
| Model Two: ρ contrast = -0.11 Mgm-3 | 6-10km | ~5km | 6-8km |
The modelled thicknesses of the granite bodies reflect the depth to the base of the units. Assigning the measured thickness values to the KML models would render the thicker units (western and eastern) to stand proud of the central unit in Google Earth, and effectively invert the batholith. This 3D representation would not reflect the space-form structure of the batholith and would not conform to the principle of congruence (see Tversky et al. 2002). The principle of congruence, when applied to animated visualizations, demands that graphical representations of physical systems should correspond to the true structure of the physical system in reality.
As we have discussed, the age of emplacement of the Inish Granite and Letterfrack Granite is uncertain, and the assumed date of emplacement is pre-410 Ma (Friedrich et al. 1999). The four satellite plutons (Omey, Roundstone, Letterfrack and Inish) are attributed an emplacement date of 420 Ma. To demonstrate the emplacement of the central block prior to uplift (approximately 390-385 Ma), a semi-transparent layer is used to represent the central block granite roof. The semi-transparent layer, corresponding to the ETG, is coloured the same as the associated ETG models. At the estimated time of uplift on the central block, this semi-transparent layer disappears. The remaining surface signature of the granite units corresponds to the most recent map of the Galway Granite batholith (Feely et al. 2006). The generation of a time-based animation of the emplacement events of the Connemara granites emphasizes the potential uses of Google Earth for schematic geochronological visualizations of complex regional geological systems.
Gamma-Ray Spectrometry
This study represents the first correlation of the gamma-ray spectrometry survey data with the recently updated map of the Galway Granite batholith (Pracht et al. 2005). The lithologies of the Spiddal Granite in Feely and Madden (1987) have since been remapped and differentiated into the Knock Granite, Lough Lurgan Granite, Shannapheasteen Granite, Lough Fadda Granite and the MMZ (Pracht et al. 2005; Feely et al. 2006). Through the interpolation of the spectrometry data, controlled by lithological boundaries, the revised series of geochemical maps can be interrogated relative to the currently accepted geology of the Galway Batholith. The regional variations in K, U, Th and HP associated with the Galway Granite support the aforementioned work of Feely and Madden (1987) in showing the geochemical discontinuity across the SFZ.
In particular, the contrast in HP across the SFZ is evident (Figure 5) and in the KMZ maps presented. West of the SFZ, HP values are predominantly in the range of 3-5 μW/m3, while east of the fault values tend to fall mainly in the 1-3 μW/m3 range. This contrast appears to exist across the BFZ also, with higher HP values to the east of the fault. However, due to the low number of survey stations east of the BFZ, this contrast may not be as accurate as in the SFZ region. The Murvey Granite at Roundstone, on at the very western end of the Galway Batholith shows high HP values of 4-6 μW/m3. The CMG displays the highest HP values (5-7.83 μW/m3) measured on the batholith. Two anomalies of HP values exceeding 6 μW/m3 were calculated from radioelement data recorded in the central block (Figure 4). Both values were recorded in aplite veins at Spiddal (6.55 μW/m3) and 10km northeast of the CMG region (6.27 μW/m3). Feely and Madden (1986, Table 3) presented mean HP values for a seven different granite types in Ireland, Britain and New Hampshire, ranging from 1.83 μW/m3 to 8.03 μW/m3. The CMG (6.41 μW/m3) was second only to the Conway Granite (8.03 μW/m3) of New Hampshire (Fehn et al. 1978) and can be considered as a high heat production granite.
Figure 5. Surface Heat Production map of Galway Granite.
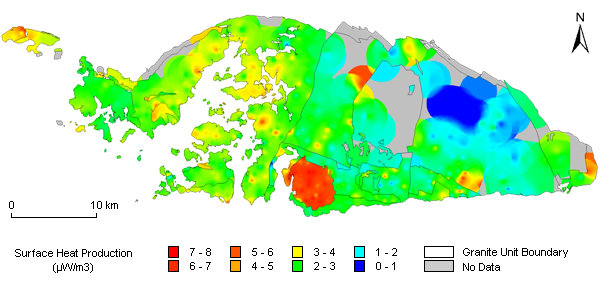
Surface Heat Production map of Galway Granite.