Reconstruction with deformation
To demonstrate the simplest enhancement using deformability, we have re-created the reconstruction of Nürnberg and Müller (1991) with Pplates using deformable meshes. Africa was assigned a motion history for the last 160 Ma from the Global Isochron Charts of Royer et al. (1992) while a submeshes were created within the Northwest Africa, the Parana, the Colorado, and the Salado sub-plates, each assigned to their rotation history from Table 2. As each submesh moved, any consequent intra-plate deformation occurred between them. The final resulting fit at 150 Ma is compared in Figure 7 with the rigid-plate reconstruction of Figure 4.
Figure 7. Deformable Fit Comparison.
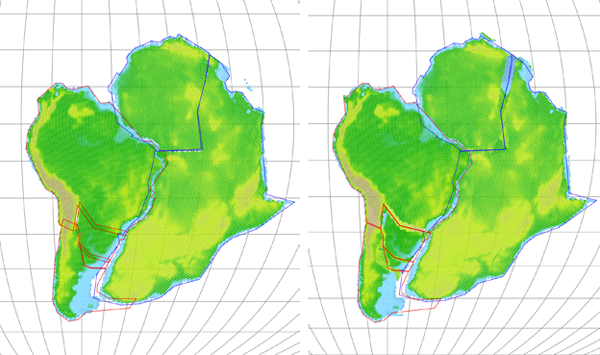
The final fit of Nurnberg and Muller (1991) using deformable continents (right) compared with that of Figure 4 (left) at 150 Ma.
The deformations shown in this reconstruction (Figure 7) were confined to the small areas along the boundaries between the sub-plates. Pplates has represented these extensional regions as compressed relative to modern day. By starting with modern-day topology, assumed isostasy, and crustal volume conserved, Pplates thus calculated an increase in altitude for these regions. Though the detailed distribution of this altitude change depends on the details of the mesh construction and the calibration of the isostatic calculation, when the deformations are spread realistically over the basin regions, we could expect the elevation change to correspond to the depth to the basement of the sediment in the modern-day basins. Pplates has the ability calculate this information given sufficient geological information and precisely located meshes of sufficient granularity for the areas of interest. In contrast, the rigid plate reconstruction shows the overlap areas and gaps of the rigid sub-plates but can not indicate the extent of deformations or its implications for changes in topography.
A tight-fit similar to that presented by Lawver et al. (1999) was arrived at using the motion histories for South America and Africa as taken from the Global Isochron Chart of Royer, et al., (1992) and performing intra-plate deformation using submeshes for the Parana, Salado basins and NW Africa. The timings of the deformations were drawn from Müller et al. (1993) and Unternehr, et al., (1988) as described below. An animation of the reconstruction from present day to 160 Ma (Figure 8) was done using Pplates.
Figure 8. Animated Reconstruction with Deformation.
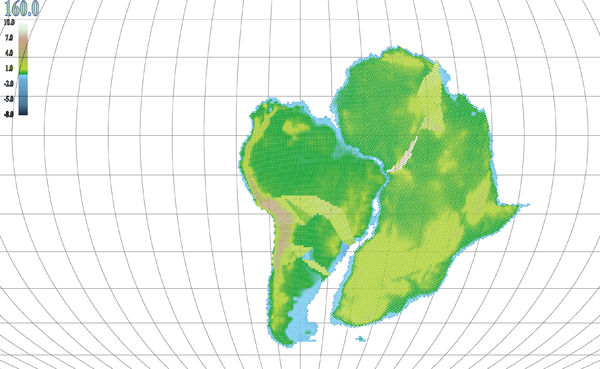
An animation of the reconstruction from present day to 160 Ma done using Pplates with deformable continents on the basis of the Global Isochron Chart (Royer et al. 1992) with timings established as described in the text.
In the case of Africa, Müller et al. (1993) suggested onset of rifting in the Benue trough region to be at or before 130.7 Ma and to be complete between 100 and 90 Ma. Interpolated motions from an earlier Pplates reconstruction using separate rigid plates and Euler histories for Africa and NW Africa based on this model showed the two regions to stop spreading between 98 and 95 Ma. A submesh in NW Africa was then used for closure of the Benue Trough/Niger Rift region starting around 95 Ma. Working backward in time, the submesh was moved in such a way as to preserve the geometry of NW Africa while the Benue trough region was compressed. (It is important to remember that reversing the temporal references also reverses the sense of deformation, ‘extension’ vs. ‘compression’, when doing a Pplates reconstruction.) Deformation of the mesh was completed by 130.7 Ma, the beginning of extension according to Müller et al. (1993). The degree of deformation was derived from the relative motion of NW Africa to Africa (Royer, et al., 1992) as Africa itself was rotated relative to the palaeomagnetic reference frame (Royer, et al., 1992).
For South America, the two regions that were deformed equate to the Salado and Parana Basins as described by Unternehr, et al., (1988) and subsequent workers. Using Euler histories for South America (Royer et al. 1992) and the same procedure as for Africa, deformation within the Salado Basin was initiated at between 130 and 150 Ma and ceased between 118 and 120 Ma; in the Parana Basin, extension was already underway at 150 Ma and approaching its terminal stages around 130 Ma.