The Elle simulation platform allows the simulation of a range of simple and coupled grain scale processes [Bons et al., 2000; Jessell et al., 2001, 2003; Piazolo et al., 2001; 2002, 2003 (this volume; Park et al 2003(this volume)]; microstructure.info).It is based on a two-tier system of nodes. The first layer is used to define grain boundaries as a series of arbitrary but space filling polygons, and the second consists of topologically unconnected nodes that are found within grain interiors (Figure 1). For the grain boundary migration experiments we simply use these boundary nodes, and for the diffusion experiments we also use the unconnected nodes. The details of how grain boundary migration is simulated are presented in [Piazolo et al. 2001 and Bons et al. 2000]. As this system cannot at present handle variations in melt fluid composition, a simple image-processing algorithm was used to simulate zonation resulting from late stage crystallisation.
Figure 1. Representation of the 2data layers in the Elle model
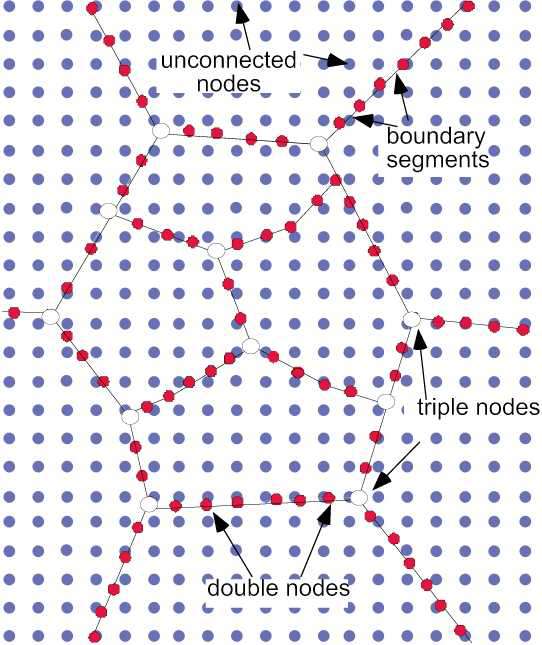
Layer 1: Boundary network represents a two-dimensional grain boundary network of a sharp interfaces. Each polygonal domain is defined by a number of double nodes (filled red circles) and triple nodes (open circles) that are connected by straight boundary segments. Each polygon can have a number of properties assigned to them, such as crystal lattice orientation.
Layer 2: Unconnected grid is a 2 dimensional mesh of unconnected nodes (filled blue circles). They represent data points in the x y space of the Elle model and are defined by their position in terms of x and y coordinates and properties such as crystal lattice orientation.
Grain growth is the general term for the grain size increase associated with grain boundary migration driven by surface energy reduction [Evans et al. 2001]. When there is a chemical evolution in the grain boundaries during grain growth, and the lattice behind the moving boundaries incorporates some of the trace elements from the boundary, a distinct zoning pattern develops [Reinecke et al. 2000; Holness & Watt, 2001; Jessell et al., 2003]. This zoning can be used to estimate the original grain size, and can be used to follow the grain boundary chemistry [water content in the case of Holness & Watt 2003] during grain growth.
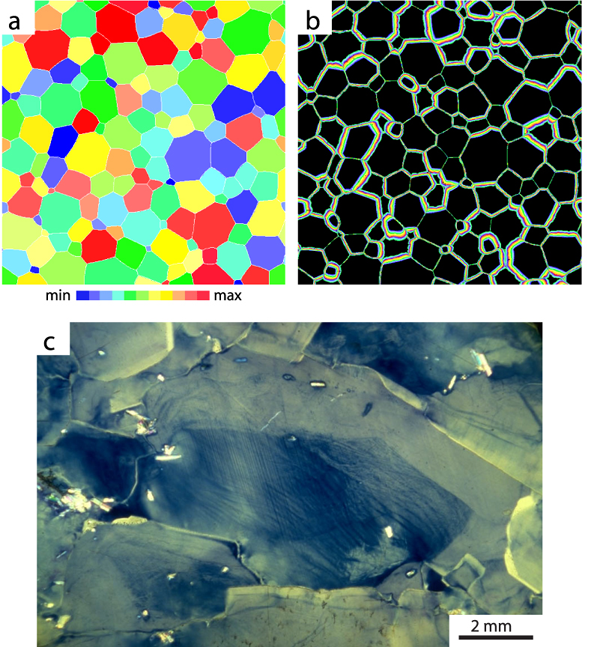
Figure 2 a-d shows four snapshots from the evolution of a numerical experiment up to a time step of 1500 (Simulation 1): at each stage the green areas show lattice never swept by a grain boundary, white areas show lattice swept at least once by a grain boundary, and the black lines show the current position of the boundary. Small specks of green within the white areas are simply places where the boundary migration occurred too quickly to be recorded in the experiment, and not actually un-swept domains. It can be seen that at each stage of the experiment, all the grains contain a single core of un-swept material, and that many boundaries are surrounded on both sides by swept material. Natural examples of this type of zoning have been reported by Baratoux [Figure 2e; pers. comm. 2003] in recrystallised plagioclase grains, and Garcia [Fig 2f; pers. comm. 2003] whose has observed zoning in apatite clusters which underwent grain coarsening in a carbonatite melt.
Figure 2. Development of grain boundary migration growth bands
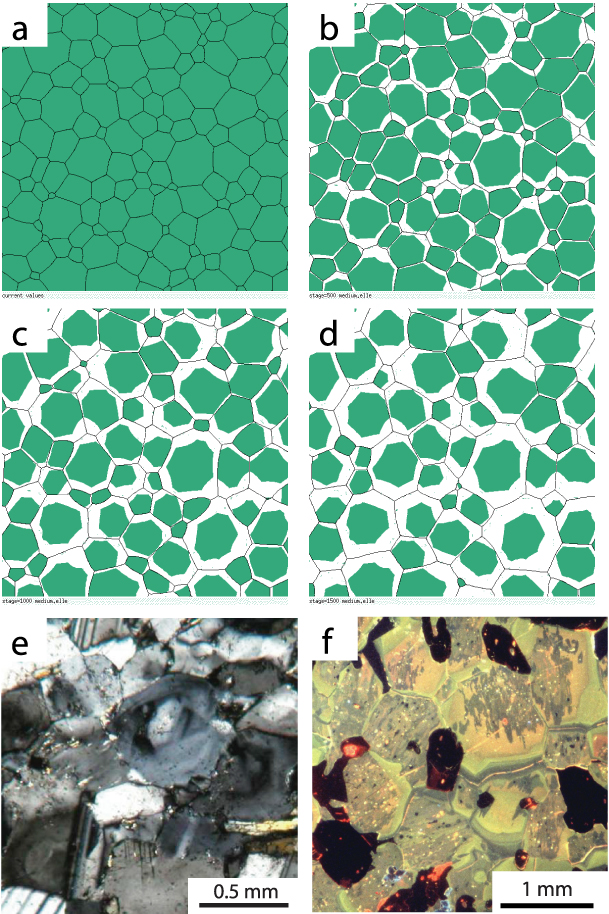
a-d) Development of remnant unswept cores during grain growth, after 0, 500, 1000 and 1500 time steps. At each stage of the evolution, areas never swept by grain boundaries are left green, and areas swept at least once by a migrating boundary are coloured white. Grain boundaries are shown as black lines. At every stage of the evolution the vast majority of grains possess a core of unswept material. Some of these cores at each stage are in contact with the grain boundary network, whereas others are completely isolated from it.
e) Zoning shown in BSE image related to Na concentrations in recrystallised plagioclases showing growth zoning from a lower granulite facies grade progressive Variscan metamorphism of the Cambro-Ordoviciangrabbro from the Eastern margin of the Bohemian Massif, Czech Republic. Sample collected and analysed by Lenka Baratoux.
f) Zoning seen in a cathodoluminsecentimge of apatite clusters which underwent grain coarsening in a carbonatitemelt, sample collected by Daniel Garcia.
If we repeat this experiment up to a time step of 500, but this time we change the colour of the grain boundary as a function of time, we get the result shown in Figure 3a and Simulation 2. This patterning predicts the zoning that would occur if there were cyclic changes in grain boundary chemistry as a function of time. The zones of faster grain boundary migration are marked by broader zones and shallower gradients in colour change (which can be read as being equivalent to chemical concentration). It is also worth noting that for grain growth, the broadest zones are concentrated around the triple junctions. If we extend this analysis to 2000 time steps, we find a complex series of overlapping zones, which result in sharp truncations, as areas of lattice are swept more than once by a series of grain boundaries Figure 3b). These truncations occur even though the evolution of the microstructure has been continuous. Depending on the nature of the grain boundary-lattice interaction during grain boundary migration, these overlapping zones could still partially or fully preserve the migration history.
Figure 3. Oscillatory zoning
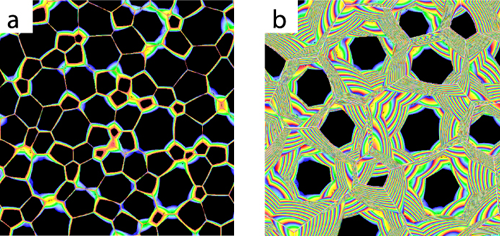
Oscillatory zoning predicted by cyclical grain boundary chemistry variations during grain growth. Note preferential widening of bands around triple junctions. a) Pattern after 200 time steps, pattern after 10,000 time steps. Note repeated truncations of the patterns.
Simulation 2. Grain boundary as a function of time
Changing the colour of the grain boundary as a function of time.
In this experiment we have added a an internal energy as a driving force for grain boundary migration, which could be a chemical energy, an elastic energy, a defect energy, or even a magnetic driving force [Urai et al1a; Sheikh-Ali et al. 2003]. For the purposes of these simulations we have assumed a random but uniform intracrystalline dislocation distribution, resulting in arbitrary dislocation density contrasts between grains (Figure 4a and Simulation 3). Again many grains show a distinct zonation at the end of the experiment Figure 4b), however in contrast with the grain growth experiment, the zones are of a more uniform width for a single grain boundary, and the distribution of grain boundary zones is also more uniform. In addition the grain boundaries become more irregular during their migration, as the surface energy is not sufficient to maintain smooth interfaces. A natural example of such uniform grain boundary migration banding has been described by Urai et al. 1986b (Figure 4c). This form of patterning may also be expected when a metamorphic reaction front develops at grain boundaries.
Figure 4. Zoning predicted for grain boundary
Zoning predicted for grain boundary migration driven by defect energy contrasts.
Distribution of defect energy levels in initial model (red high, blue low).
Oscillatory zoning produced by cyclical grain boundary chemistry variations. Note relatively uniform band widths.
Plane light photomicrograph of artificially irradiated but naturally dynamically recrystallised salt sample from the Asse Mine, Germany. The dark cores with ingrains show areas not recently swept by grain boundaries. (Sample collected and analysed by J. Urai.)
Simulation 3. Intracrystalline dislocation distribution
For the purposes of these simulations we have assumed a random but uniform intracrystalline dislocation distribution, resulting in arbitrary dislocation density contrasts between grains.
Using the system developed by Dal et al. (2003, this volume), we have simulated the zoning that could develop as a cluster of garnets (yellow grains) undergoes an isothermal ionic exchange reaction with a pair of biotites (red grains), which are all sitting in a matrix of quartz grains (green grains) (Figure 5a and Simulation 4). These experiments couple lattice diffusion, grain boundary diffusion and lattice-grain boundary chemical exchange. In the example shown here, the Fe enters the grain boundaries around the biotite grains and is taken into the garnet lattice. Along all grain boundaries, the Fe simply undergoes normal grain boundary diffusion, and within all garnet and biotite grains the Fe undergoes isotropic lattice diffusion.
Figure 5. Zoning predicted for garnet/biotite Fe exchange reactions
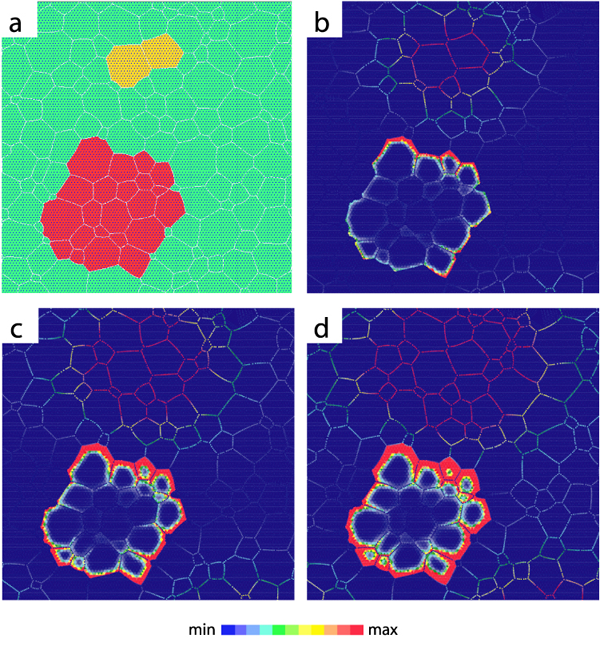
Zoning predicted for garnet/biotite Fe exchange reactions.
a) Starting model configuration. Garnet grains are red, biotite grains are yellow, matrix grains are green, grain boundaries are white, and blue dots show the location of unconnected nodes that store lattice chemistry information.
b-d) Model after 17, 34 and 50 time steps respectively. In this image both grain boundary and lattice concentrations are shown with the same look up table, (but with different scaling). At this stage of the experiment the grain boundary concentrations show the gradual loss of Fe from the Biotite, and the lattice concentrations show the preferential enrichment at garnet grain boundaries, but also the preferential enrichment around the perimeter of the cluster, and finally the preferential enrichment where the biotite grains are nearest.
Zoning patterns are roughly concentric with respect to current grain boundaries. Note that this model has cyclic limits, so that the biotite grains are also near below and to the right of the cluster.
Simulation 4. Isothermal ionic exchange
Using the system developed by Park et al. (2003, this volume), we have simulated the zoning that could develop as a cluster of garnets (yellow grains) undergoes an isothermal ionic exchange reaction with a pair of biotites (red grains), which are all sitting in a matrix of quartz grains (green grains).
There are two scales of zoning: each grain in the cluster shows atypical diffusion zoning (Figure 5b - d); in addition there is a much higher concentration of Fe around the perimeter of the cluster, as the grain boundary diffusion rates are not sufficiently high to "feed" the cluster interior. The cluster-wide zoning is especially marked where it is closest to the biotite grains which provide the source of the Fe. These zoning patterns are distinct from those described above in that the concentration profiles are smoothly varying, do not show truncations, and always roughly concentric with respect to the current grain boundaries.
To simulate the zoning associated with the crystallisation of a series of interconnected melt pockets and channels, or equivalently crystallisation from a fluid, we simply applied a distance transform (a standard image processing technique that calculates the distance to the nearest object for each pixel, Russ, 2002) to an image of the grains. This simulates the continuous isotropic growth of crystals from a series of nuclei (Figure 6), and shows the zoning that may occur if the liquid were to evolve linearly during crystallisation. As with the reaction/diffusion zoning, these patterns do not show truncations, however as with the grain boundary migration patterns, sharp transitions in concentration profile are possible, and concentricity is with respect to the internal cores of each grain, not the current grain boundaries.
Figure 6. Zoning predicted for late stage crystallization
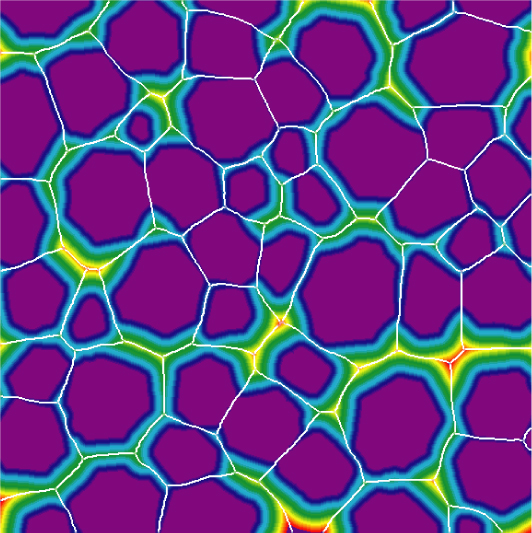
Zoning predicted for late stage crystallization from a melt or other liquid, where the liquid chemistry varies as a function of time. Grain cores are purple, and grain boundaries are white. Zoning patterns are concentric with respect to grain cores.
Finally we have investigated the possibility of following triple junction kinematics via their trace element trails. Figure 7a-d and Simulation 5 show a simulation of the motion of triple junctions during static grain growth. The initial grain boundaries are shown in white, and the consecutive positions of the triple junctions in purple. Although no unambiguous natural examples of this phenomenon have been described to date, one might expect this type of microstructure to be left by a fluid with a distinct chemistry from the matrix grains and a large wetting angle, so that the liquid concentrates at triple junctions (or triple lines in 3D). With this type of information, one could potentially track the complete topological evolution of the microstructure. Urai2003 (pers comm. 2003) has also suggested that similar trails may also be left behind grain boundary fluid pockets (Figure 7e).
Figure 7. Patterns of triple junction trail predicted for normal grain growth
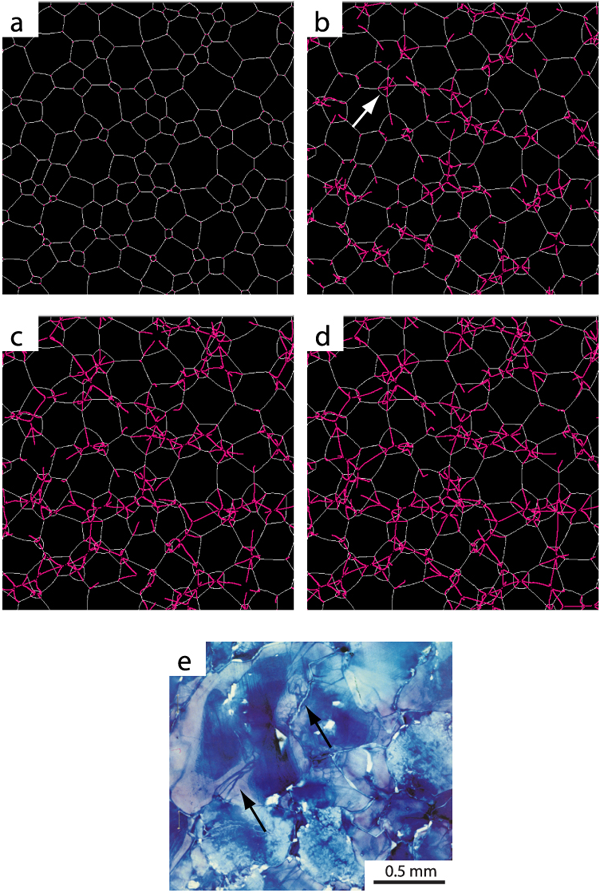
a-d) Patterns of triple junction trail predicted for normal grain growth. These trails might be expected if triple junctions contain a different chemistry, or if partitioning is different at triple junctions. White lines are grain boundaries, purple lines track successive positions of triple junctions. Note the rough bilateral symmetry of triple junction trails that develops when a grain disappears, for example as shown by the white arrow in b).
e) Possible triple junction trails (black arrows), or grain boundary fluid inclusion trails,in plane light photomicrograph of artificially irradiated but naturally dynamically recrystallised salt sample from the Asse Mine, Germany. Sample collected and analysed by J. Urai.
Simulation 5. Motion of triple junction
Simulation of the motion of triple junctions during static grain growth. The initial grain boundaries are shown in white, and the consecutive positions of the triple junctions in purple.