Result and Discussion
Petrographic description of rocks
Minerals in thin section include biotite, plagioclase, hornblende, muscovite, orthoclase, microcline, and quartz. The modal and average mineral percentages were estimated. The characteristic of the different minerals as observed in thin section are discussed as follows:-
The biotite shows grey to brown coloration, with subhedral to anhedral habit and no twining. Birefringence is 1st order and the mineral possess no extinction angles. Biotite forms interstitial lamellae with brown pleochroism. Commonly, an inner zone of deep green hornblende is surrounded by an outer biotite and quartz; this is shown in the digitized sketches of the slides in Appendix A.
The mineral quartz is colourless under the plane-polarized light, with no pleochroism, and twinning. The habit is subhedral to anhedral. Birefringence is also 1st order with extinction angle occurring at ~30°, 40° and 80°. The muscovite is colorless with no pleochroism and twinning. Habit is anhedral to subhedral. Birefringence is 3rd order with extinction angle at angle ~37°, 30° and 32°. The hornblende is deep green, pleochroic prismatic crystals in thin section with 1st order birefringence. Twining and extinction angle are totally absent.
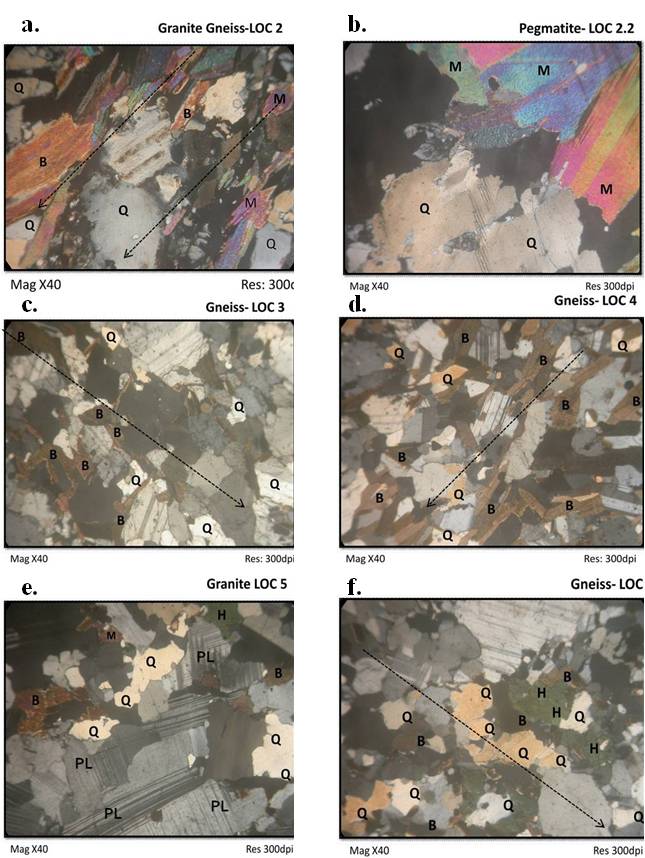
Figure 2. Photomicrograph of samples
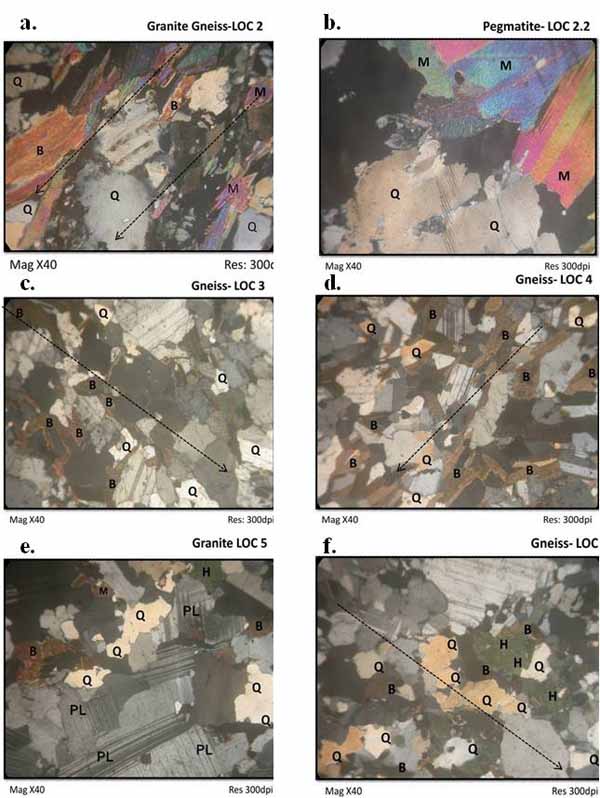
Photomicrograph of (a) granite sample at location 2 (b) pegmatite samples at location 2.2 (c) Migmatite samples at location 3 & (d) at location 4 (e) granite sample at location 5 (f) porphyroblastic granite sample in location 6. The arrows show the direction of inferred foliation.
The biotite-hornblende mineral association possesses dominant planar and undulating grain contact. The contact is oriented at different angles at distinct intervals. The hornblende is usually surrounded by biotite and quartz. The hornblende-muscovite grain contact is also planar and undulating at almost equal intervals (Table 1a & 1b, Appendix A). In all the samples, biotite and quartz dominate with biotite reaching ~ 60% of the whole rock. The average planar grain contact for the biotite-hornblende is ~56°, with a maximum of 88° and minimum of 20° while that of the hornblende-muscovite is ~26° with a minimum and maximum of 20° and 30°.
The rocks identified from petrographic studies include the migmatized gneiss, granite and pegmatite. The migmatized gneiss is strongly foliated occurring as the parent rock type in the study area. It is composed of mafic minerals such as biotite and hornblende. The dark-colored host rocks (palaeosome) is intruded by veins of fine grained lighter rock consisting of quartz and feldspar (metasome). The metasome include granitic intrusion, pegmatite, and quartzo feldspathic veins. The term “migmatized” is used because of the field relationship of the palaeosome and the metasome especially the occurrence of granitic metasome in the metamorphosed parent rock. In this work, the migmatized gneiss is used to represent a group of rocks that includes granite gneiss, porphyroblastic granite, and banded gneiss. The banded gneiss contains mafic and felsic bands resulting from the segregation of minerals. The mafic bands are composed of biotite and hornblende while the felsic bands consist of quartz, muscovite, and feldspar minerals. The granite gneiss is metamorphosed granite rock that display subtle bands of mafic and felsic minerals. They contain minerals such as quartz, feldspar (microcline), mica (muscovite), and hornblende.
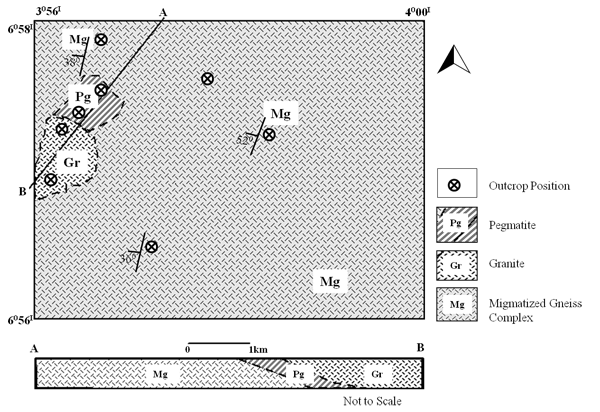
The pegmatite occurs both as outcrop and intrusions in other rock types. The composition of the pegmatite includes feldspar, muscovite, tourmaline, quartz, and occasionally biotite. Plagioclase feldspar is dominant with modal percentage estimated between 45-50% (fig.2). The minerals grains are large and phaneritic with size ranging from 2.2cm - 5cm. The pegmatite intrusions are simple pegmatites that occur as dykes in some of the other rock types. On the other hand, pegmatites outcrops are generally aphanitic with grains smaller than those seen in the intrusion. The pegmatite outcrop is restricted to the WNW part of the study area (fig.3) where it occurs in association with the biotite granite and the migmatized gneiss host rock.
The average modal percentage of minerals in the migmatized gneisses includes quartz~34%, biotite~20%, hornblende~11%, plagioclase~4%, microcline~6% and other minerals~8%. Inferred orientation of foliation is approximately N30°E and N45°W (fig.2) on the average when taken north of the 0 calibration of the microscope slide. The granites has average value of quartz~43%, biotite~20%, plagioclase~10%, microcline~03%, hornblende ~8% and other minerals ~16% while the average pegmatite is composed of quartz~38%, biotite~15%, muscovite ~30%, orthoclase~12% and other minerals~5%.
Whole Rock Analysis (Petrogenesis)
Major Oxide Geochemistry
The major oxides obtained from the XRF analysis include SiO2, Al2O3, CaO, MgO, K2O, and Fe2O3 (Table 2). The entire rock samples show high SiO2 content, with the highest value recorded in the granitic rocks (Sample 1 in Table 2). The SiO2 value ranges from 54.51- 81.58%, with the least value recorded in the non-granitic rocks. The other oxide with appreciable high value is alumina between 15.66 - 20.13%. All the other oxides Fe2O3, MgO, Na2O, CaO and K2O have values of <5% in all the samples.
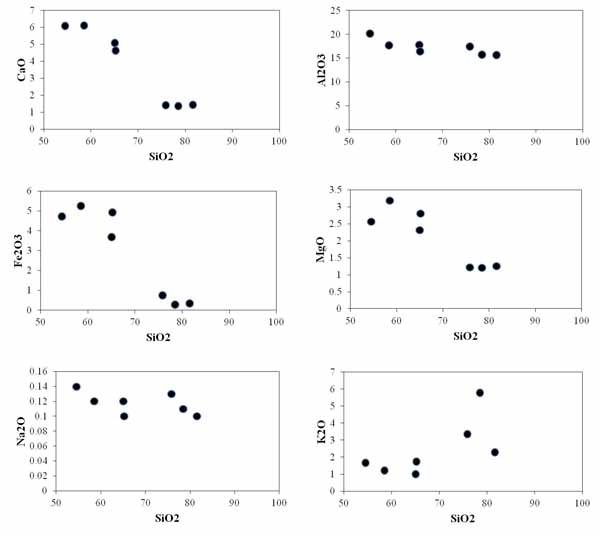
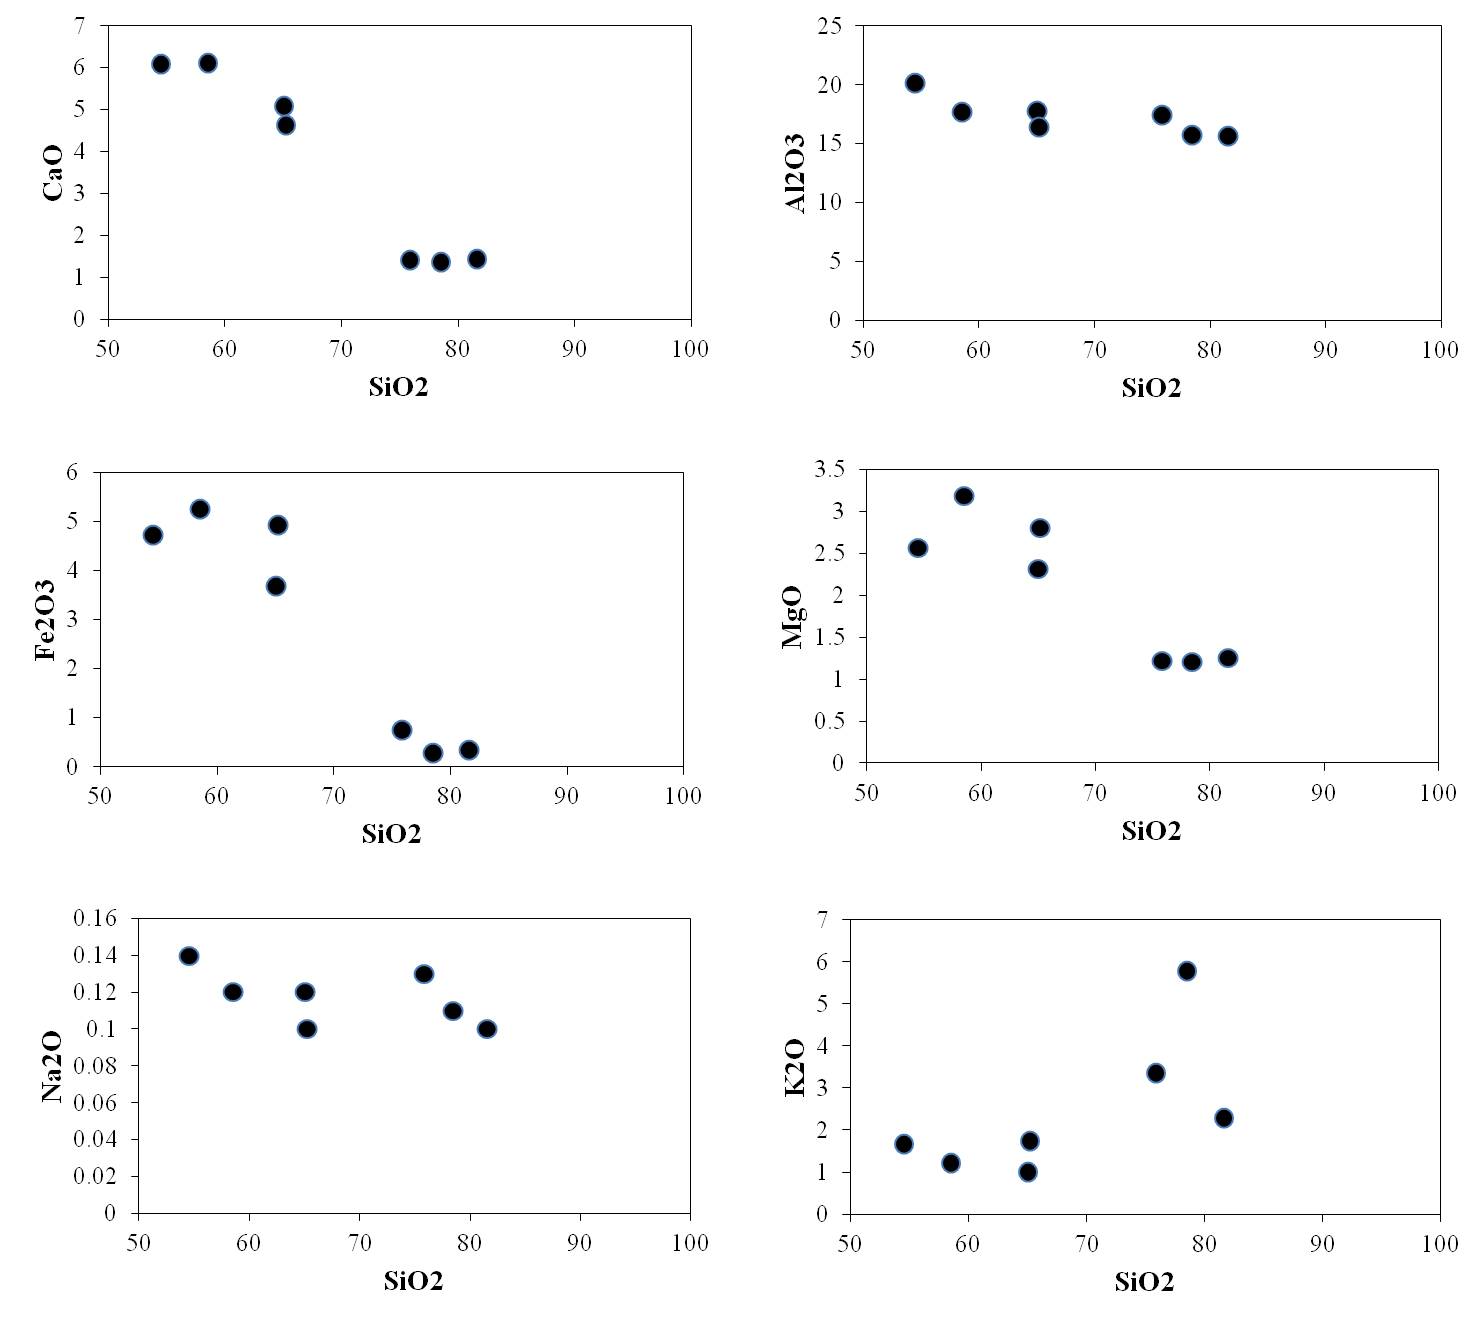
The variation of the SiO2 with other oxides is shown on the Harker diagram (Fig.4), there is little spread or scatter of the data points. Two kinds of population were observed, the greater and less than 75% SiO2 variation with the other oxides. There is strong positive correlation between SiO2 and CaO, Al2O3, MgO, Fe2O3 with coefficient of correlation, r of >0.81 while there is moderate correlation between the Na2O, K2O and SiO2 with r-value of 0.5 and 0.66, respectively. Co-variation values of 30 and 43% shows that SiO2 variation is unassociated with changes in Na2O and K2O, while values of 66% - 94% show that the oxides varies significantly with changes in SiO2 content.
The normative mineral weight and volume percentage are shown in Tables 4 & 5; the major normative minerals include quartz, muscovite, hornblende, biotite, and plagioclase, while orthoclase, plagioclase, corundum, hypersthene and magnetite occur as accessory minerals.
Index of Weathering and Alteration
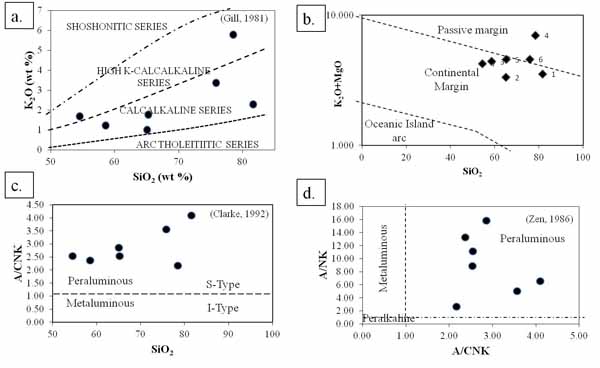
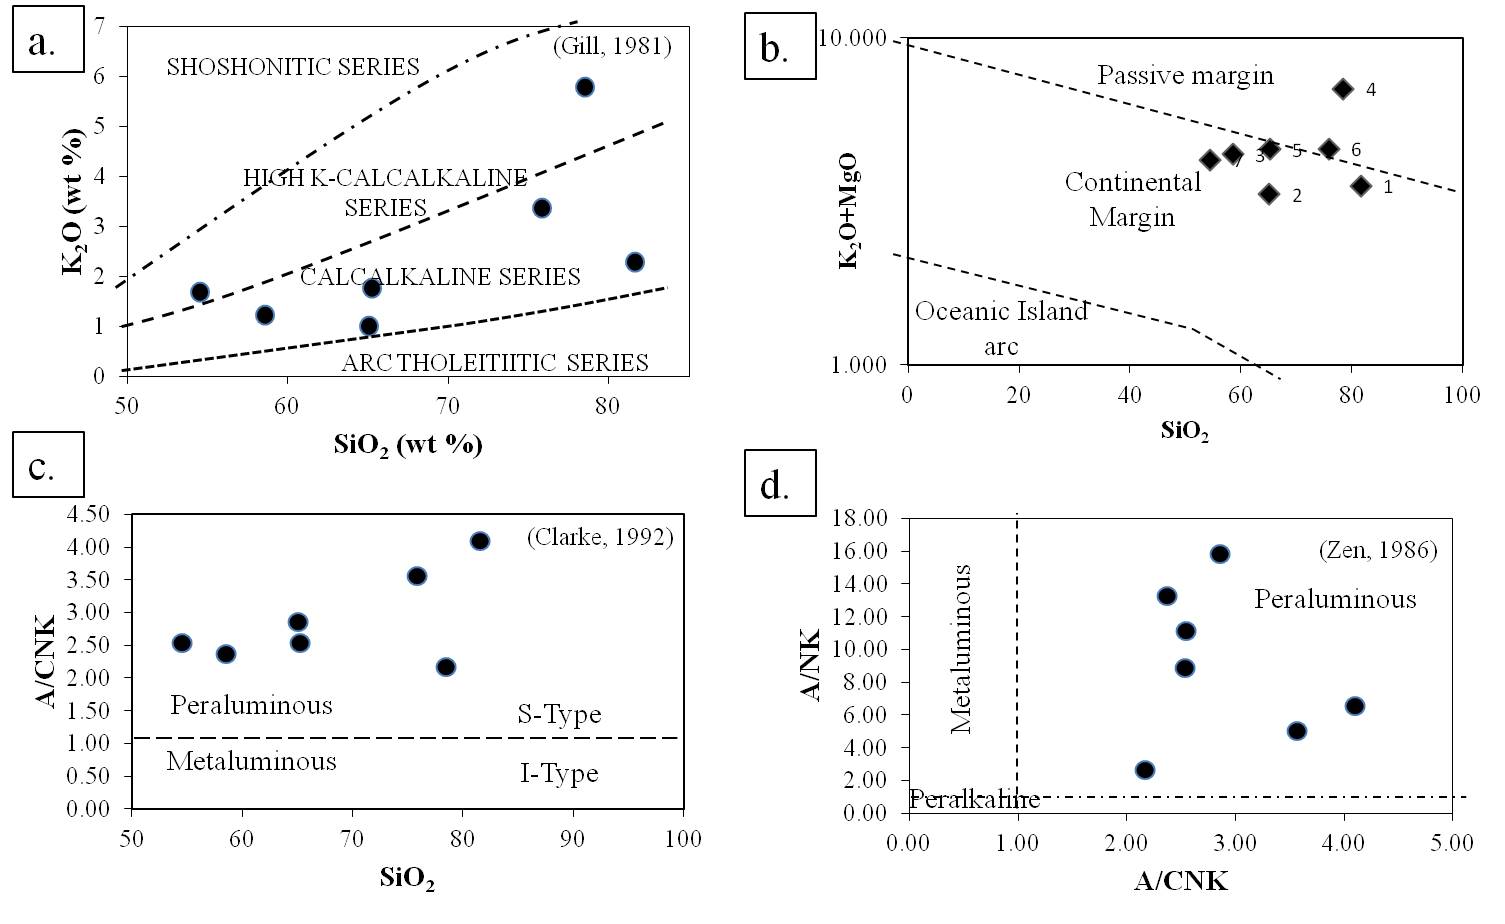
The CIA and CIW of 80.39% and 80.8% (Table 2) were the highest recorded in all the samples analyzed; these values were obtained from the granite sample at Location 1. All the rock types of the study area show a high degree of alteration and weathering. The least CIA and CIW values (Table 2) were recorded in the metamorphic rocks. The aluminum saturation index (ASI: molar Al2O3/ (CaO + Na2O+K2O)) (Zen, 1986) was used to distinguish between S- and I-type granites (Chappell, 1999). On the A/NK– A/CNK diagram (Fig. 5d), all the samples plotted in the peraluminous field (A/CNK >1). The SiO2–A/CNK diagram (Clarke, 1992) shows that the samples are S-type granite with A/CNK >1.1 (Fig.5c).
Table 1. Optical properties of Minerals in the analyzed samples
| Quartz | Colour | Pleo | Habit | Twinning | Bire | Ext. angle |
|---|---|---|---|---|---|---|
| L1 | Colourless | Abs | anhedral | Abs | 1st order | 32 |
| L2 | Colourless | Abs | anhedral | Abs | 2nd order | 36 |
| L3 | Colourless | Abs | anhedral | Abs | 3rd order | 42 |
| Biotite | ||||||
| L1 | brown | Wk | subhedral | Nil | 1st order | Nil |
| L2 | brown | Wk | anhedral | Nil | 1st order | Nil |
| L3 | brown | Wk | anhedral | Nil | 1st order | Nil |
| Muscovite | ||||||
| L1 | Colourless | Abs | anhedral | Nil | 3rd order | 35 |
| L2 | Colourless | Abs | anhedral | Nil | 4th order | 30 |
| L3 | Colourless | Abs | anhedral | Nil | 5th order | 33 |
| Hornblende | ||||||
| L1 | green | Wk | anhedral | nil | 1st order | nil |
| L2 | green | Wk | anhedral | nil | 2nd order | nil |
| L3 | green | Wk | anhedral | nil | 3rd order | nil |
Table 1b. Mineral Contact Relationship
| Biotite-Hornblende | contact angle | Hornblende-muscovite | contact angle | ||
|---|---|---|---|---|---|
| L4 | planar | 080° | L4 | undulating | |
| L5 | planar | 0° | L4 | planar | 30° |
| L5 | undulating | L5 | undulating | ||
| L5 | undulating | L6 | planar | 28° | |
| L6 | planar | 60° | L6 | planar | 20° |
| L6 | planar | 58° | L6 | undulating | |
| L6 | undulating | ||||
| L6 | undulating | ||||
| L6 | planar | 38° | |||
| L7 | planar | 88° | |||
| L7 | undulating | ||||
| L7 | planar | 35° | |||
| L7 | planar | 15° | |||
| L7 | planar | 50° |
Table 2. Geochemical results of Major oxides in samples analyzed in the study area
| CaO | SiO2 | Al2O3 | Fe2O3 | MgO | Na2O | K2O | A/CNK | A/NK | CIA (%) | CIW (%) | |
|---|---|---|---|---|---|---|---|---|---|---|---|
| 1 | 1.44 | 81.58 | 15.66 | 0.34 | 1.25 | 0.1 | 2.28 | 4.1 | 6.58 | 80.39 | 80.8 |
| 2 | 5.08 | 65.05 | 17.74 | 3.68 | 2.32 | 0.12 | 1 | 2.86 | 15.84 | 74.1 | 74.48 |
| 3 | 6.12 | 58.53 | 17.66 | 5.24 | 3.19 | 0.12 | 1.21 | 2.37 | 13.28 | 70.33 | 70.67 |
| 4 | 1.37 | 78.47 | 15.73 | 0.27 | 1.21 | 0.11 | 5.78 | 2.17 | 2.67 | 68.42 | 68.75 |
| 5 | 4.63 | 65.2 | 16.43 | 4.91 | 2.81 | 0.1 | 1.75 | 2.54 | 8.88 | 71.72 | 72.03 |
| 6 | 1.42 | 75.84 | 17.46 | 0.74 | 1.22 | 0.13 | 3.35 | 3.56 | 5.02 | 78.09 | 78.54 |
| 7 | 6.1 | 54.51 | 20.13 | 4.72 | 2.57 | 0.14 | 1.67 | 2.54 | 11.12 | 71.79 | 72.15 |
Table 3. Qualitative Analysis Of Mineral
| granite (1) | pegmatite(2) | migmatite(3) | migmatite(4) | granite(5) | gneiss(6) | migmatite(7) | |
|---|---|---|---|---|---|---|---|
| Fe3+/(Total Fe) in rock | 30 | 29.9 | 29.98 | 29.75 | 29.98 | 29.64 | 30.08 |
| Mg/(Mg+Total Fe) in rock | 88.13 | 55.55 | 54.68 | 89.91 | 53.16 | 76.5 | 51.89 |
| Mg/(Mg+Fe2+) in rock | 91.39 | 64.06 | 63.28 | 92.69 | 61.85 | 82.23 | 60.67 |
| Mg/(Mg+Fe2+) in silicates | 93.11 | 69.38 | 68.68 | 94.15 | 67.35 | 85.43 | 66.28 |
| Ca/(Ca+Na) in rock | 88.84 | 95.9 | 96.57 | 87.31 | 96.24 | 85.79 | 96.01 |
| Ca/(Ca+Na) in plagioclase | 89.61 | 96.41 | 96.79 | 88.9 | 96.8 | 87.26 | 96.44 |
| Differentiation Index | 90.05 | 85.67 | 83.17 | 92.78 | 84.44 | 89.02 | 83.17 |
| Calculated density, g/cc | 2.76 | 2.83 | 2.86 | 2.7 | 2.84 | 2.77 | 2.86 |
| Calculated liquid density, g/cc | 2.37 | 2.49 | 2.54 | 2.37 | 2.49 | 2.39 | 2.54 |
| Calculated viscosity, dry, Pas | 1.53 | 0.88 | 0.67 | 1.25 | 0.83 | 1.28 | 0.6 |
| Calculated viscosity, wet, Pas | 1 | 0.72 | 0.58 | 0.87 | 0.68 | 0.91 | 0.54 |
| Estimated liquidus temp., °C | 672.96 | 871.57 | 960.17 | 732.72 | 878.57 | 741.66 | 1013.98 |
| Estimated H2O content, wt. % | 5.25 | 3.03 | 2.12 | 4.58 | 2.96 | 4.48 | 1.63 |
Table 4. Volume compositions for normative minerals
| Sample | Quartz | Plagioclase | Orthoclase | Corundum | Hypersthene | Magnetite | Others | Total |
|---|---|---|---|---|---|---|---|---|
| 1 | 68.16 | 7.75 | 14.14 | 7.04 | 2.81 | 0.07 | 0.02 | 100 |
| 2 | 50.47 | 28.3 | 6.9 | 5.44 | 7.93 | 0.92 | 0.04 | 100 |
| 3 | 39.05 | 35.41 | 8.71 | 3.95 | 11.5 | 1.36 | 0.02 | 100 |
| 4 | 50.48 | 7.27 | 35.03 | 4.5 | 2.63 | 0.06 | 0.03 | 100 |
| 5 | 46.92 | 25.52 | 12 | 4.46 | 9.85 | 1.22 | 0.04 | 100 |
| 6 | 59.59 | 8.07 | 21.36 | 7.68 | 3.1 | 0.17 | 0.04 | 100 |
| 7 | 34.46 | 36.37 | 12.34 | 5.65 | 9.87 | 1.27 | 0.04 | 100 |
Table 5. Weight percentage composition of the normative minerals
| Sample | Quartz | Plagioclase | Orthoclase | Corundum | Hypersthene | Magnetite | others | Total |
|---|---|---|---|---|---|---|---|---|
| 1 | 67.23 | 7.92 | 13.47 | 10.42 | 3.42 | 0.14 | 0.02 | 103 |
| 2 | 44.74 | 26.09 | 5.91 | 7.25 | 9.13 | 1.59 | 0.04 | 95 |
| 3 | 33.21 | 31.31 | 7.15 | 5.04 | 12.71 | 2.28 | 0.02 | 92 |
| 4 | 50.95 | 7.6 | 34.16 | 6.83 | 3.26 | 0.12 | 0.04 | 103 |
| 5 | 41.87 | 23.68 | 10.34 | 5.98 | 11.46 | 2.13 | 0.04 | 96 |
| 6 | 57.18 | 8.01 | 19.8 | 11.06 | 3.72 | 0.32 | 0.04 | 100 |
| 7 | 28.54 | 31.32 | 9.87 | 7.03 | 10.68 | 2.06 | 0.04 | 90 |
Figure 4. Harker diagram
Harker diagram for oxides interrelationship, variation of SiO2 with the other oxides. There is ‘r’ of 0.97, 0.81, 0.94, 0.9, 0.5 and 0.66 between SiO2 and CaO, Al2O3, Fe2O3, MgO, Na2O and K2O, respectively. Covariation,’r2’ is highest between SiO2 and CaO.
Figure 5. SiO2–K2O diagram
(a) The SiO2–K2O diagram, all the samples falls in the field of High k-Calcalkaline and Calcalkaline Series (b) The rock are continental and passive margin igneous and metamorphic rocks on the plot of K2O+MgO vs SiO2 (Bhatia, 1983) (c) All the sample falls in the field of S-type granites, even the metamorphosed gneisses on the SiO2–A/CNK diagram, where A/CNK = molar Al2O3/(CaO + Na2O+K2O), aluminium saturation index (ASI). (d) The rock are peraluminous on the A/CNK–A/NK diagram where A/NK = molar Al2O3/(Na2O+K2O), corroborating the high corundum content of Table 4 & 5.
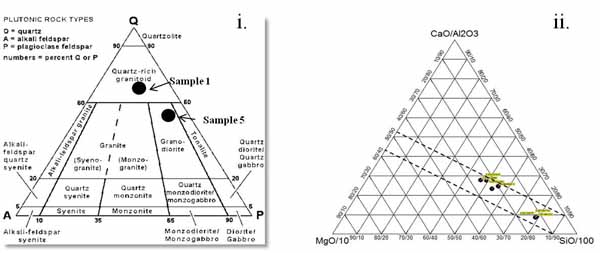
Figure 6. QAP
(i) QAP (Streckeisen, 1976) for the two igneous samples (Sample 1 & 5), Sample 1 plot in the field of quartz-rich granitoid while Sample 5 is a granodiorite (ii) Accessing the alteration of magmatic rock, all the sample falls in the field of altered rocks corroborating the alteration indices of Table 2.
Qualitative Analysis
The amount of Fe3+ in all the samples is approximately 30%, Mg is highest in Samples 1 (granite) and 6 (gneiss), while there is a high ratio of Ca/Ca+Na and plagioclase in all the rock samples. The highest differentiation index is recorded in one of the gneisses. This may reflect re-crystallization and development of newer minerals. Calculated density of rock varies from 2.70 to 2.86 g/cc (Table 3). High density is unrelated to the estimated water content. The sample with density of 2.70 g/cc has water content of 4.58 while that of 2.86 has density of 1.63%. Estimated water content of all the gneisses is 3.2% in contrast with the granites with higher content of 5.25%. The estimated liquid temperature ranges 732°C - 1013.98°C in the gneisses with mean of 862.13°C, highest estimated liquidus is 1014°C (Table 3).
Ternary and Discriminant Diagrams
The QAP diagram (Streckeisen, 1976) was used to characterize the specific modal percentages of the constituents of the rock samples, especially in samples 1 and 5 that were classified as igneous rocks on the field and during petrographic studies. For the two granitic samples, Sample 1 plotted in the field of quartz-rich granitoid (Fig. 6i) while Sample 5 fell in the field of granodiorite. The latter has a very high percentage of plagioclase in thin section (Fig. 2e) and from geochemical analyses (Table 4 & 5). The ternary plot for the whole rock compositional field demonstrates the affinity and concentration of the mineral content of the rock and also the compositional variation of minerals.
The degree of alteration of the sample was further assessed using the ternary plot of CaO/Al2O3-MgO/10-SiO2/100 (Davies et al., 1978). All samples plotting outside the line are unaltered or marginally altered magmatic rocks. In the study area, all the samples plotted within the lines, corroborating the high CIA and CIW (Table 2) values. Alteration of the rocks is attributed to any of weathering, melting, metamorphism, or re-crystallization.
The high corundum content suggests high alumina content as seen in Table 2, various alumina contents can yield any of peralkaline, metaluminous and peraluminous rock. The plot of SiO2–A/CNK diagram shows that all the samples are S-type granites including the metamorphosed gneisses. I-type granites have been previously described not to have undergone any surface weathering processes. On the other hand, S-type granites are products of partial melting of metasedimentary rocks (Chappell & White, 1974). Two of the samples plotted in the field of passive margin derived rocks on the K2O+MgO vs. SiO2 (Bhatia, 1983). The other samples fall in the field of continental margin derived rocks.