Paleomagnetism
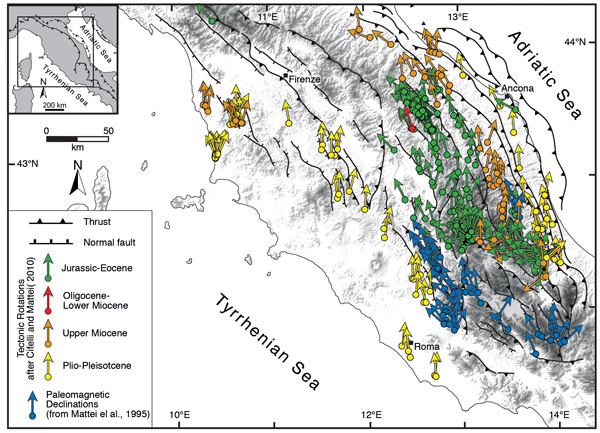
The Northern Apennines have been widely investigated by paleomagnetists since the 1970s. Initially, a ca. 40° counterclockwise (CCW) rotation was inferred for the entire Italian peninsula using data from the Umbria-Marche (Lowrie and Alvarez, 1975). However, the autochthonous hypothesis was discarded as soon as paleomagnetic data became available. This new data documented different sense and degree of rotations along the Northern Apennines arc (Channell et al. 1992). These rotations were attributed to thrust emplacement, which occurred during the Plio-Pleistocene Period (Speranza et al. 1997). Paleomagnetic data from the Northern Apennines (Fig. 8) document a change in vertical-axis rotations from counter clockwise (CCW) to clockwise (CW), as one moves from north to south. Strong CCW rotations have been documented in the Emilia-Romagna region, whose 28° CCW rotation is due to Pliocene thrusting (Muttoni et al., 2000). Rotations decrease toward the arc apex and switch to CW rotations in the southern sector (Speranza et al., 1997). Data from Miocene sediments in the foreland domains indicate that the Northern Apennines represent an oroclinal arc (Speranza et al., 1997). However, a test of the orocline hypothesis, based on data from the internal sheets, shows that the Northern Apennines are a progressive arc (Cifelli and Mattei, 2010). Confined strong rotations, which do not fit either the oroclinal or progressive arc model, are due to the presence of local deformation (e.g., Mazzoli et al., 2001) or strike-slip faults, as described for the southern sector of OAS thrust (Turtù et al., submitted).
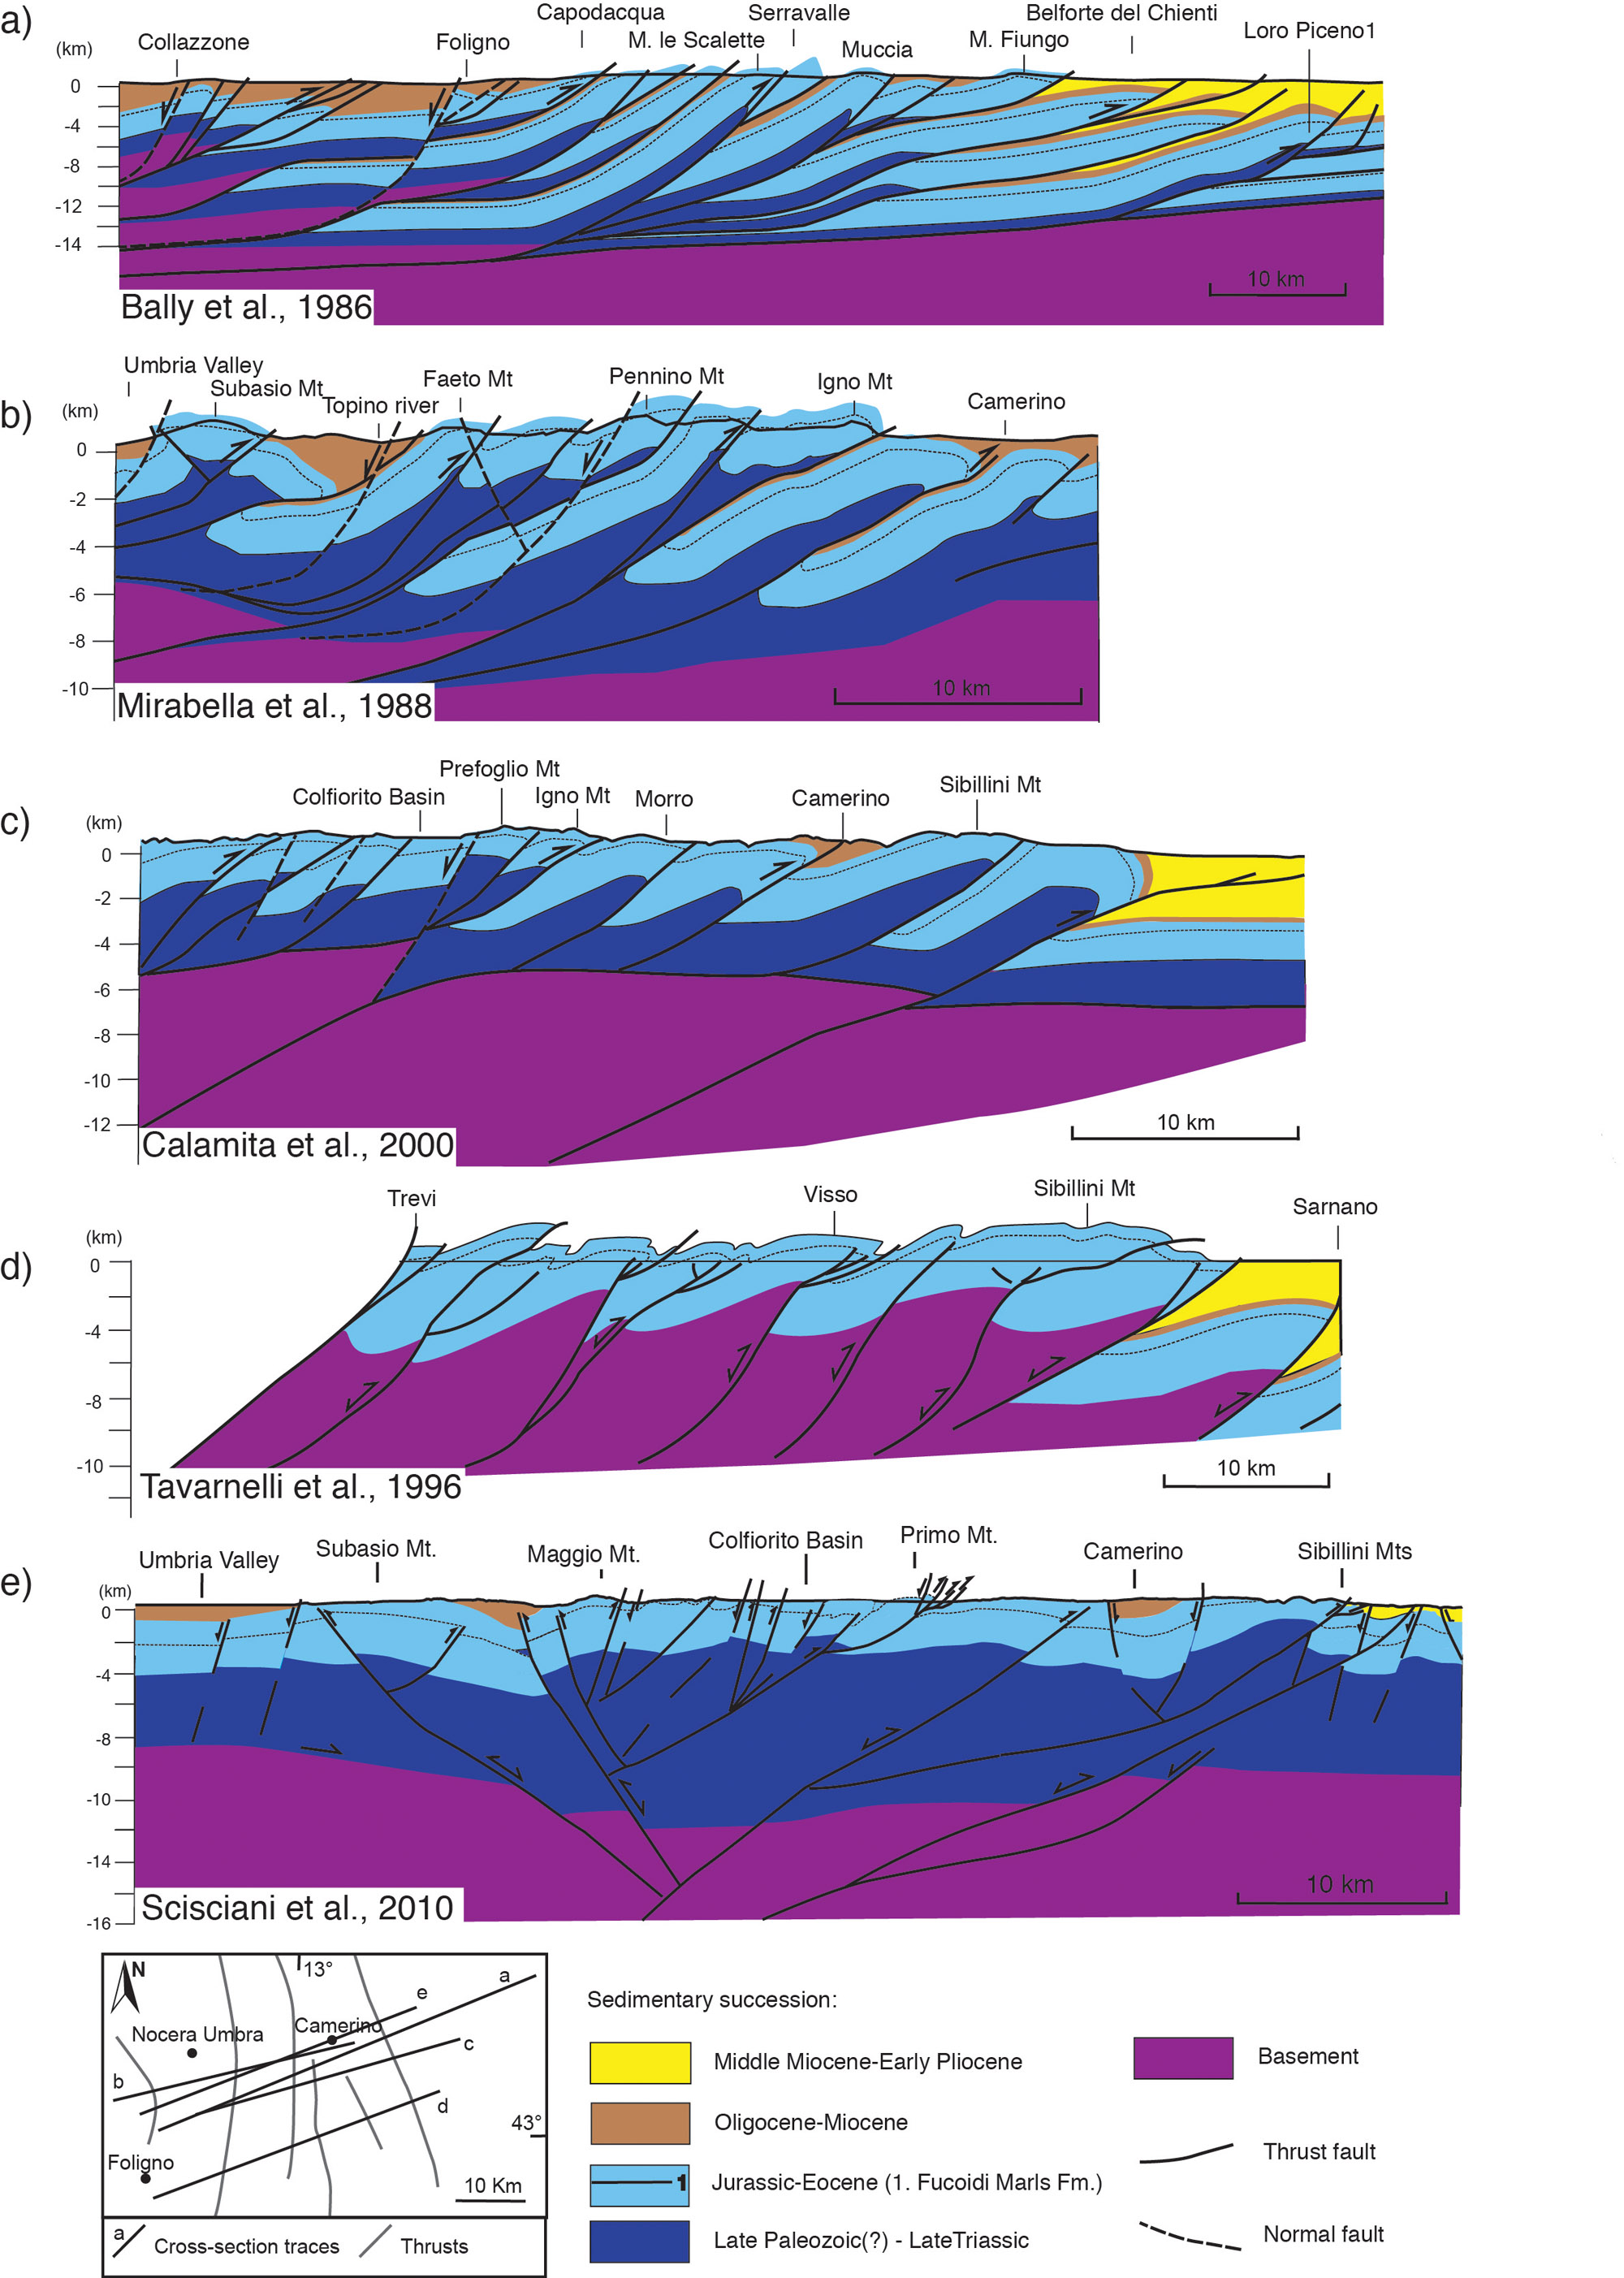
Figure 7. Geologic sections reconstructed across the outer sector of the Northern Apennines.

Thin (a) vs. thick- skinned tectonic styles (b, c), also referred to an inversion tectonics context (d, e), have been proposed in the literature.
Figure 8. Digital elevation map of the Northern Apennines, showing major thrust and normal fault traces.
Arrows represent tectonic rotation (Satolli et al., 2005; Cifelli and Mattei, 2010) and paleomagnetic declinations (Mattei et al., 1995) from prior work. Digital evaluation model data were obtained from CGIAR-Consortium for Spatial Information.