P-T results and preliminary considerations on the P-T paths
The pressures and temperatures (with the correspondent uncertainties) estimated by Average PT are reported in Table 6 and plotted in the P-T diagram of Fig. 12a. The “Average PT” approach allows to constrain P-T conditions corresponding to the growth of specific mineral assemblages, thus resulting in single P-T points in a P-T diagram. For the LHS and IMS not-anatectic samples, most of the obtained P-T results refer to the equilibrium assemblages defining the main foliation (i.e. S2LHS, S2IMS); in some cases, however, P-T constraints for the pre- and/or post-S2 assemblages have been also obtained (Table 6 and Fig. 12a). As concerning the anatectic samples from the structurally higher portion of the IMS, the obtained P-T results refer to the peak-T conditions, corresponding to the muscovite and biotite de-hydration melting event; only for sample 09-11, which preserves the prograde mineral assemblage and compositions, the prograde P-T conditions have been determined. Various sources of uncertainty (analytical precision, thermodynamic data, activity-composition relationships; Powell, 1978, 1985; Powell and Holland 1985; Fraser et al., 2000) contribute to relatively large uncertainties (Fig. 12a) in the final THERMOCALC estimates (e.g. 1σ uncertainties on P-T results for the studied metapelites are generally greater than ± 30°C and ± 1.5 kbar). However, what is worth of notice in this approach, are not the absolute P-T values, but the relative differences between P-T conditions estimated for each sample.
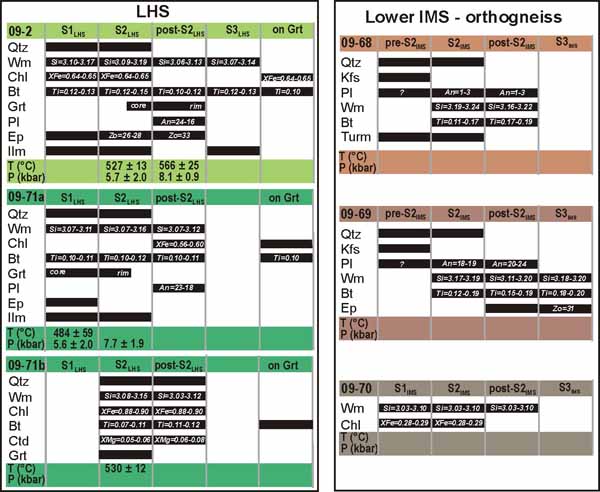
Figure 11. Crystallization-deformation relations of the studied samples, with mineral compositions and synthesis of the thermobarometric results
Colours for each sample are the same used in the next figures (a: LHS and lower IMS orthogneisses; b: lower and upper IMS metapelites). The following compositional parameters are shown: Si (a.p.f.u. on the basis of 22 oxygens) for white mica, Ti (a.p.f.u. on the basis of 22 oxygens) for biotite, XFe [XFe=Fe/(Fe+Mg)] for chlorite, An (x100) for plagioclase, XMg [XMg=Mg/(Fe+Mg)] for chloritoid and staurolite, Zo (x100) for epidote. For the upper IMS anatectic metapelites, the melting vs. crystallization relations are also shown (i.e. prograde sub-solidus crystallization, white mica ± biotite de-hydration melting, melt crystallization, retrograde sub-solidus crystallization): in the melt-bearing domain (muscovite ± biotite de-hydration melting) grey vs. black bars discriminate between reactants and products of the melting reactions, respectively. In the anatectic samples, the development of oriented structures is not only controlled by deformational events, but also by the production, extraction and crystallization of the melt, therefore the correlation between the main foliation recognised in the lower IMS (S2IMS) and that recognised in the upper IMS is not trivial. For this reason, the notation Sm (main schistosity) was preferred for the anatectic samples.
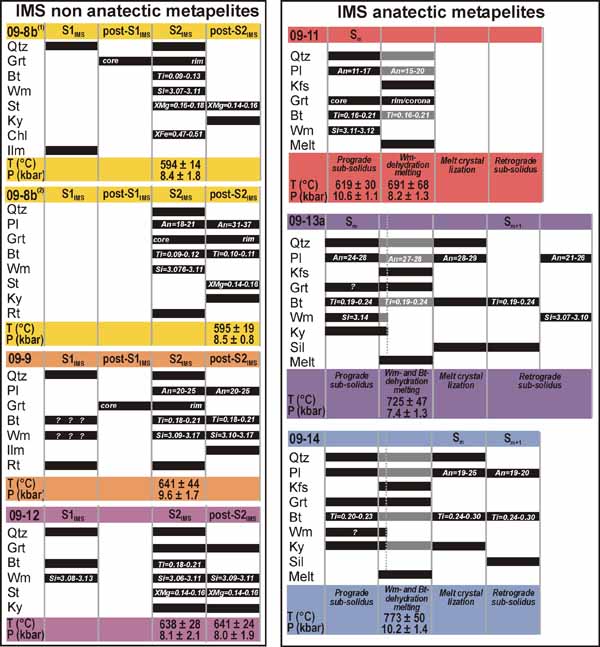
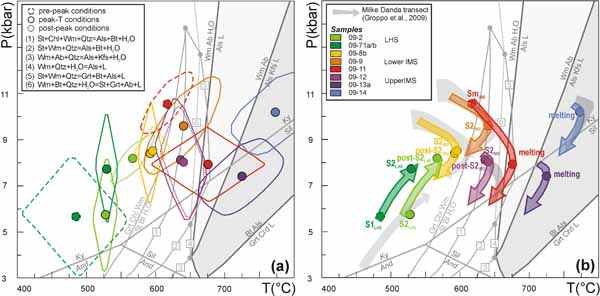
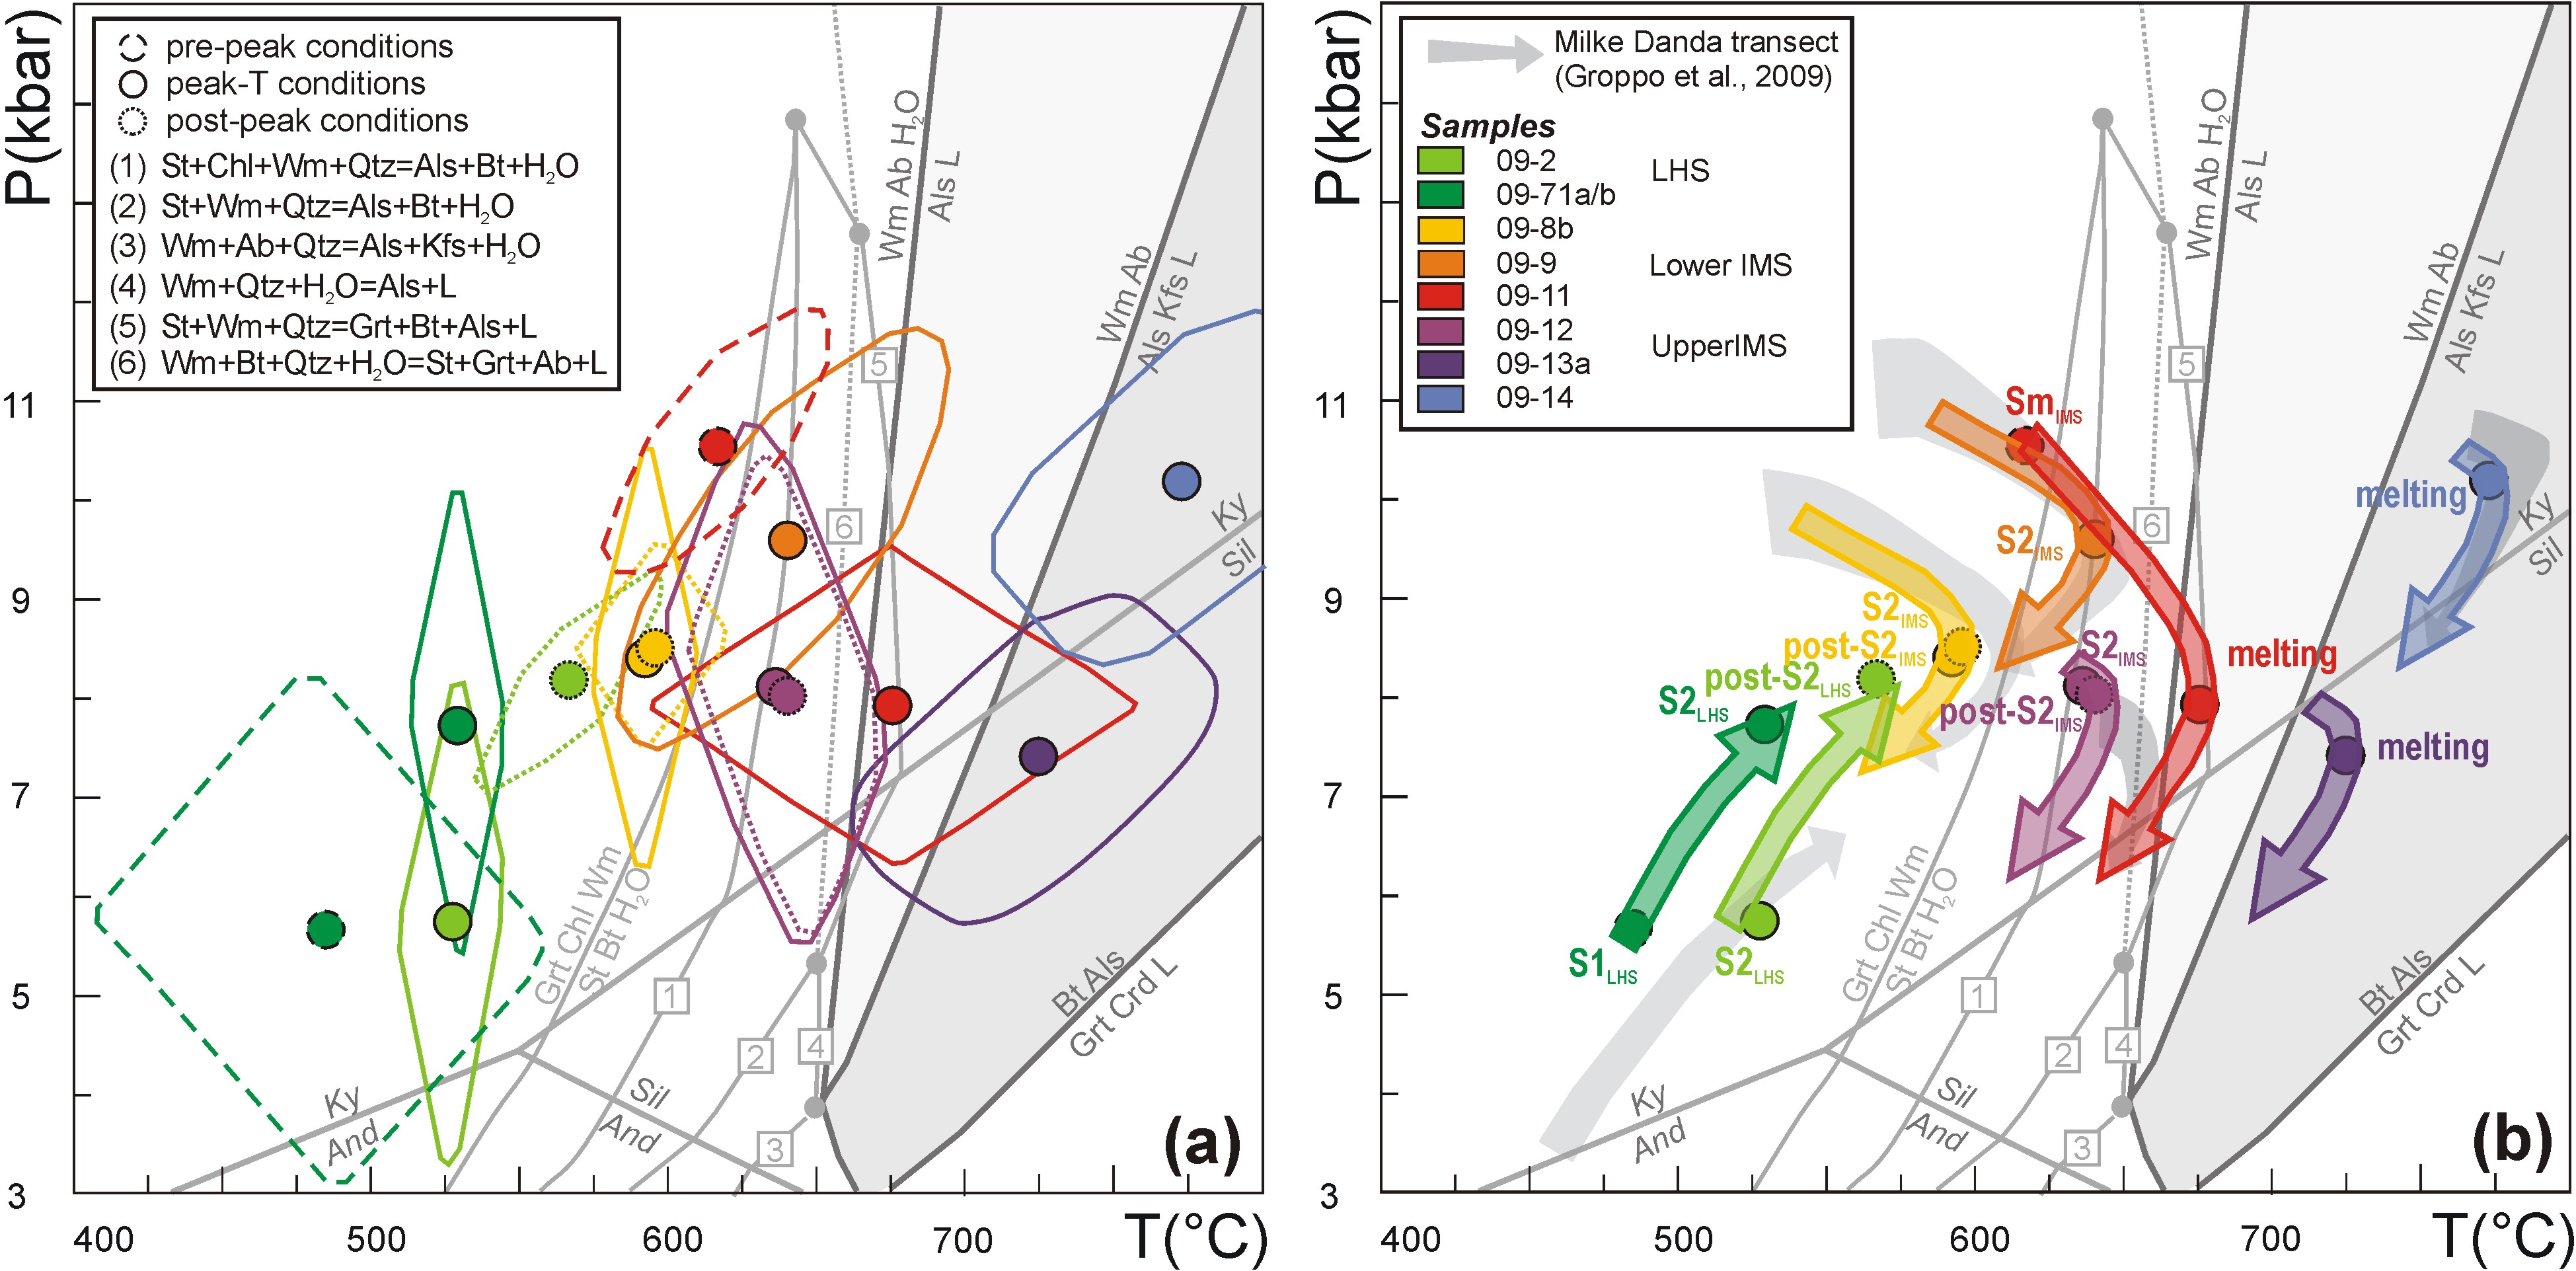
Figure 12. P-T diagrams showing the results of thermobarometry
(a) P-T conditions estimated using the “Average PT” method applied to the low-variant equilibrium assemblages reported in Figure 6 and Table 6. 1σ error ellipses have been calculated using the parameters from THERMOCALC. NKFMASH petrogenetic grid (both thick and thin grey lines) are from Spear et al. (1999). The thick dark grey lines represent the main melt-producing reactions and delimitate the H2O-saturated melting field (light grey field) from the H2O under-saturated de-hydration melting of muscovite and biotite field (dark grey field). The thin light-grey lines constrain the stability field of staurolite according to Spear et al. (1999) and show a possible staurolite de-hydration melting reaction (reaction 5). (b) P-T paths inferred for the studied samples based on thermobarometric results and mineral compositions, and comparison with the P-T paths of the nearby Milke Danda transect (grey trajectories: Groppo et al., 2009).
The main P-T results are summarized below, starting from the structurally lowermost samples.
The three phylladic micaschists from the LHS (samples 09-2, 09-71a and 09-71b) define similar peak P-T conditions of about 530-560°C, 7.7-9.1 kbar, corresponding to the development of the S2LHS and post-S2LHS assemblages. Sample 09-71a provides additional information about the LHS prograde evolution, suggesting an increase in both P and T from about 480-490°C, 5.0-5.5 kbar (S1LHS assemblage) up to peak metamorphic conditions (Fig. 12b).
The mylonitic orthogneisses from the lowermost portion of the IMS do not define enough reactions for “Average PT” to work, therefore it is not possible to constrain P-T conditions of their equilibration in the framework of the same methods used for other samples.
The results obtained from the lower IMS, not-anatectic, metapelitic samples 09-8b, 09-9 and 09-12 suggest that equilibration P-T conditions of the syn-S2IMS assemblages are approximately the same as those of the post-S2IMS assemblages (Fig. 12a), and in the range 600-650°C, 8.5-9.5 kbar (samples 09-8b and 09-9) and 640-650°C, ca. 8.0-8.1 kbar (sample 09-12). Samples 09-8b and 09-9 provide little information about their prograde evolution: garnet zoning (i.e. XMg increasing toward the rim) suggests an heating prograde evolution up to peak-T conditions coinciding with the syn-S2IMS assemblages (Fig. 12b), but does not provide information about pressure. On the contrary, garnet from sample 09-12 is almost unzoned, but muscovite composition (Si content is higher in the S1IMS muscovite with respect to the S2IMS muscovite) suggests that the S1IMS assemblage grew at higher pressure than the S2IMS assemblage (i.e. prograde decompression: Fig. 12b).
As concerning the upper IMS anatectic metapelitic samples (09-11, 09-13a and 09-14), the “Average PT” results point to peak-T conditions in the range 680-770°C, 7.4-10.2 kbar. The lowest peak-T conditions (i.e. 680°C, sample 09-11) are compatible with the vapour-saturated melting of muscovite (Fig. 12b), producing very limited amounts of melt. This is consistent with microstructural observations, showing that muscovite is locally still preserved, but small amounts of peritectic garnet are also present. Peak-T conditions estimated for sample 09-13a and 09-14 (725-770°C) are consistent with H2O-undersaturated de-hydration melting of muscovite (and eventually biotite) (Fig. 12b; Groppo et al., 2012), as also evidenced by microstructures (i.e. absence of muscovite, presence of peritectic garnet and K-feldspar). The prograde history of such anatectic samples is difficult to be constrained mainly because mineral compositions were widely reset by diffusional re-homogenization at peak-T. Sample 09-11 preserves useful mineral compositional information, constraining a prograde heating and decompression evolution from about 620°C, 10.6 kbar to 680°C, 7.9 kbar (Fig. 12b). A heating and decompression evolution is also suggested (but not equally well constrained) for sample 09-14, basing on the garnet zoning (i.e. XCa decreasing toward the rim).