Acknowledgements
Field and laboratory work was carried out thanks to contributions from the CNR-IGG, UO Torino (P.M. and F.R.) and from PRIN Cofin 2006 and ex-60% founds (C.G. and F.R.). Further support by Ev-K2-CNR in the framework of SHARE - Stations at High Altitude for Research on the Environment - Project is also acknowledged. B. Lombardo is warmly thanked for lively discussions on Himalayan geology. Constructive comments and suggestions by S. Guillot and M. Zucali considerably improved the final version of the manuscript.
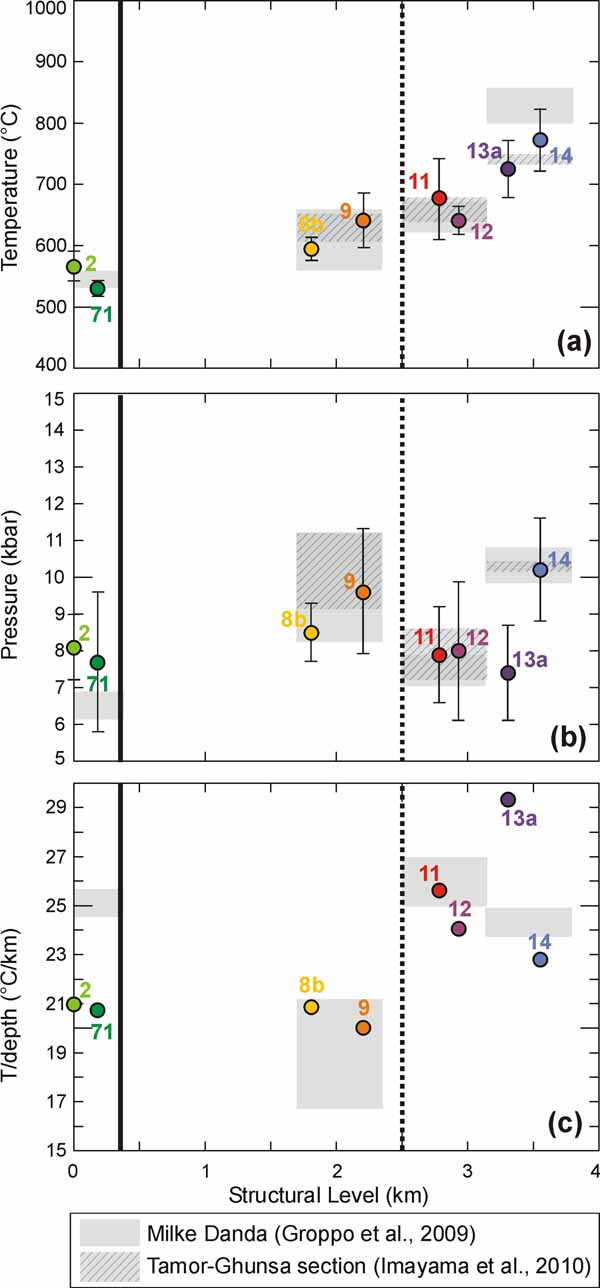
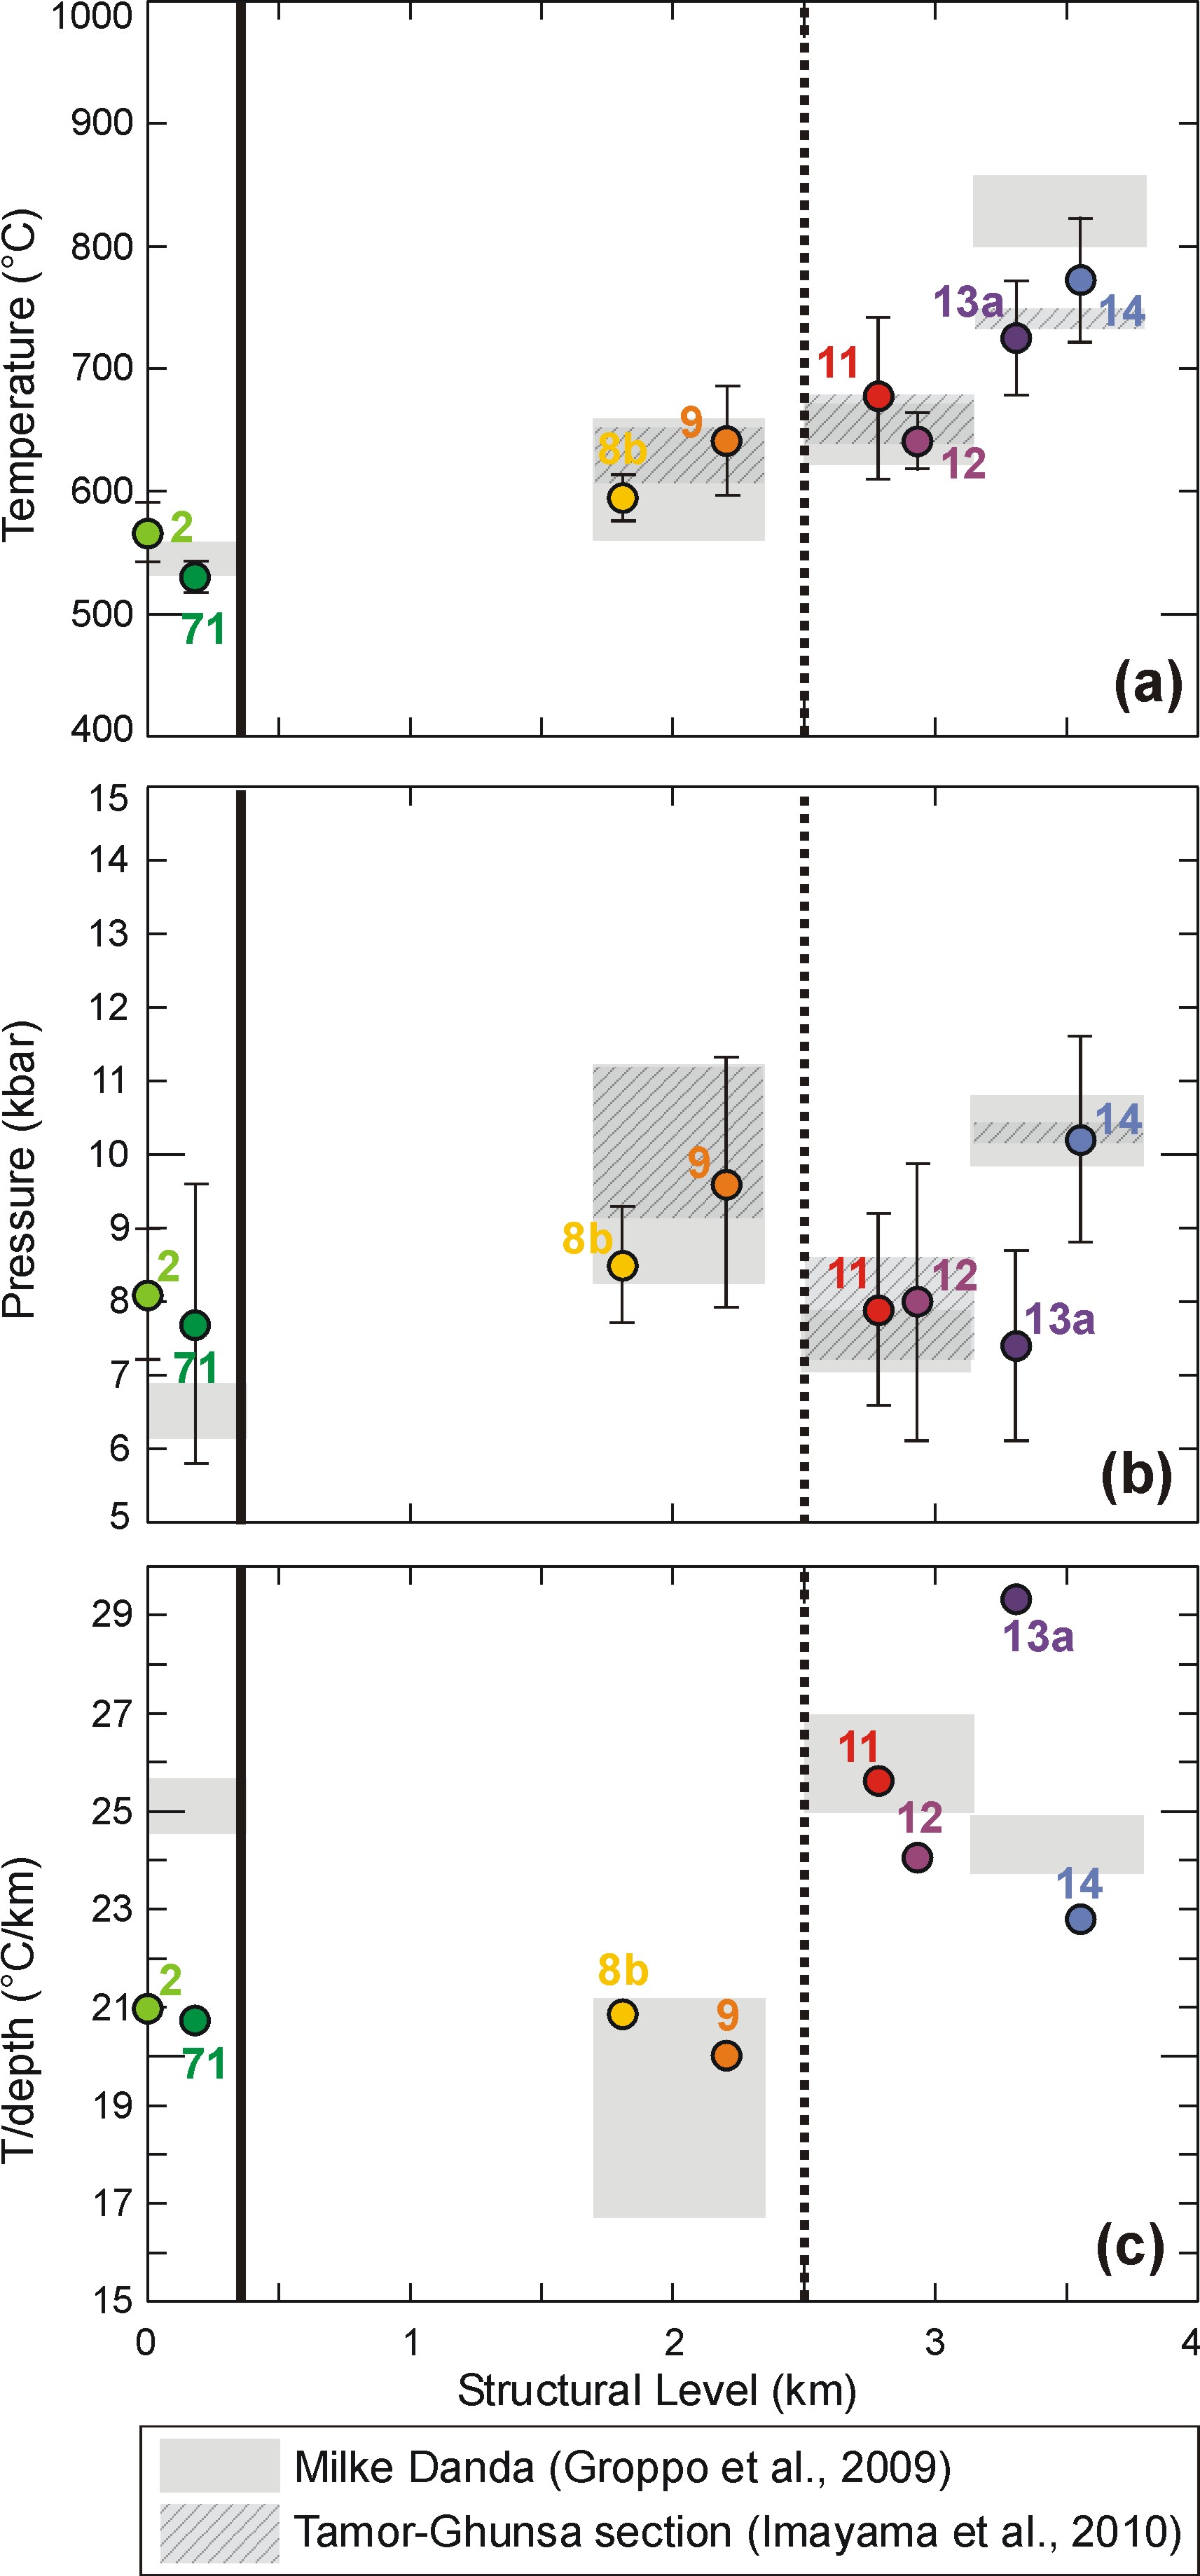
Figure 13. Temperatures (a) and pressures (b) referred to the peak metamorphic conditions, and T/depth ratios (c), reported as a function of structural level
Structural level is calculated as the relative distance from the structurally lowest sample (09-2) and assuming an average lithostatic pressure gradient of 0.3 kbar/km. Error bars in the “Average P-T” data are 1σ errors. The dashed black line corresponds to the position of the MCT (as originally defined by Heim and Gansser, 1939), located at the base of the mylonitic augen-gneisses. The dotted black line represents the position of the inferred metamorphic discontinuity within the MCTZ, juxtaposing the upper IMS rocks characterized by higher T/depth gradients on the lower IMS rocks, characterized by lower T/depth gradients. Grey fields synthesize the main results of Groppo et al. (2009) and Imayama et al. (2010) along the Milke Danda and Tamor-Ghunsa Khola transects, respectively.