Mineral chemistry
X-Ray maps and minerals were analysed (Table 1) with an Electron Microprobe (EPMA) and a Scanning Electron Microscope (SEM) at the Dipartimento di Scienze della Terra “A. Desio” – Università degli Studi di Milano. The operating conditions were 20kV accelerating voltage, filament intensity 1.70A and probe intensity of 280pA. Beam sizes were < 1µm, 4µm and 10µm. Natural silicates were used as standards and matrix corrections were calculated with ZAF (Z=atomic number, A=absorption, F=fluorescence) procedure.
The relative chronology used for mineral phases (e.g. BtI and BtII; WmI and WmII) is inferred from microstructural analysis and thus only corresponds to the microstructural sites occupied by each group of minerals, their textures, microstructures and optical properties. The inferred chronology does not necessarily correspond to differences in chemical composition.
In this paragraph mineral phases chemical compositions are discussed with respect to the microstructural relative chronology, to check the occurrence of the expected chemical variation.
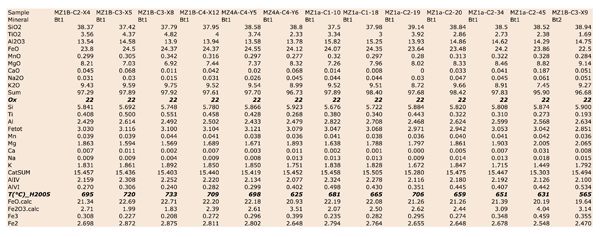
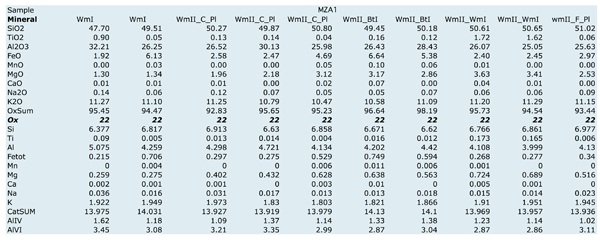
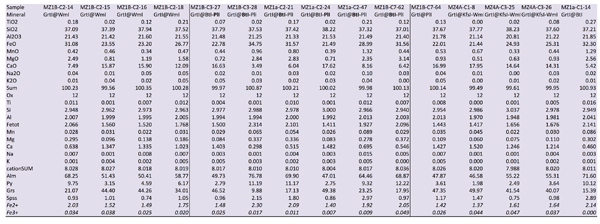
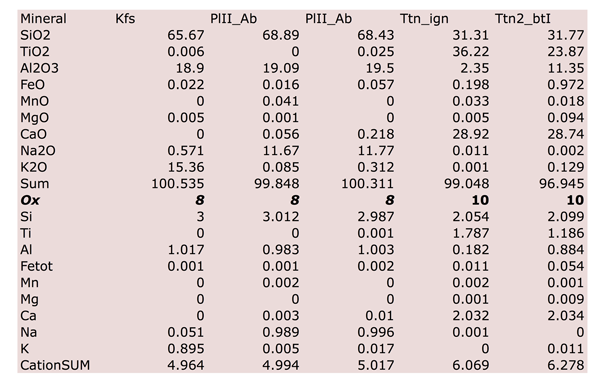
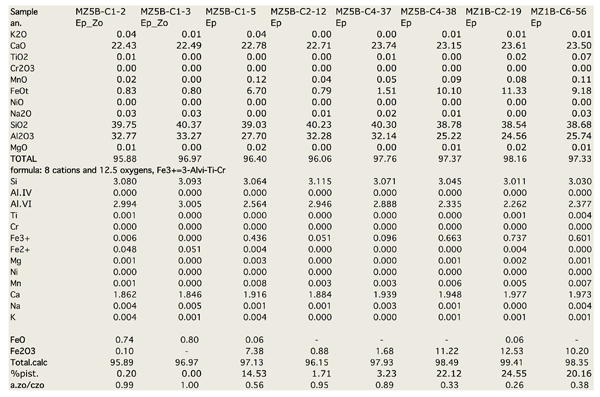
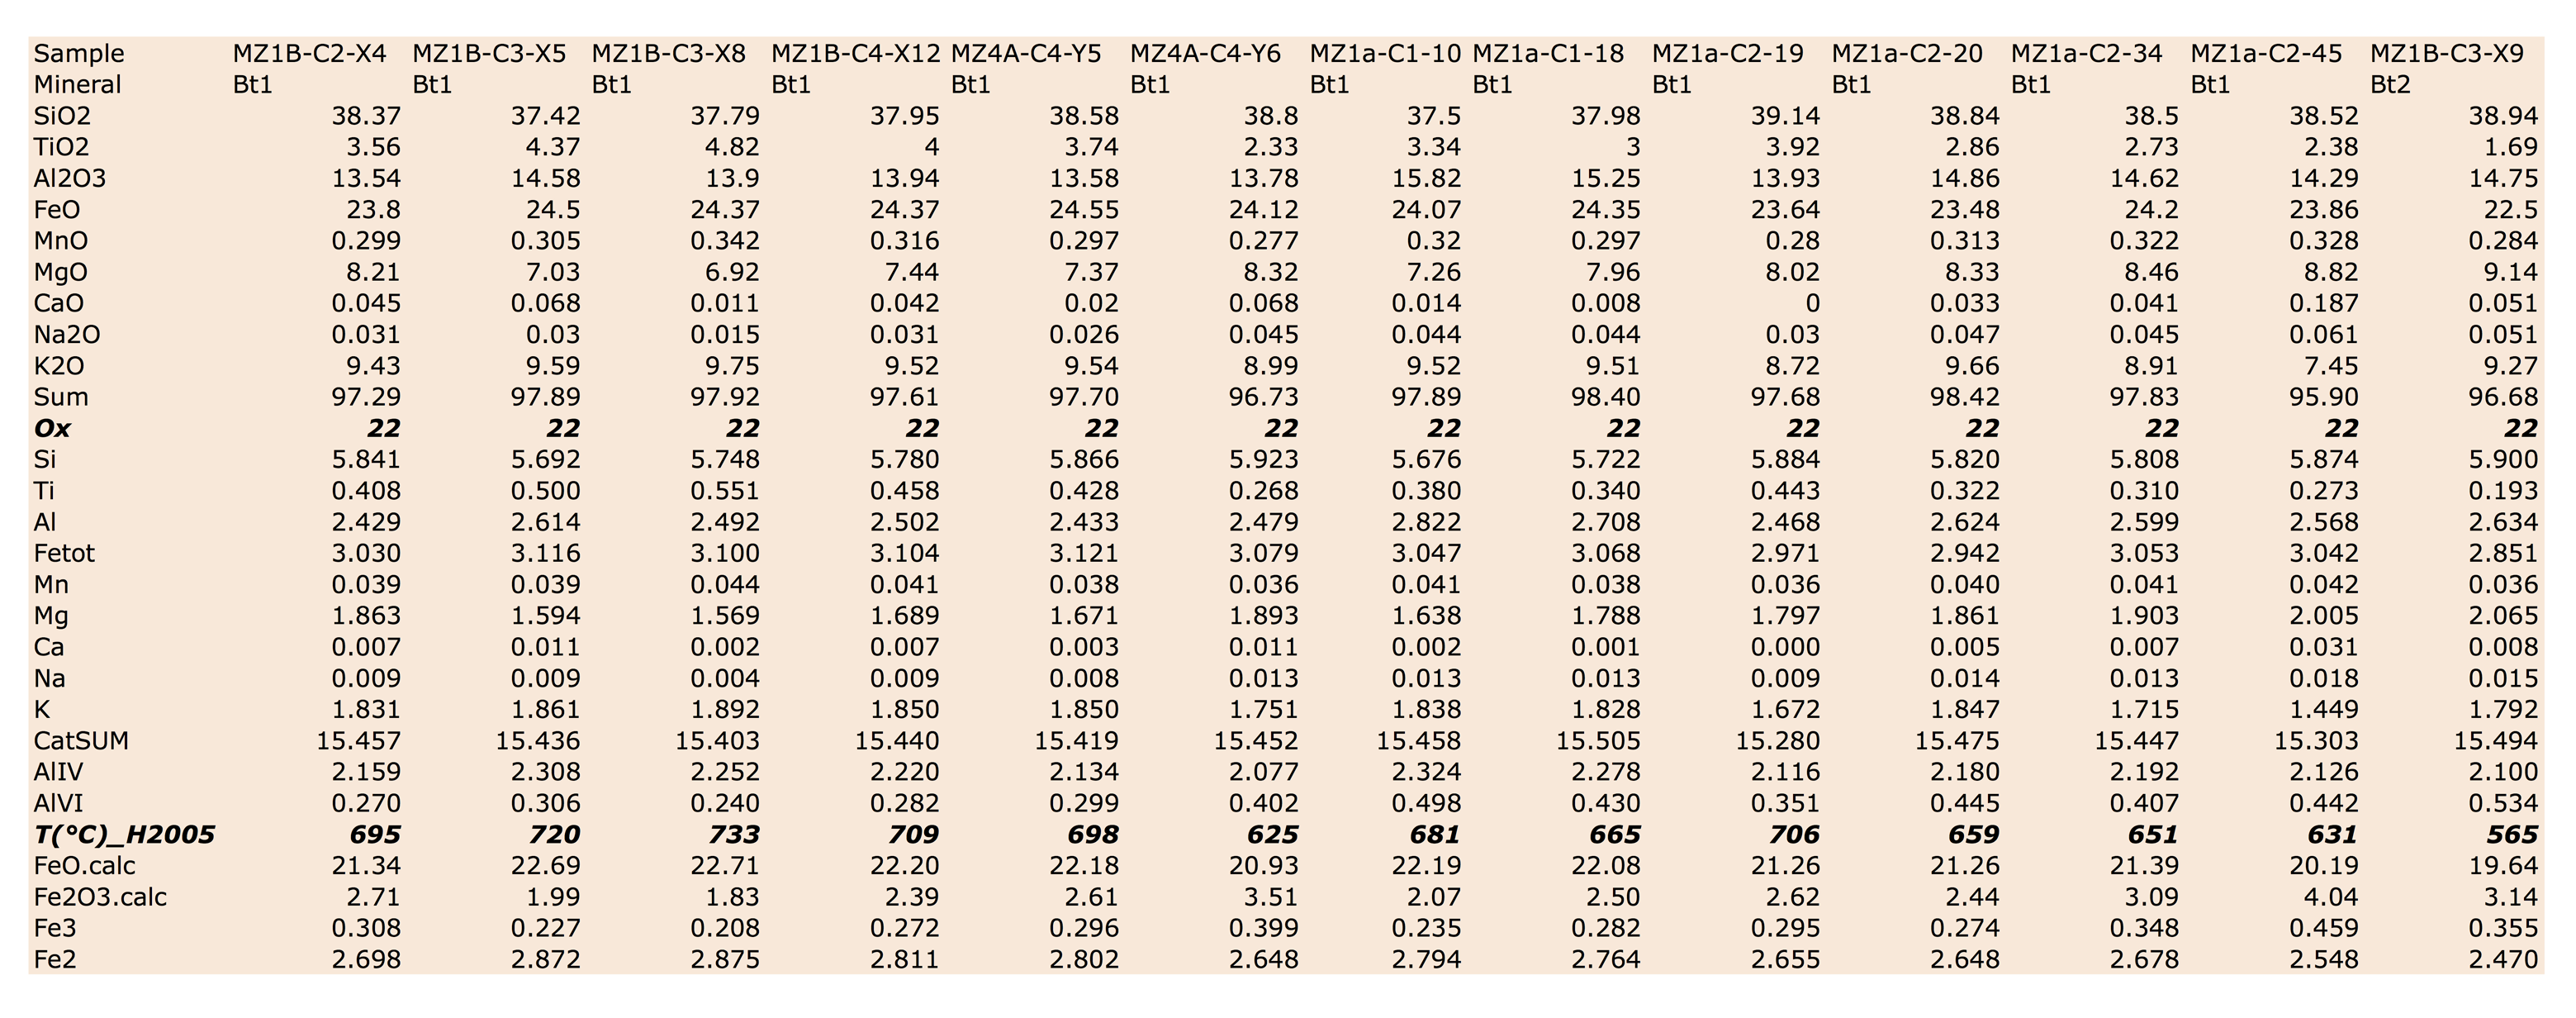
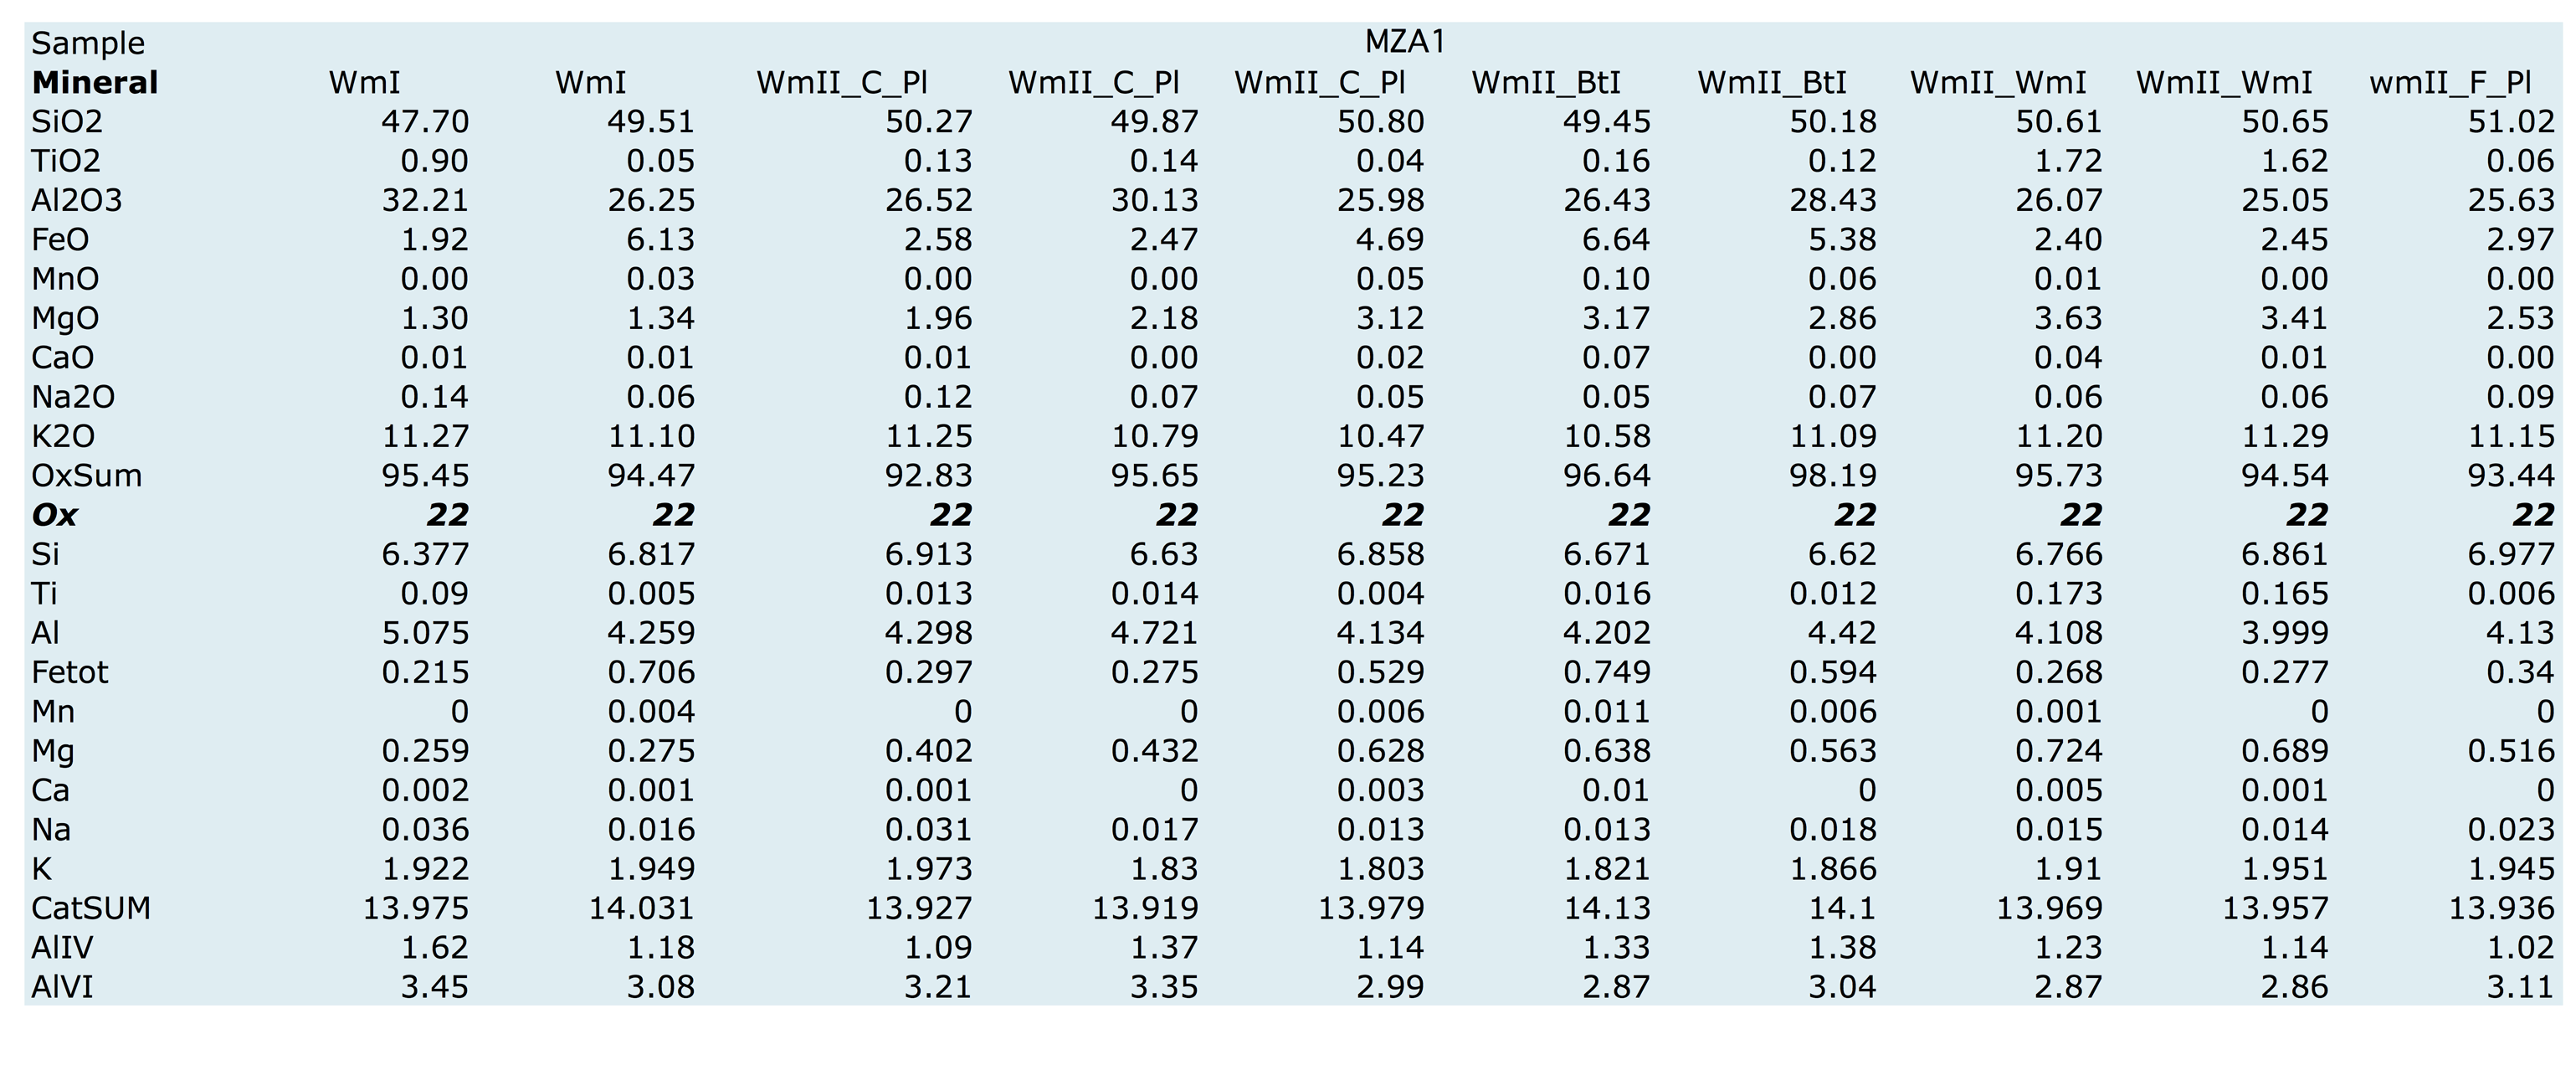
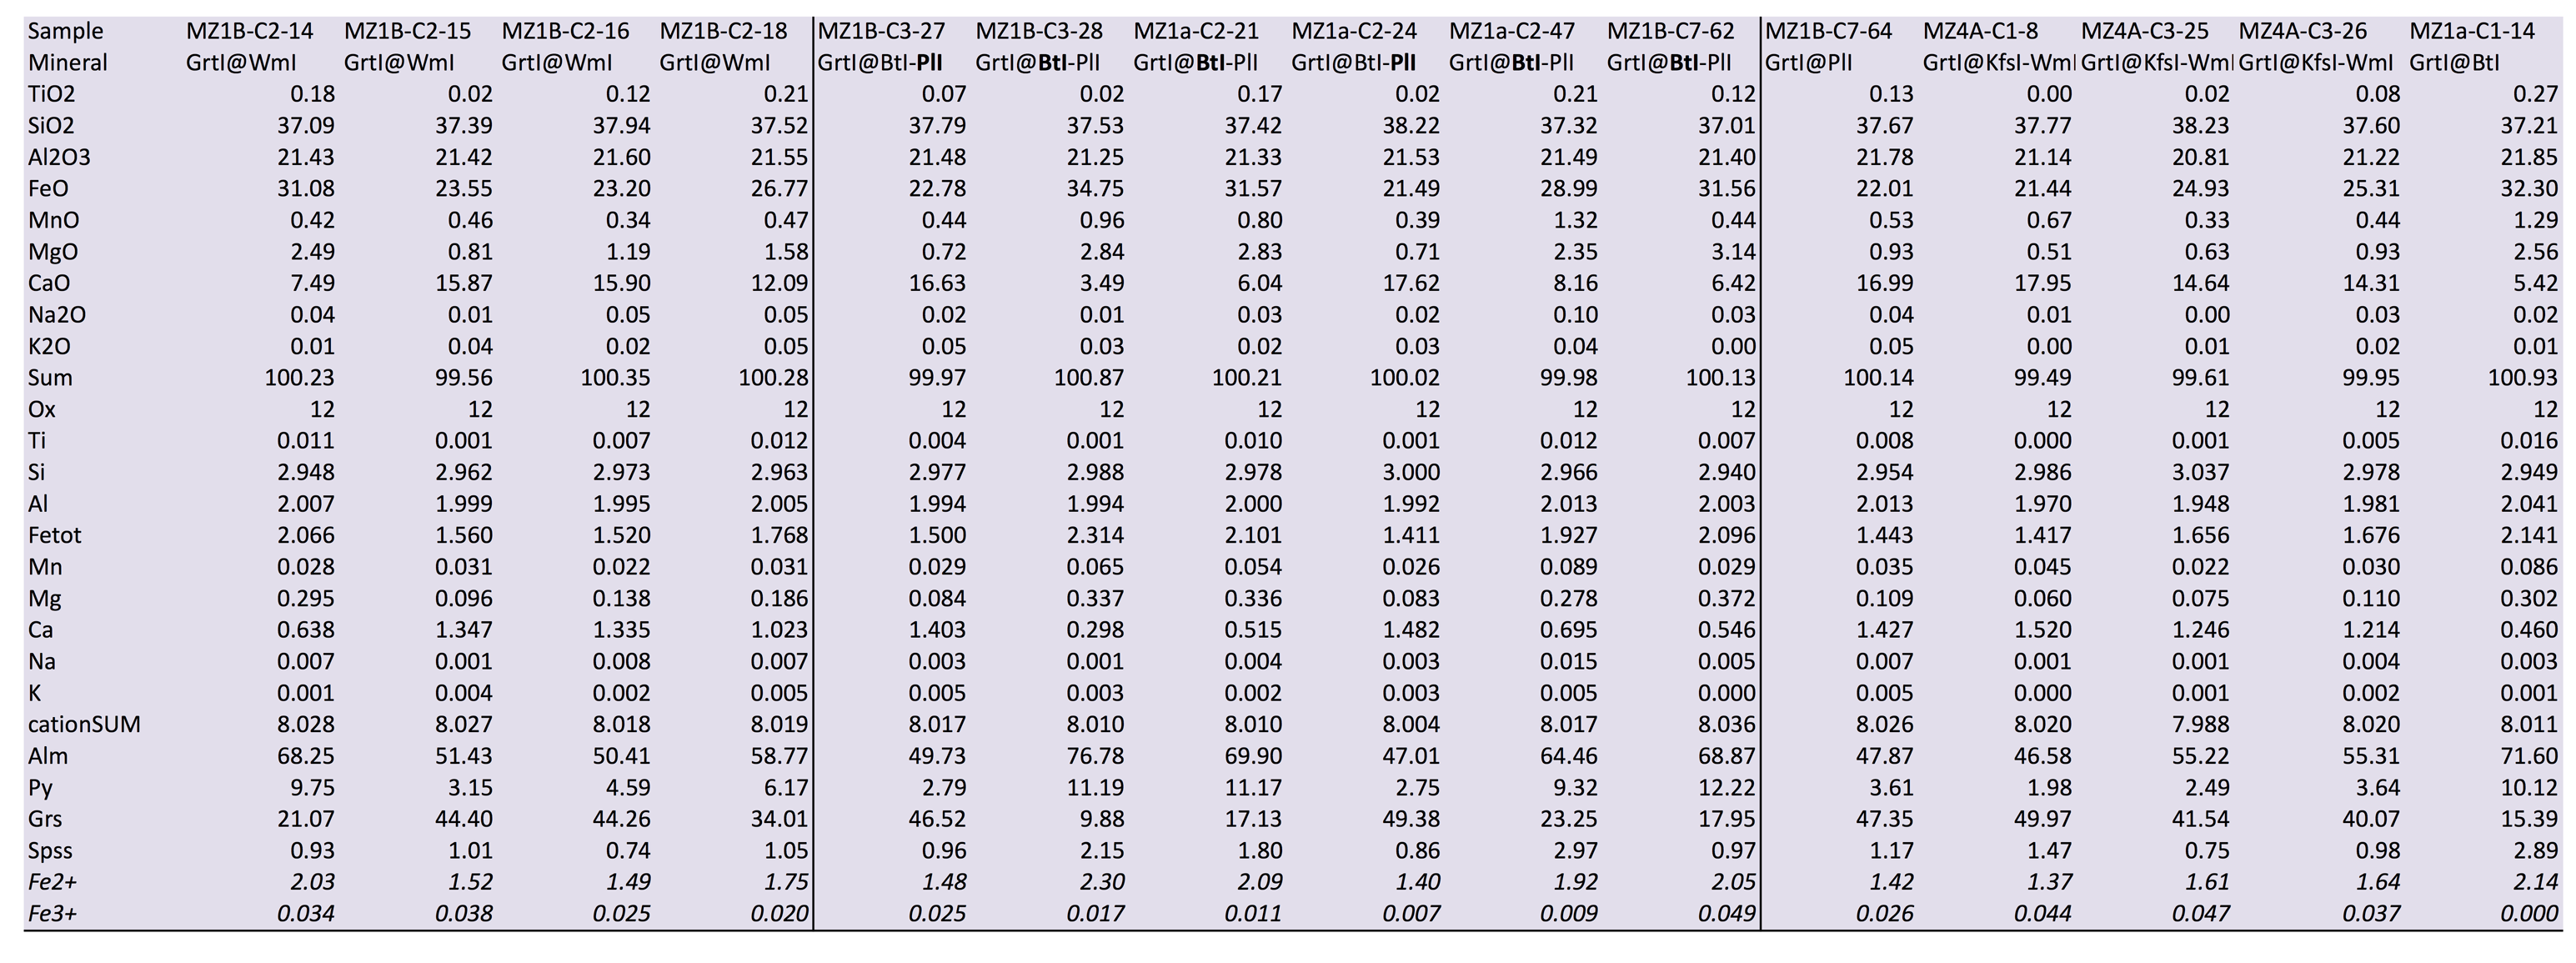
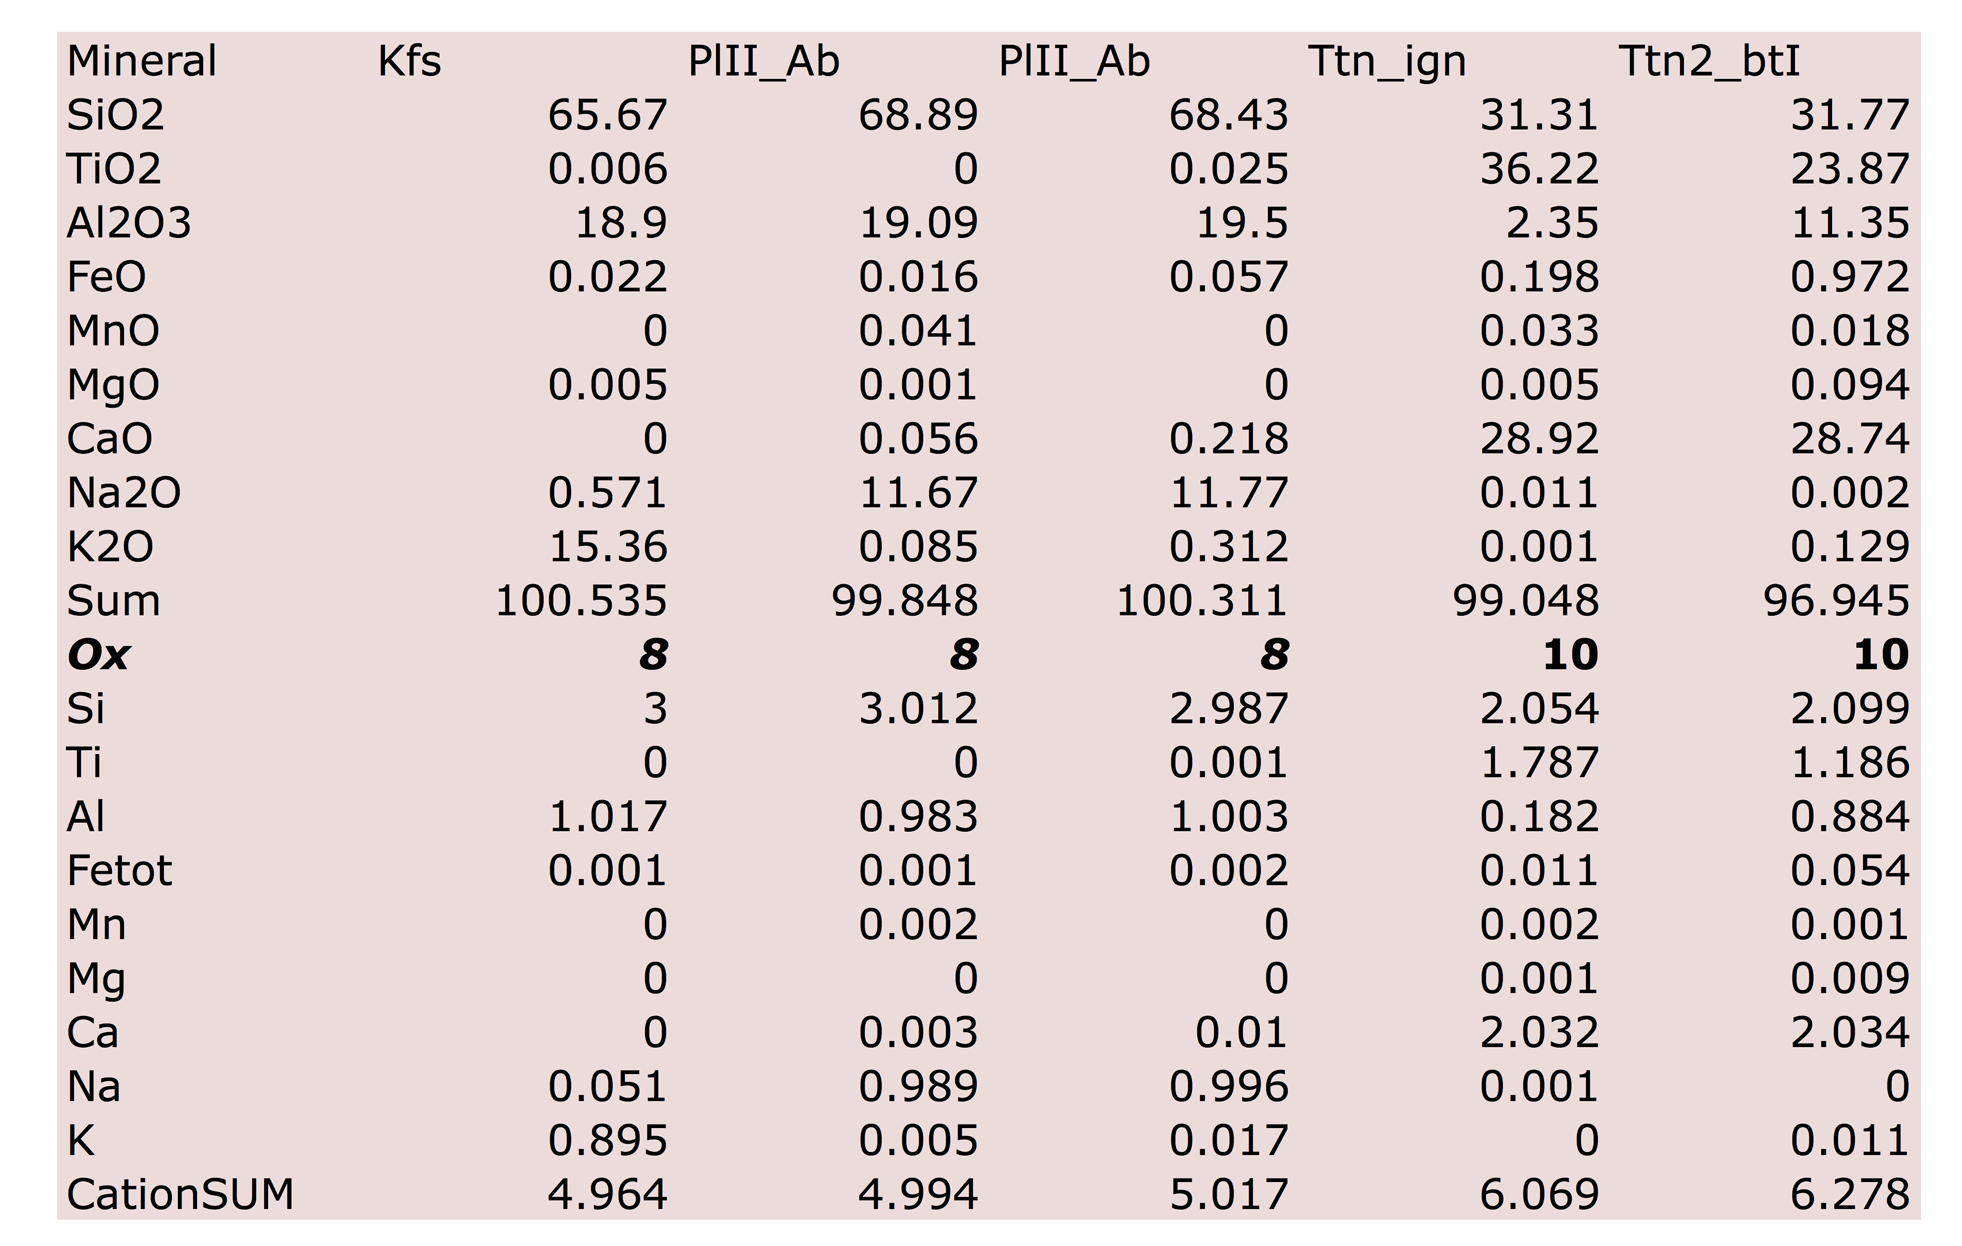
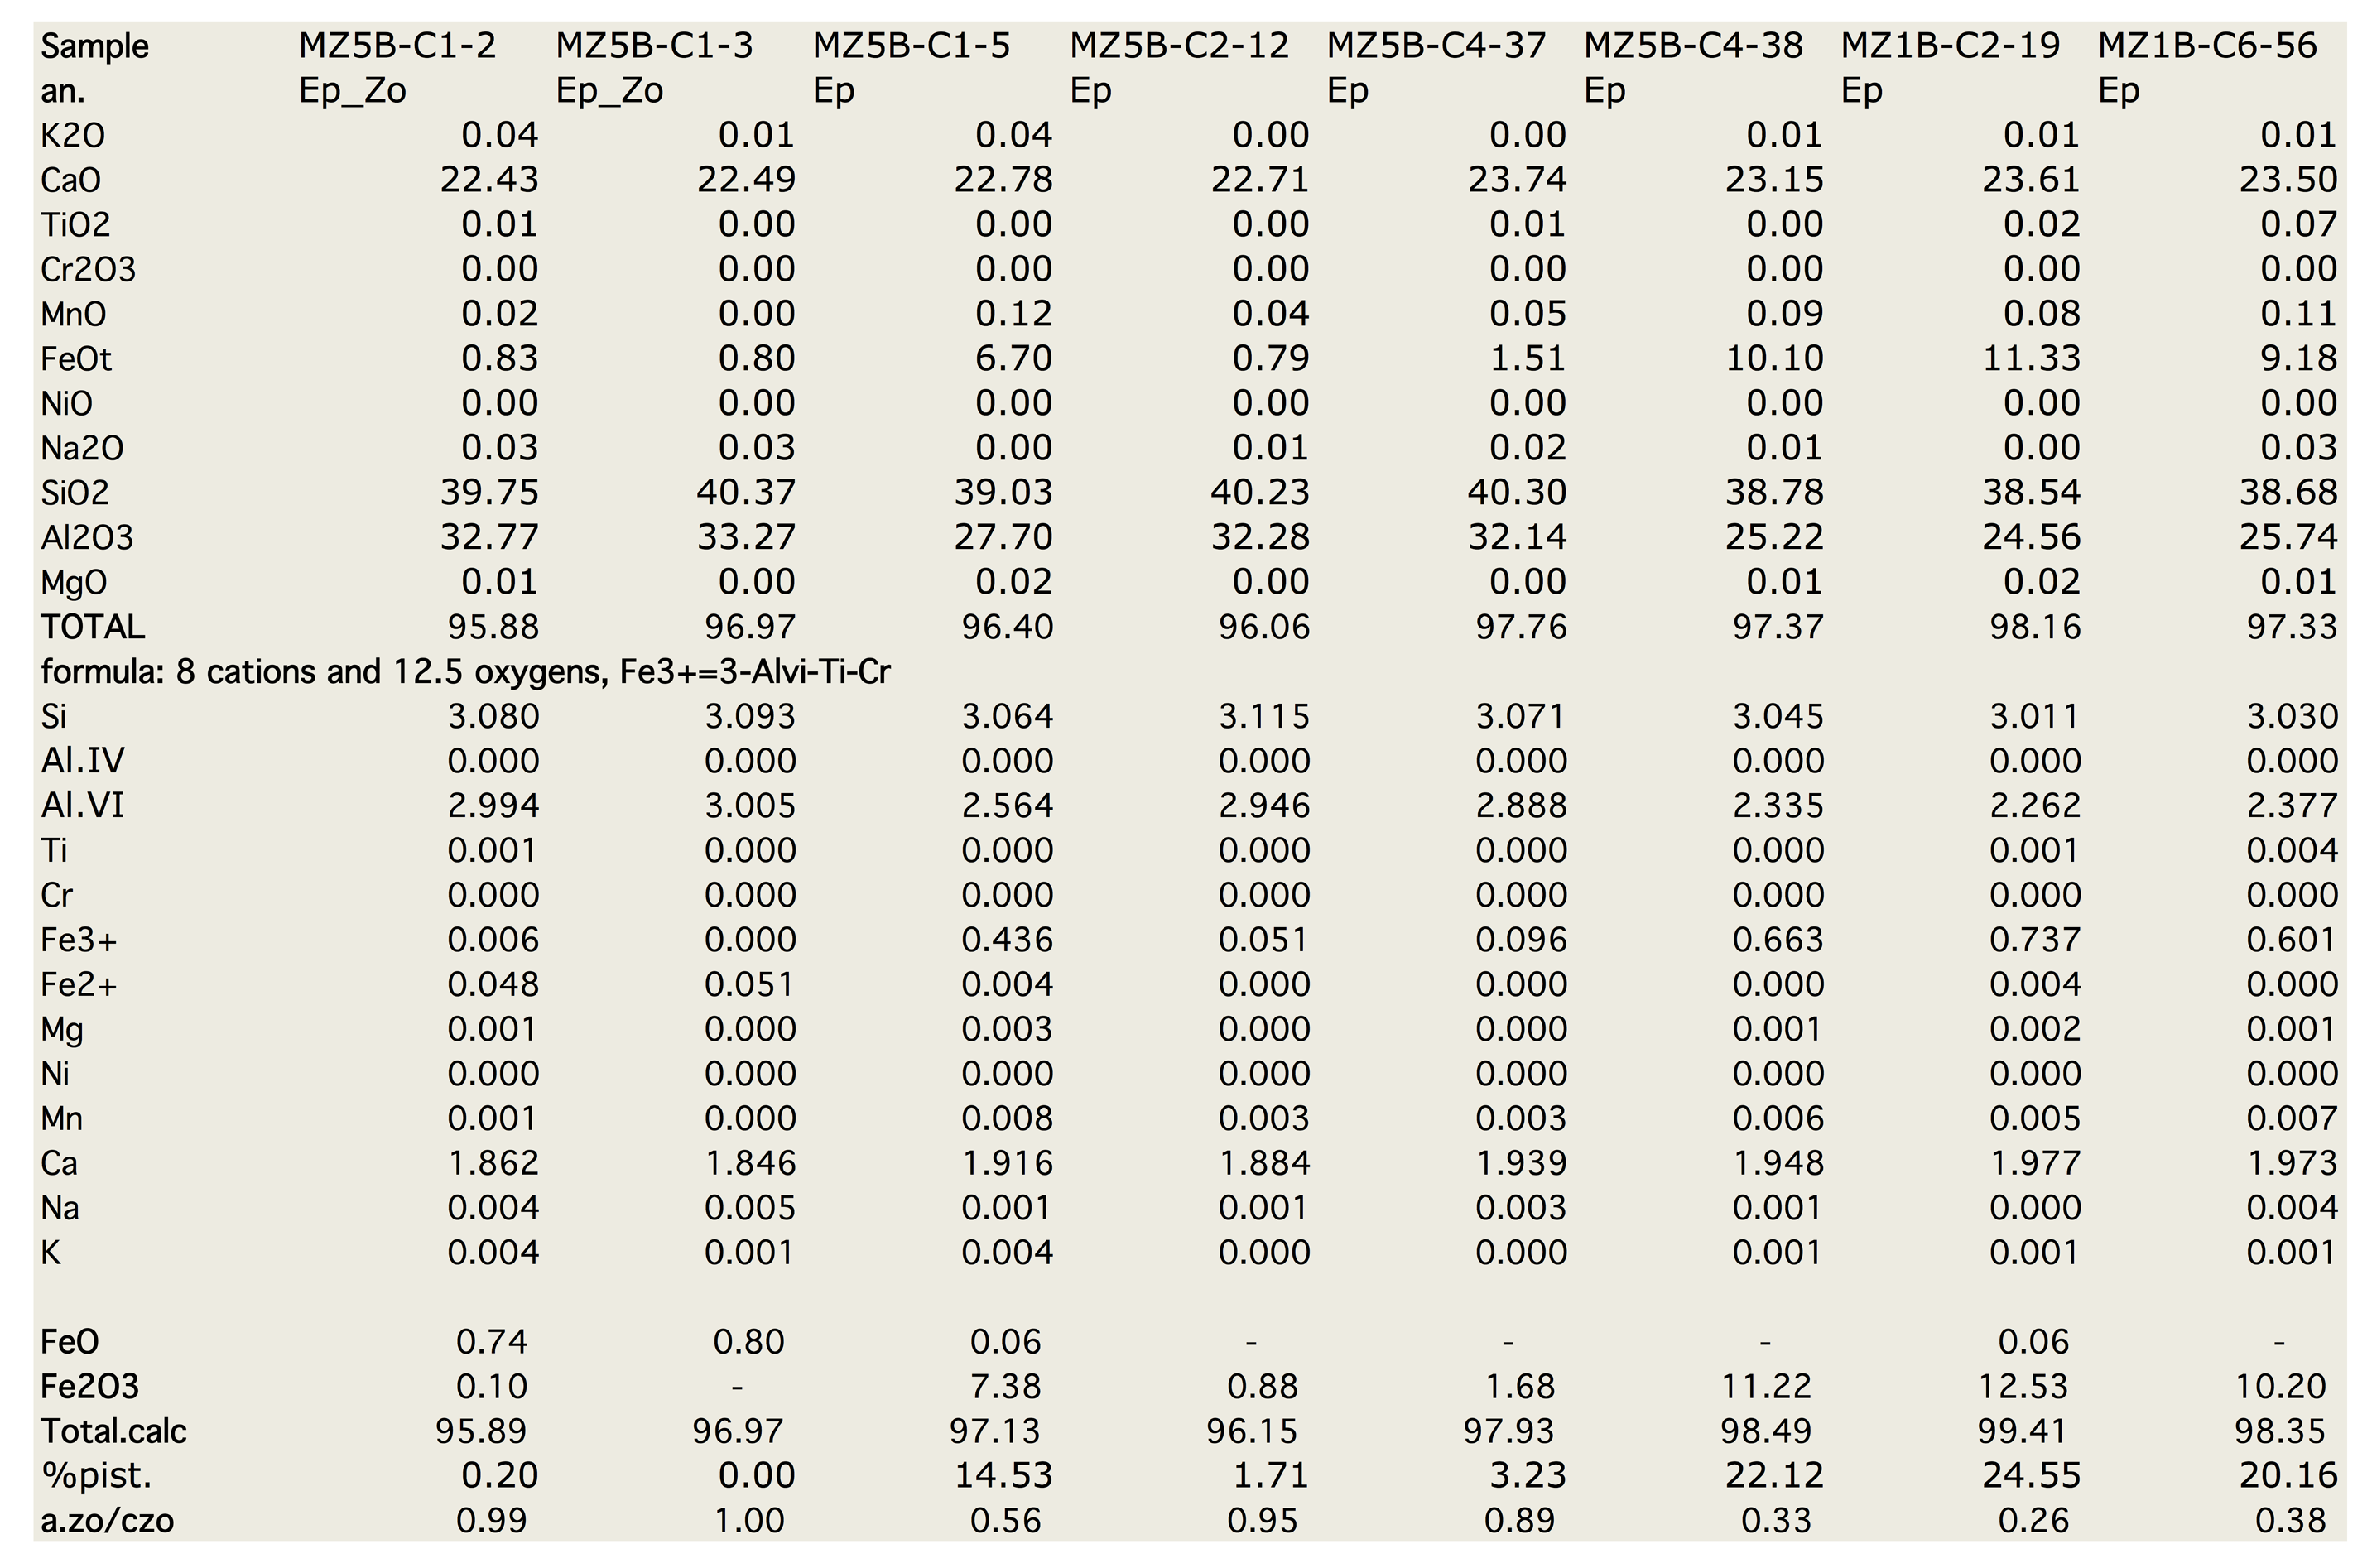
Figure Table 1. Selected chemical compositions for principal mineral phases, separated on the basis of their microstructural position.
Biotite (Bt)
Igneous biotites (BtI in Figs. 4, 6, 7, Table 1 are characterized by high Ti content that ranges from 0.30 to 0.55 a.p.f.u. Ti content intervals correspond to Mg contents ranging from 1.89 to 1.57 a.p.f.u. Fetot (all Fe as Fe2+) ranges from 3.00 to 4.22 a.p.f.u. and AlVI from 0.20 to 0.40 a.p.f.u. (Table 1). These chemical intervals (Fig. 7) correspond to igneous composition (Deer et al. 1996).
BtII corresponds to the darker parts of BtI grains in BSE images (Fig. 4, Fig. 7) or generally to the rims of BtI grains; BtII is generally enriched in Mg and poorer in Ti with respect to BtI (Fig 7). These trends are well described in Fig. 7 where the Ti vs. Mg diagram shows this continuous relation.
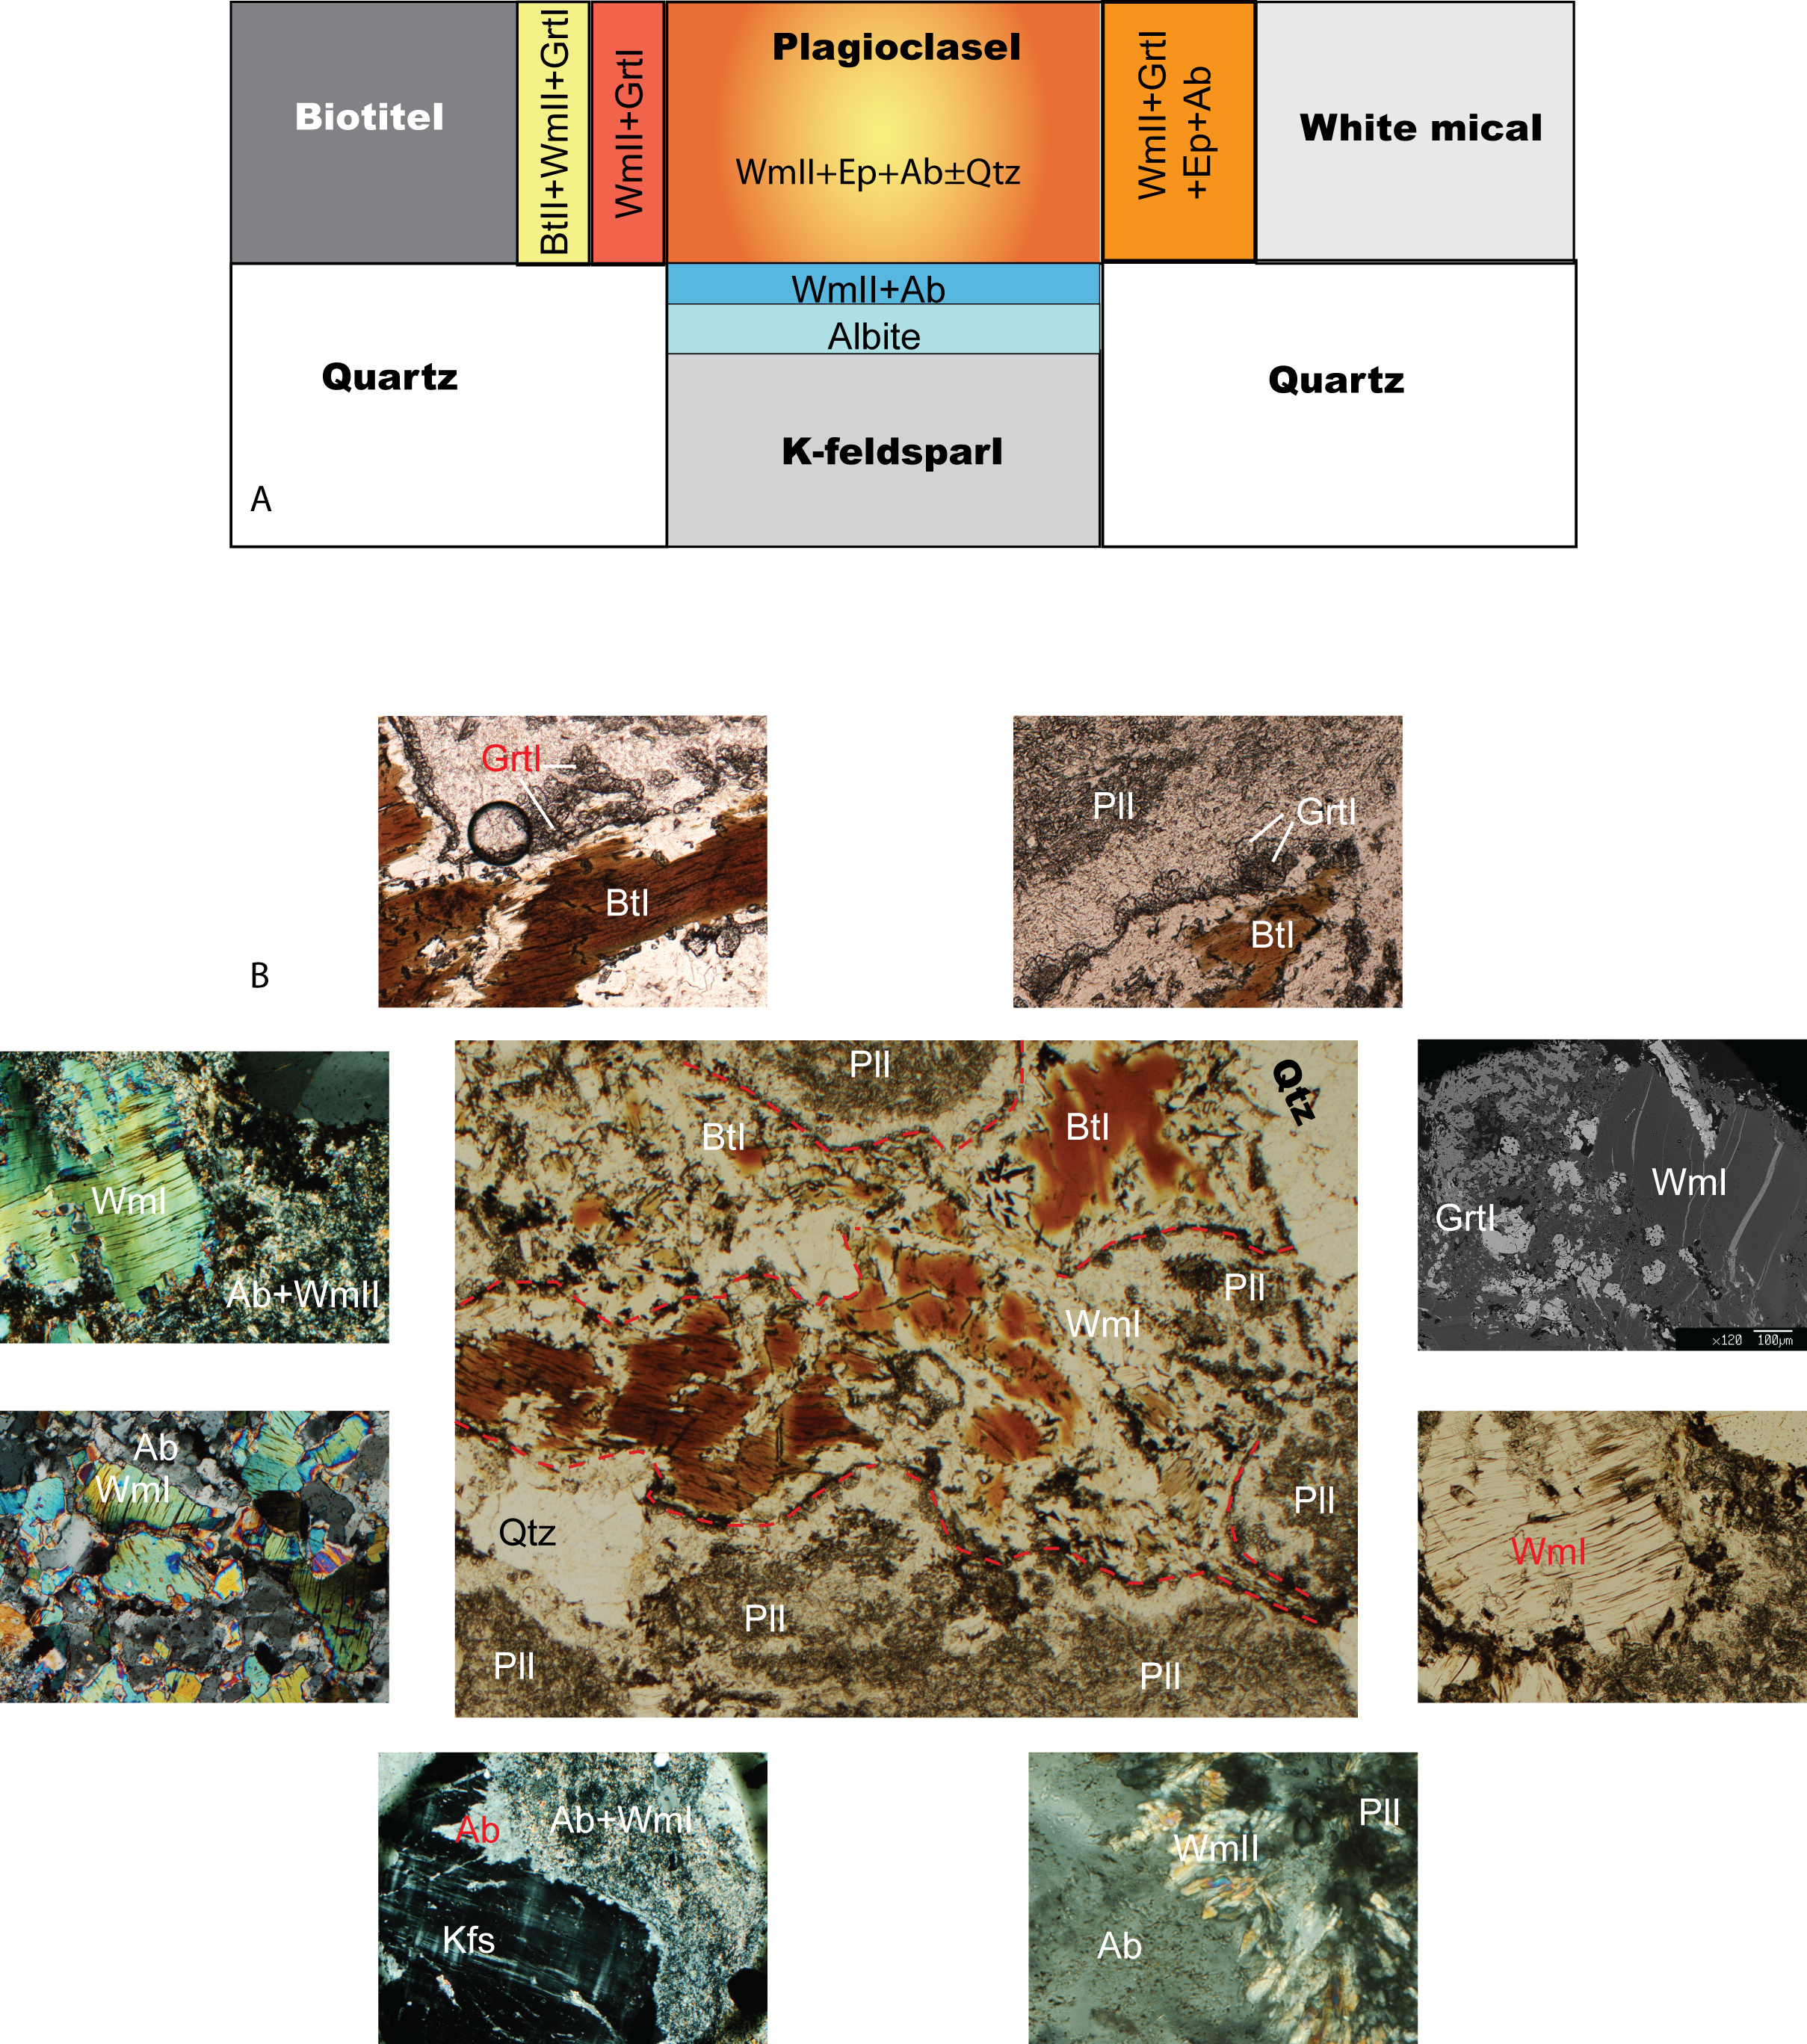
Figure 6. Schematic and Panoramic views
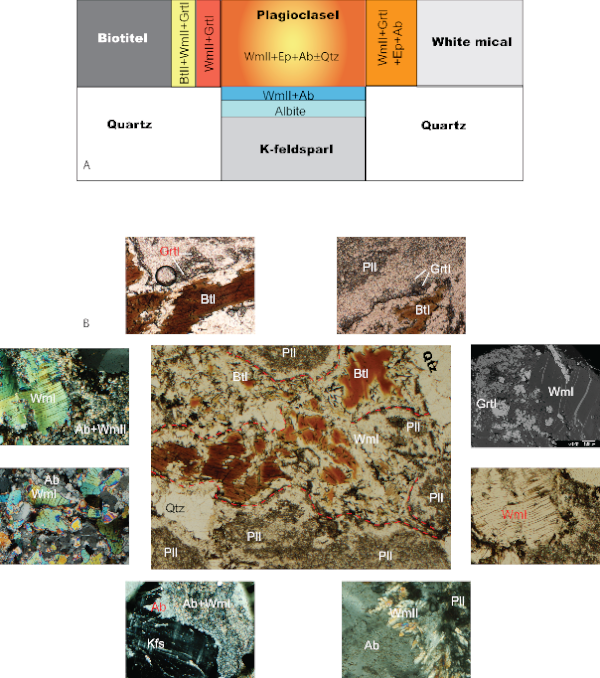
A) Schematic view of the igneous microdomain and their main features during the post-igneous transformations inferred from microstructural analysis. B) Panoramic view of the relations between igneous microdomains and Alpine coronas with details for each specific microstructure and mineral assemblage. Red dashed lines indicate inferred grain boundaries between igneous minerals.
Figure 7. Diagrams showing the Biotite and Garnet chemical compositions and variations with respect to their positions within corona textures.
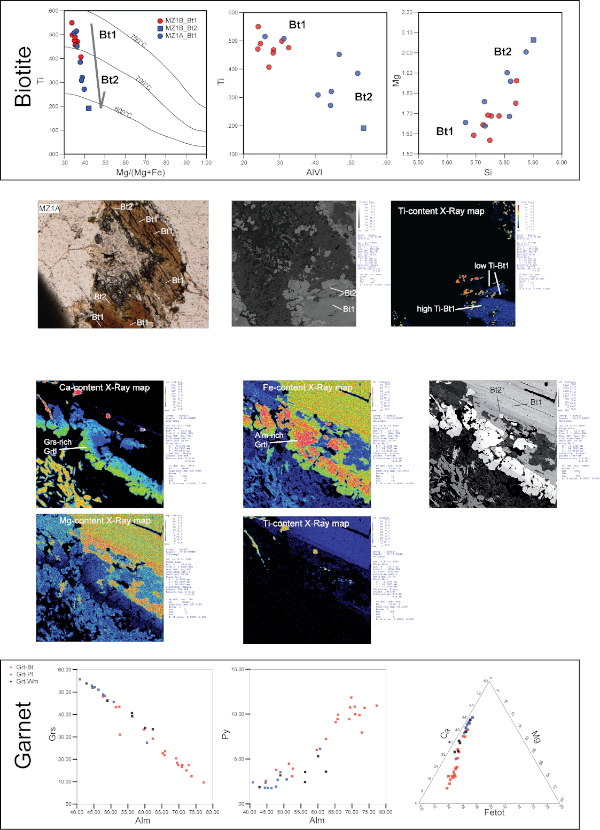
Ti vs. Mg/(Mg+Fe) diagram of biotites also shows the evolution from high-temperature BtI to lower-temperature BtII as described by Henry et al. (2005). Color-enhanced X-ray maps show the distribution of Ca, Fe, Mg and Ti in the reaction corona between PlI and BtI.
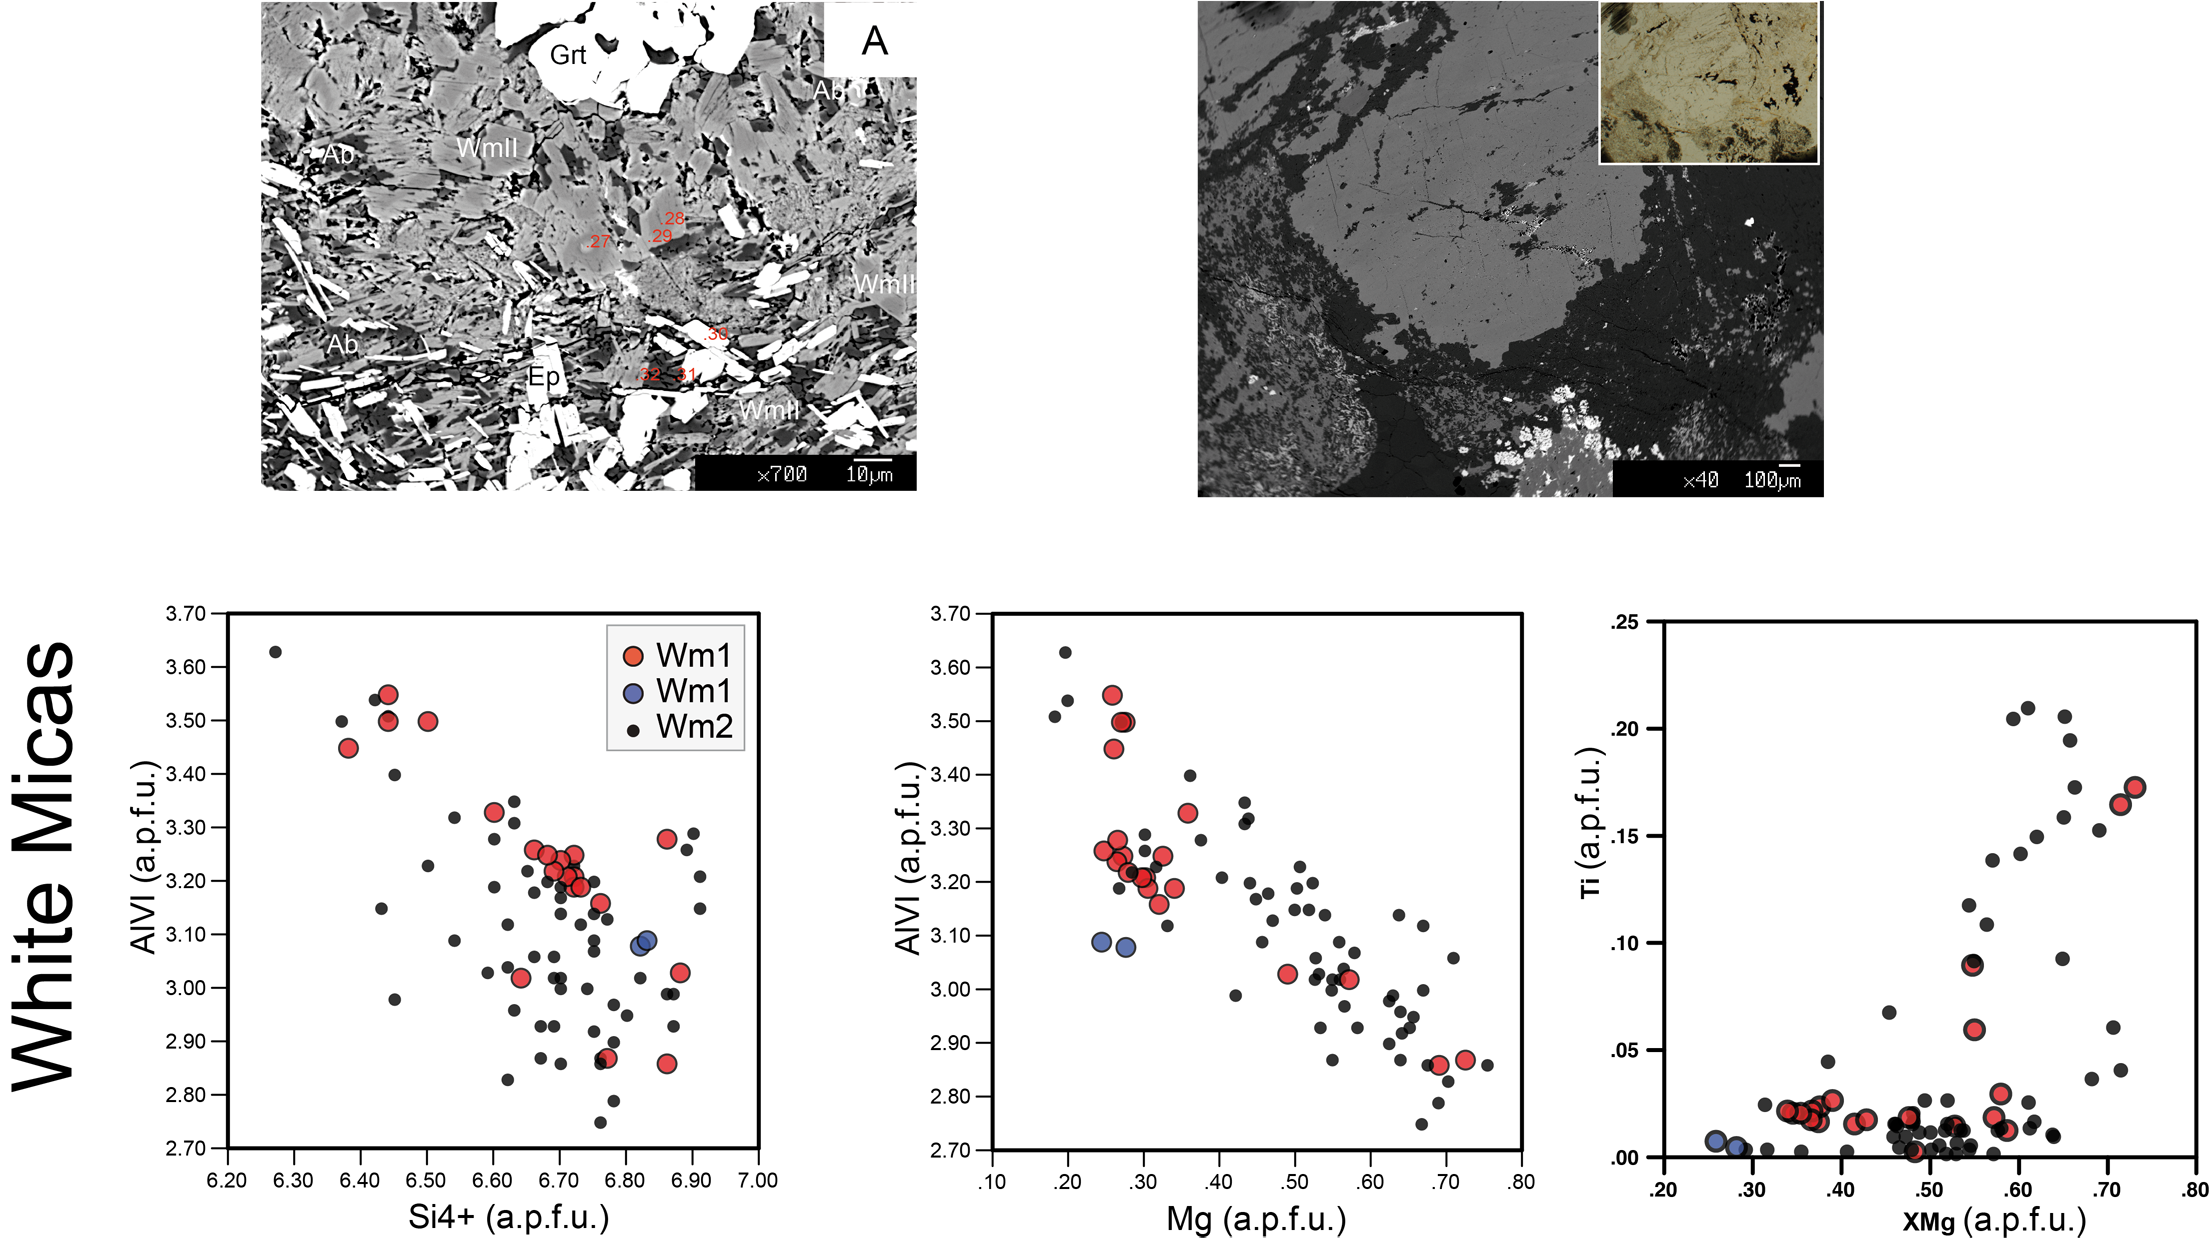
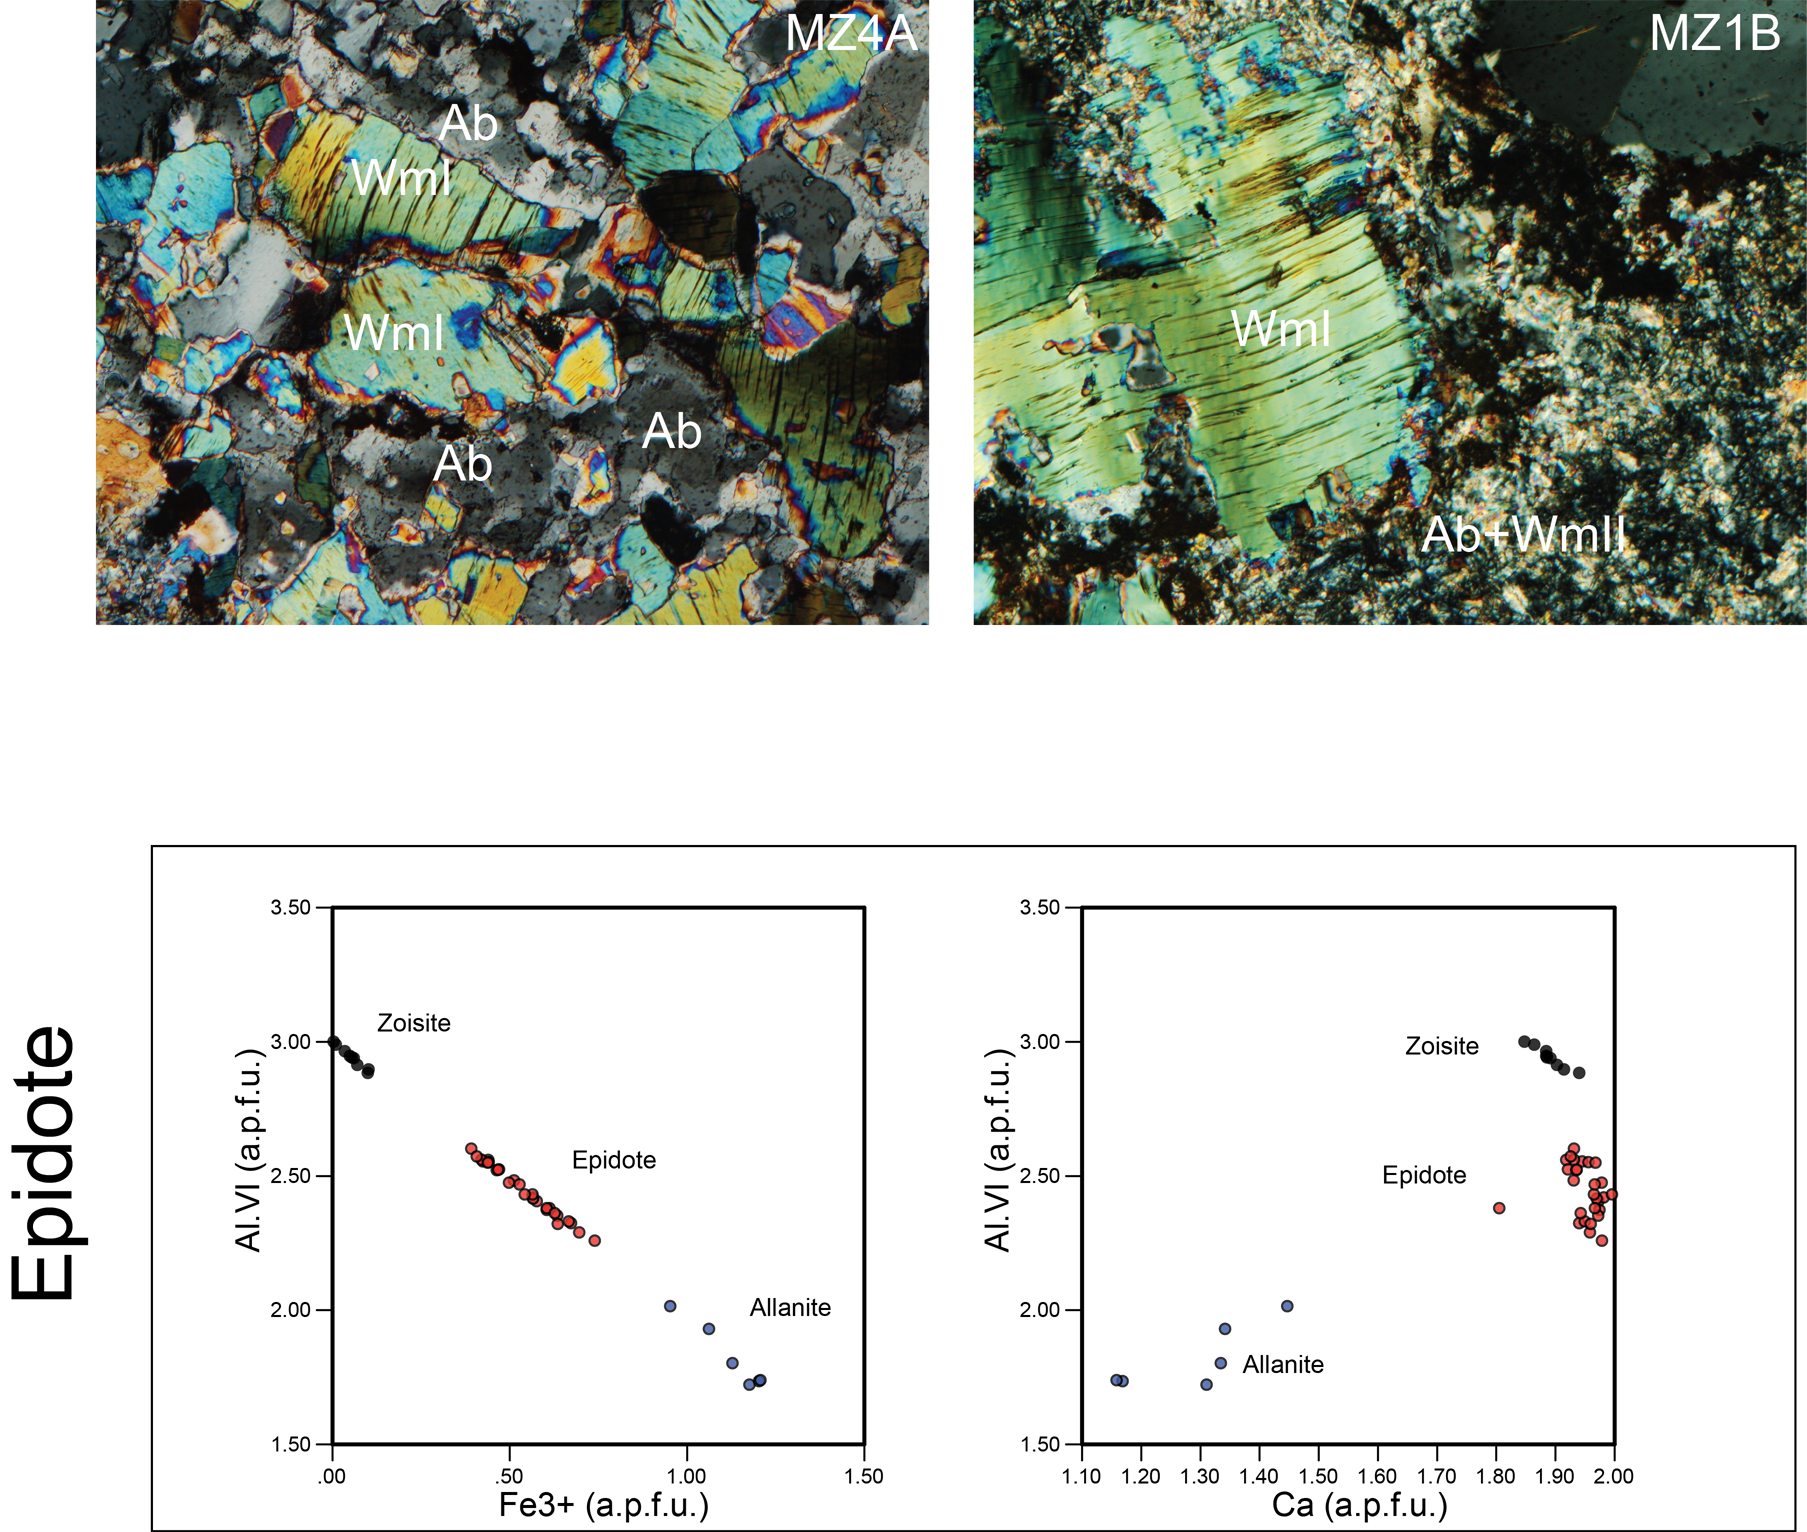
Figure 8. Compositional diagrams of white mica and epidote. A) Compositional diagrams of white mica and epidote showing the compositional variations of the mineral phases with respect to the occupied positions as displayed in
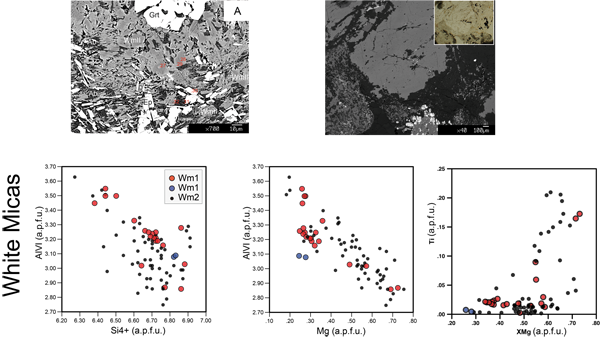
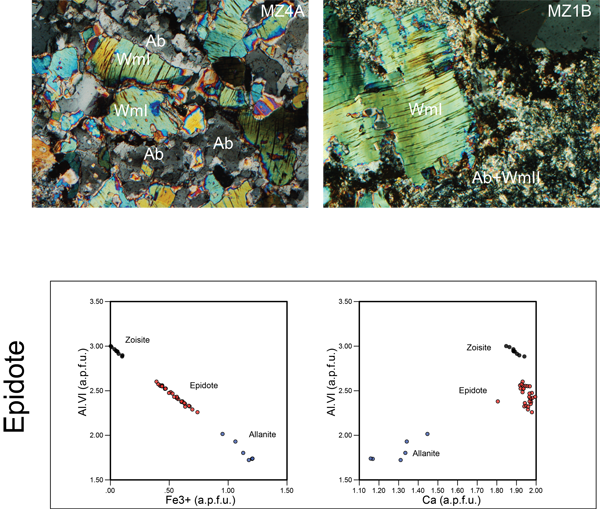
White Mica (Wm)
WmI is phengitic mica and displays a wide range in composition: Si content varies from 6.38 to 6.88 a.p.f.u., AlVI from 2.86 to 3.55 a.p.f.u., Fetot from 0.18 to 0.70 a.p.f.u. and Mg from 0.25 to 0.72 a.p.f.u. These chemical variations do not correspond to a regular zoning within WmI grains.
WmII is phengitic mica and is characterized by continuous compositional ranges for Si content, from 6.30 to 6.95 a.p.f.u., AlVI content, from 2.75 to 3.65 a.p.f.u., Fetot content, from 0.2 to 0.78 a.p.f.u. and Mg content from 0.18 to 0.75 a.p.f.u. WmII grown within PlI pseudomorphic microdomains shows two stages of growth (Fig. 8), characterized by an increase in Mg and Fetot contents from core to rim, respectively > 0.45 a.p.f.u. and > 0.40 a.p.f.u. (Tab. 1).
Ti content varies from 0.0 to 0.20 a.p.f.u. and highest values are found in WmII within PlI microdomains as cores of lower Ti content WmII (Fig. 8).
Garnet (Grt)
The GrtI composition is controlled by the growing microdomain and by the adjacent mineral phases.
GrtI is Grs-rich (45-55 %) where it is in association with WmII, Ab and Ep within PlI microdomains (Fig. 4); in these GrtI, Alm ranges from 40 to 50% and Pyp < 15% (Fig. 7). More complex is the compositional pattern of GrtI defining corona between WmI or BtI and PlI micrdomains; X-ray maps (Fig. 7) show the sharp chemical variation of these corona: BtI-facing GrtI is Ca-poor and Fe-rich while, oppositely, PlI-facing GrtI is enriched in Ca and depleted in Fe. The composition of GrtI grown towards BtI shows a Ca content that ranges from 0.30 to 1.00 a.p.f.u. Fetot varies from 1.80 and 2.34 a.p.f.u. (Fig. 7). Corresponding GrtI growing towards PlI are characterized by Ca content from 1.20 to 1.70 a.p.f.u., Fetot from 1.25 and 1.80 a.p.f.u. Mg content in corona-Grt ranges from < 0.1 to 0.37 a.p.f.u. where highest contents are generally in BtI-facing GrtI. GrtI grown at the boundaries of WmI shows an intermediate composition: Ca ranges from 1.00 to 1.40 a.p.f.u., Fetot from 1.48 to 1.93 a.p.f.u. and Mg from 0.07 to 0.16 a.p.f.u. (Tab. 1). Fe3+ content for all GrtI is commonly low, having maximum content of 0.07 a.p.f.u.
Feldspar (K-feldspar and plagioclase)
K content in K-feldspar is always > 0.8 a.p.f.u. while in PlII Na content is always > 0.90 a.p.f.u. Both Kfs and PlII have Ca content < 0.07 a.p.f.u.
Epidote (Ep)
EpI are Fe-rich epidote and zoisite (Fig. 8). Fe3+ content in epidote ranges from 0 to 1.47 a.p.f.u. that corresponds respectively to AlVI content 0 to 1.6 a.p.f.u. In zoisite Fe3+ is < 0.2 a.p.f.u. and AlVI content ranges from 2.8 to 3.0 a.p.f.u. (Tab. 1). Epidote corresponds to higher Fe3+ contents (0.3 – 0.75) and lower AlVI (2.2 – 2.6).
Chlorite (Chl)
Fetot content in Chl varies from 5.00 to 5.94 a.p.f.u., Mg content from 3.20 to 4.01 and AlVI from 2.37 to 2.67 a.p.f.u. (Tab. 1).
Titanite (Ttn)
Ti content in titanite varies from 1.78 in igneous titanite (Tab. 1) to 1.18 a.p.f.u. in metamorphic titanite. Al content varies from 0.13 to 0.89 a.p.f.u.
Chemical profiles
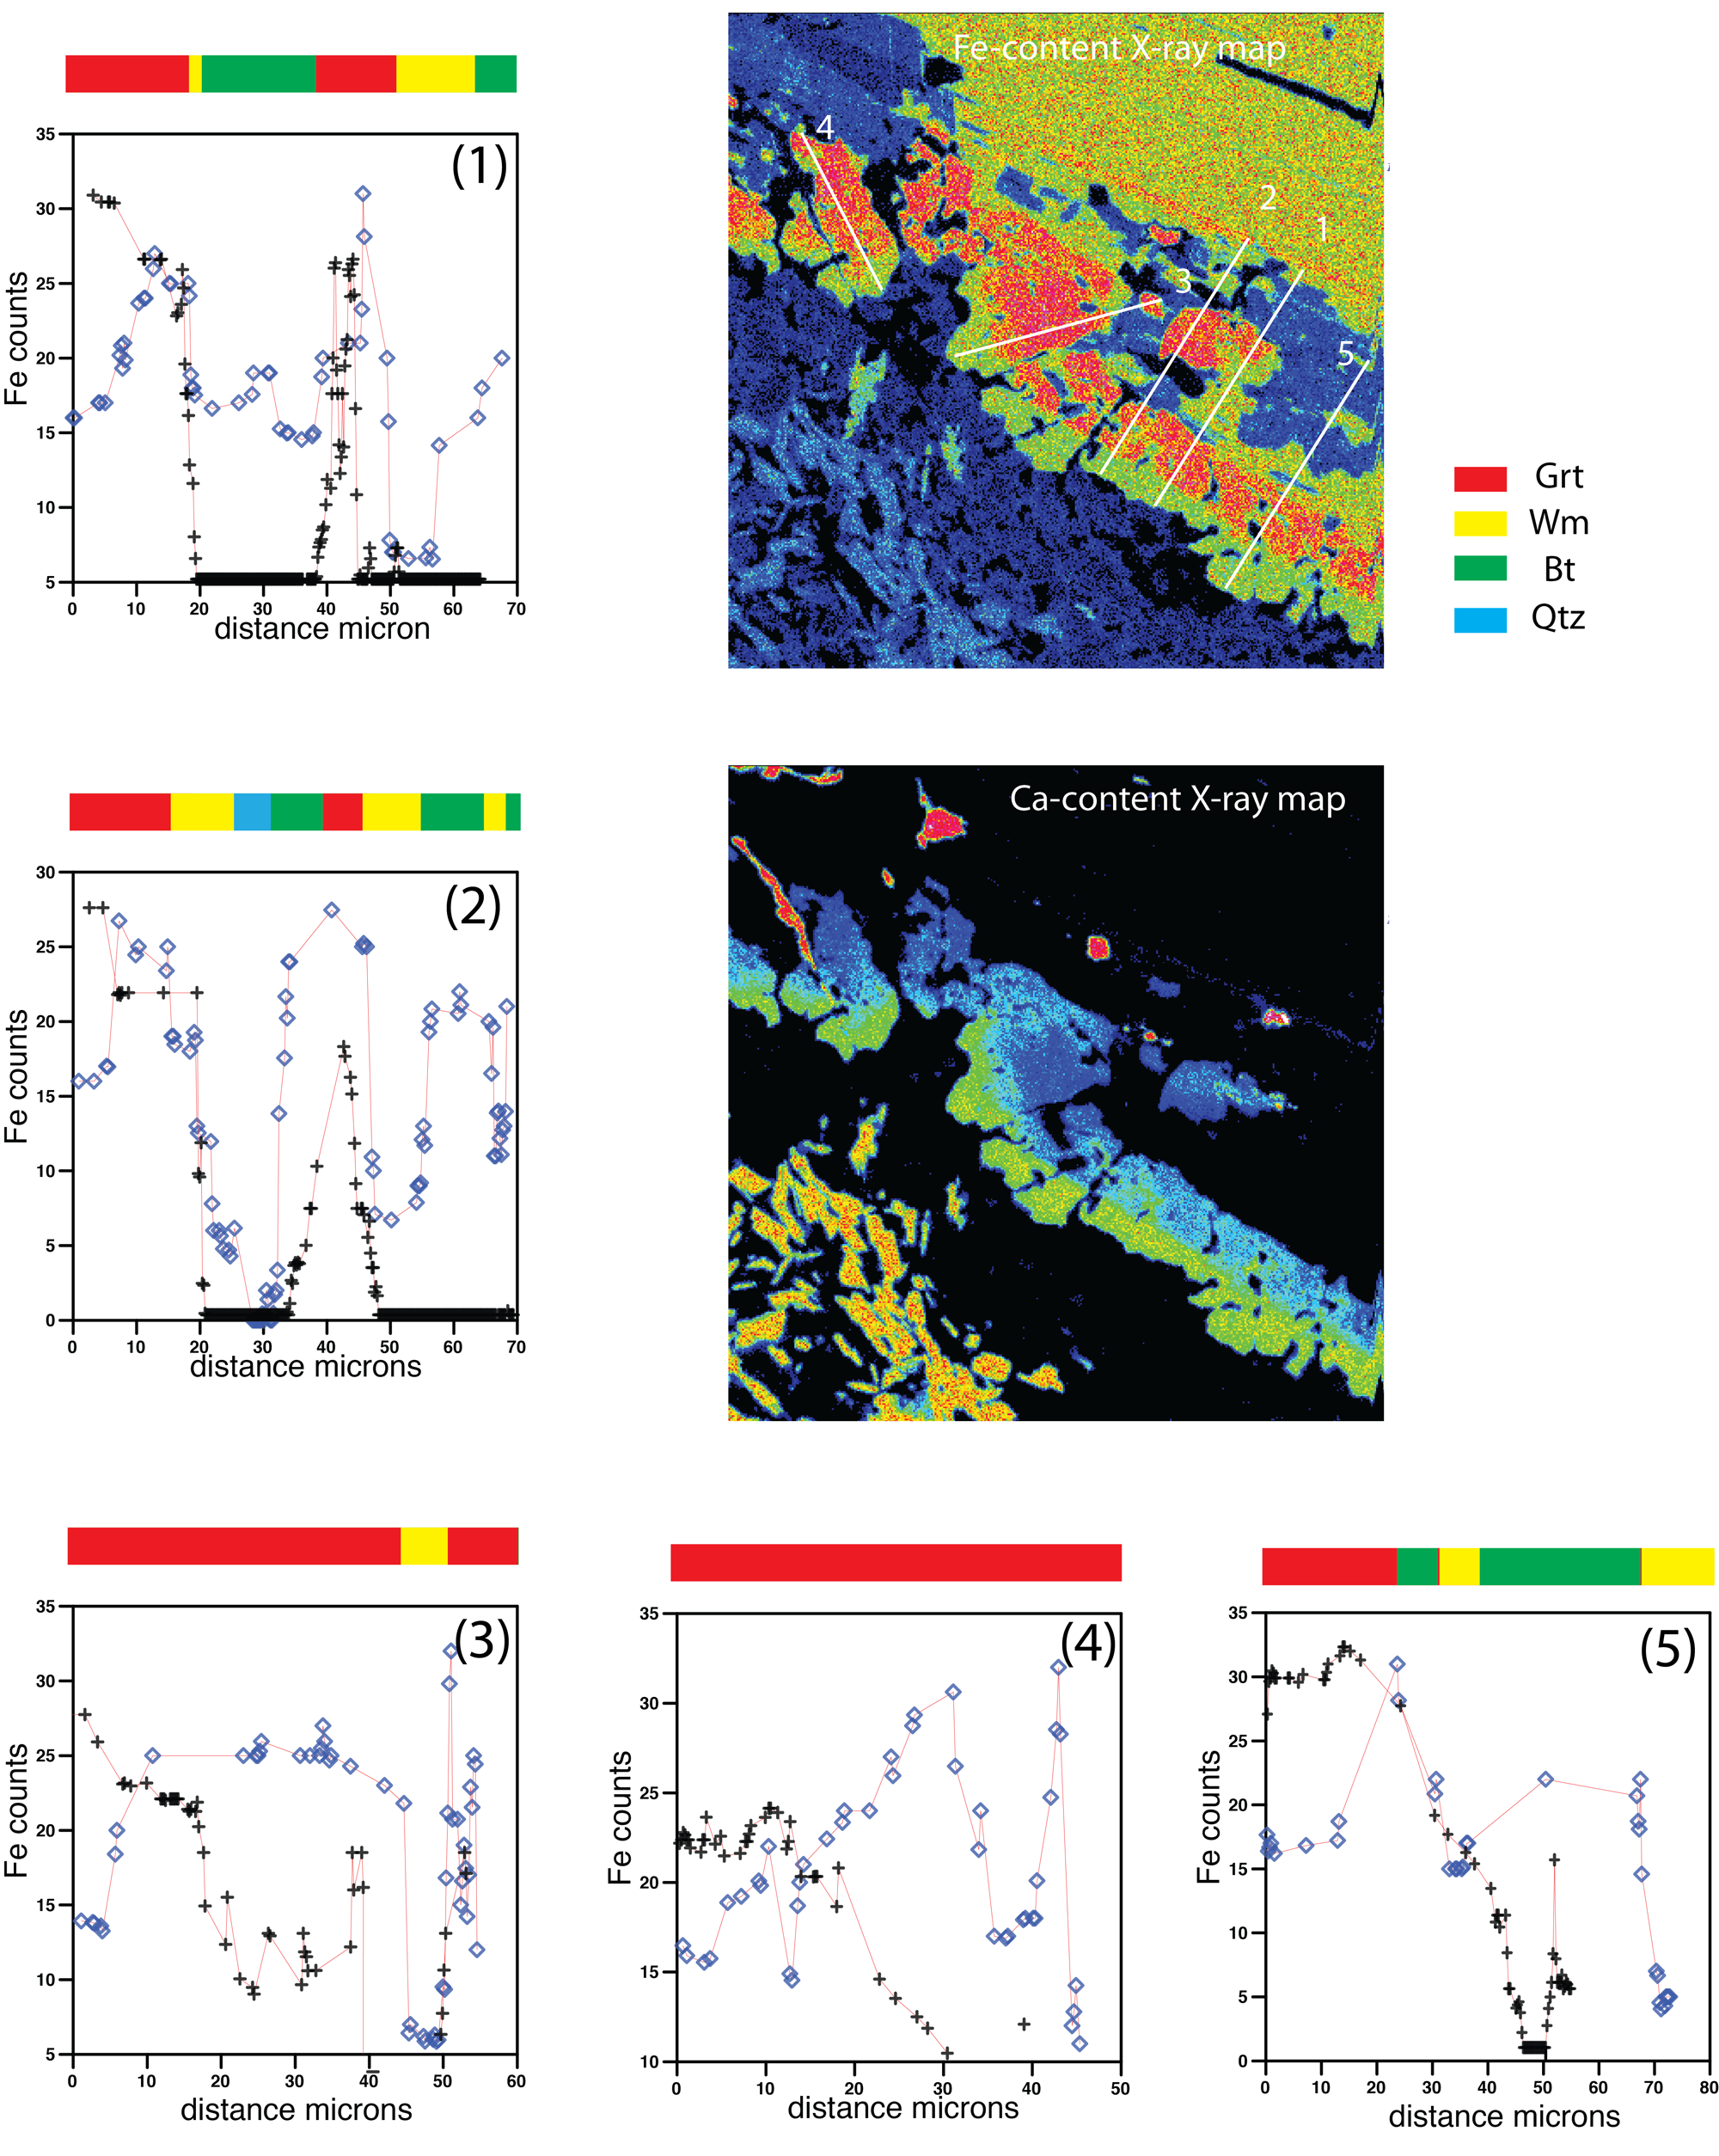
Figure 10 shows qualitative chemical profiles obtained from X-rays maps, using ImageJ (Rasband, 1997; Prenzel et al. 2009). Distances (i.e. abscissae) are in µm, while intensities are in count per seconds.
Fe and Ca contents profiles (Fig. 10) are characterized by a typical pattern that reflect to the microdomain geometry and the chemical partitioning due to the microstructural positions (Kohn, 2003). In particular the GrtI profile at the boundary between PlI and BtI microdomains is commonly described by a low Fe content toward the PlI domain; the Fe content sudden increases and then decreases toward BtI. Ca content shows highest values at the boundaries with PlI, higher than Fe contents, quickly decreasing toward the middle of the grain and toward BtI. Ca and Fe profiles intersect at intermediate values and highest Fe and Ca contents are generally comparable (see mineral analyses).
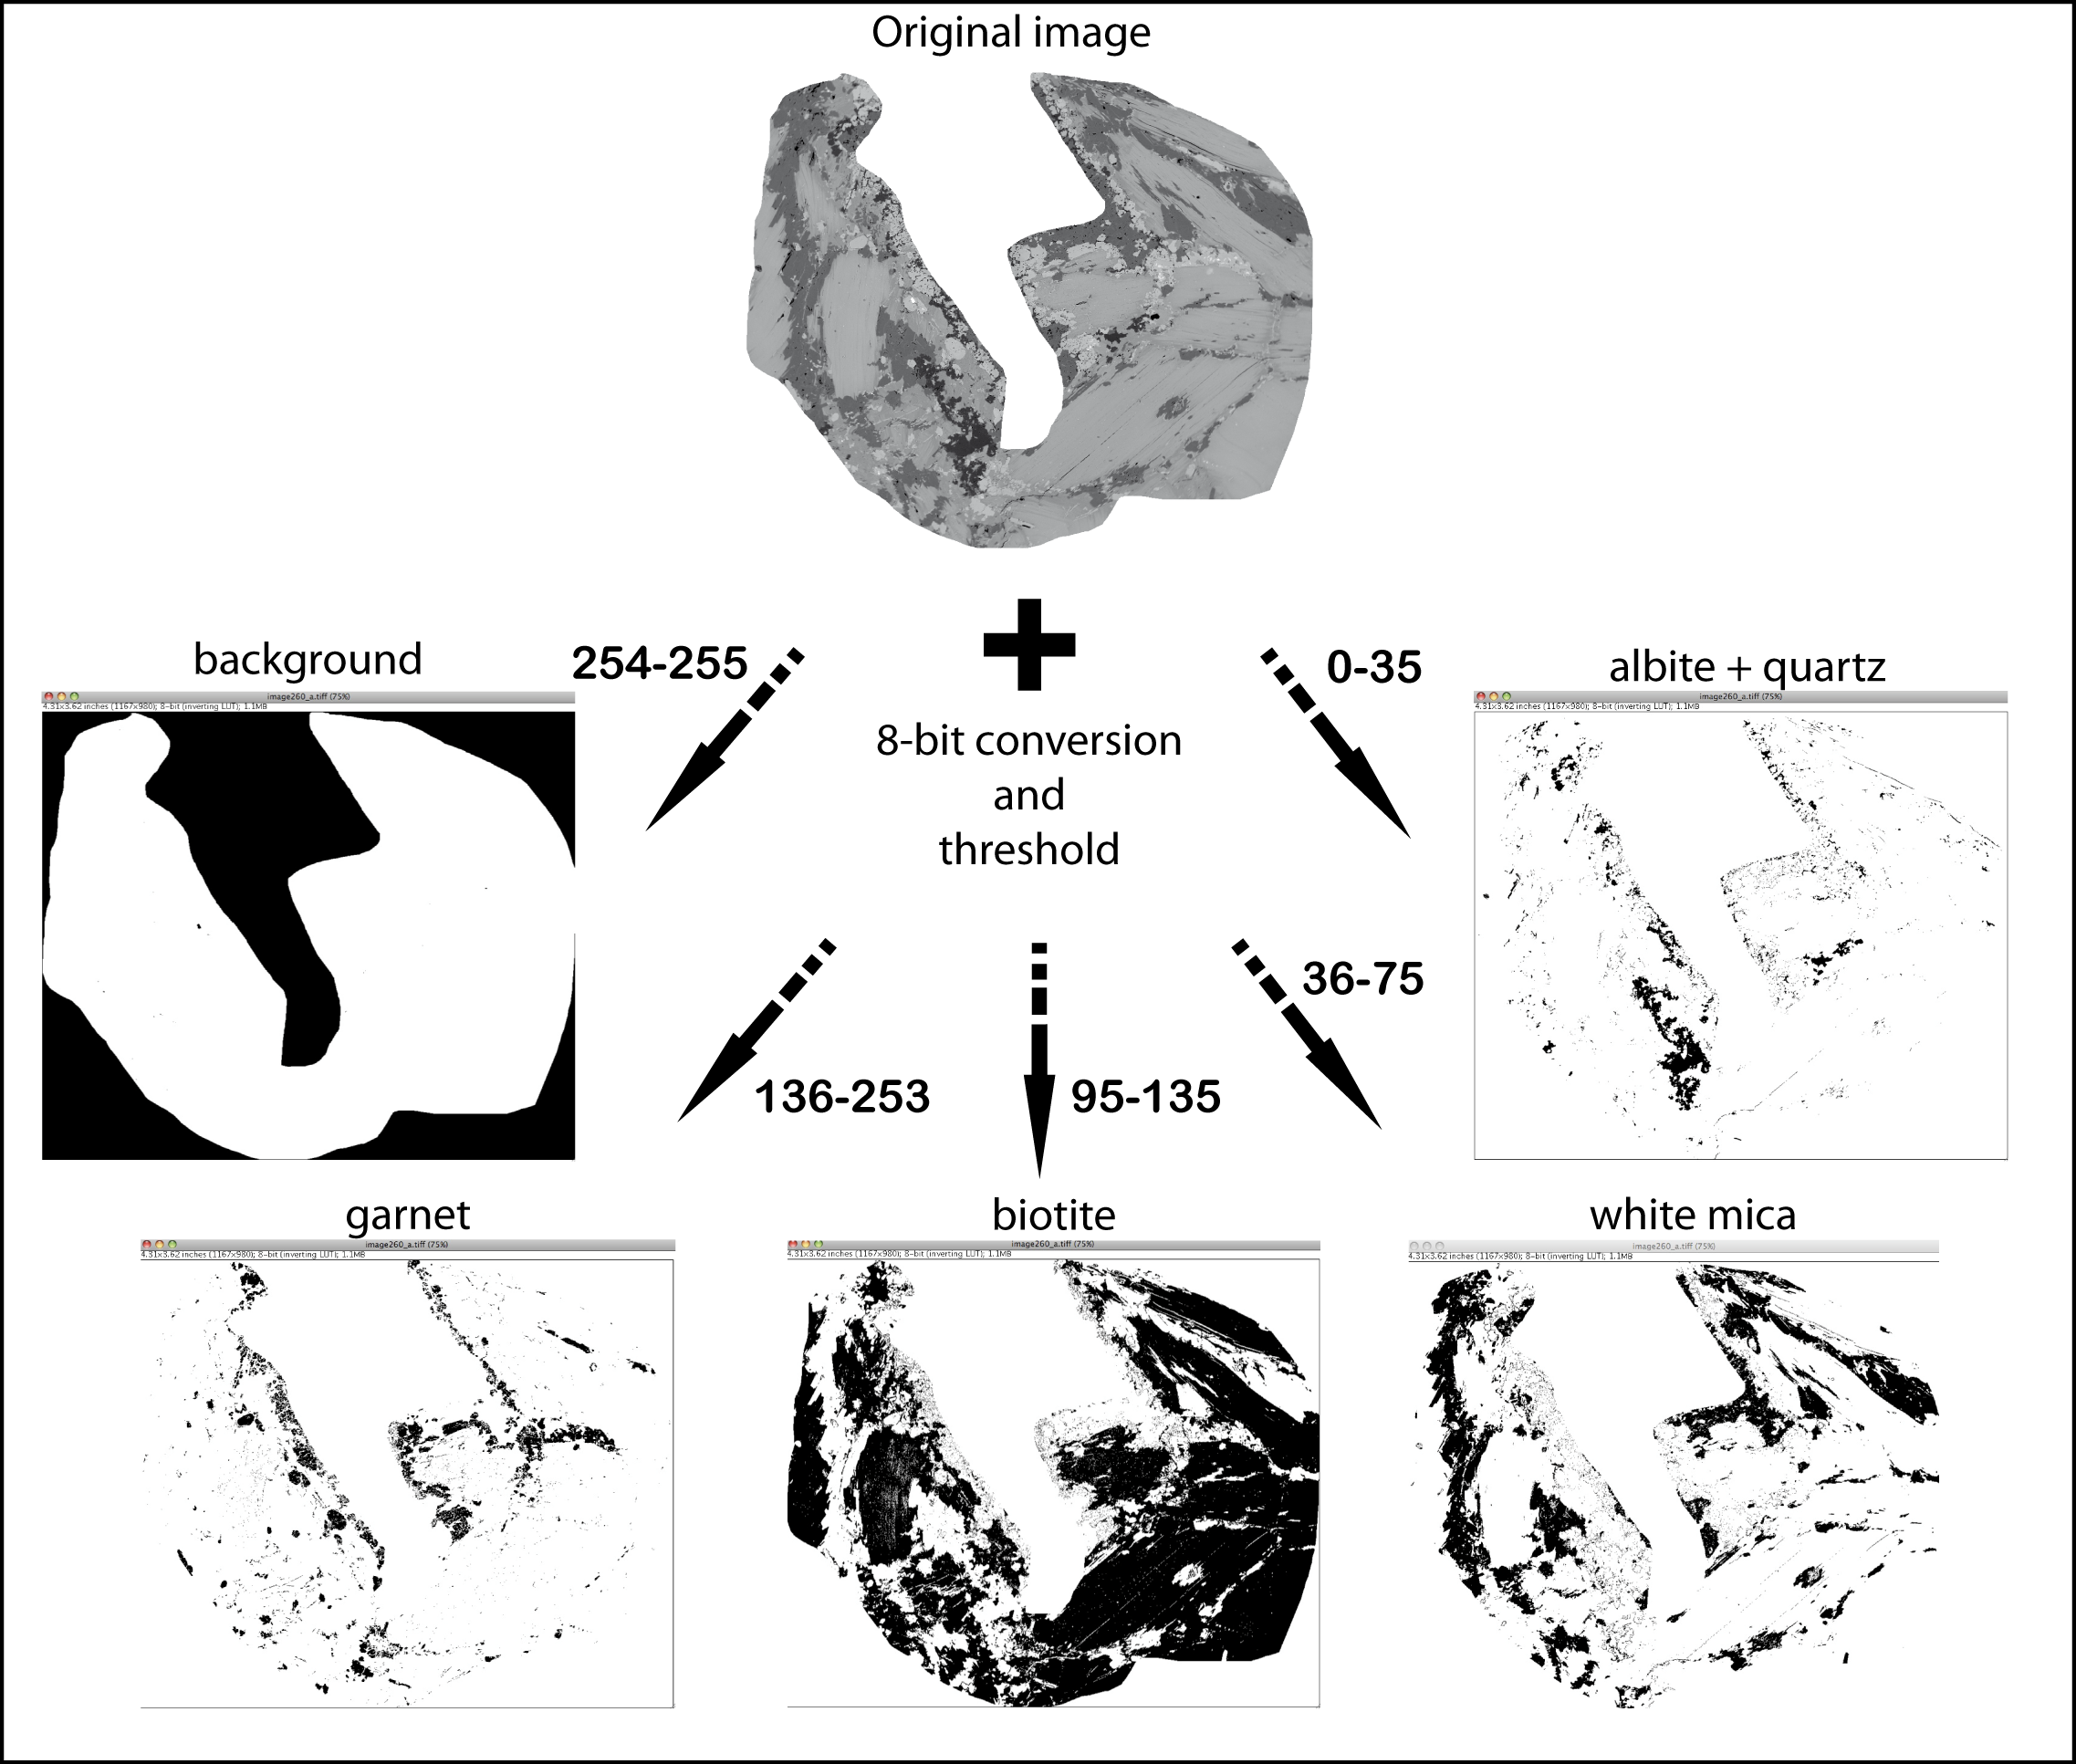
Figure 9. Image analysis procedure
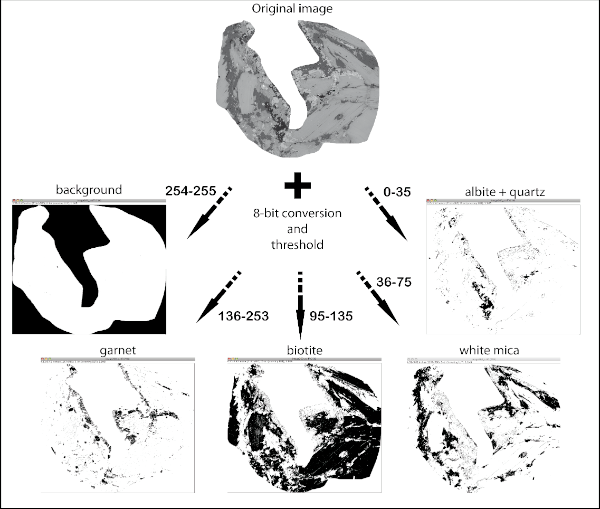
A) Image analysis procedure: from the original image, successive grey-scale thresholds intervals allow to define black-white images separating background (white), garnet, biotite, white mica and albite+quartz.
Such chemical relations allow to infer the most likely position of the former grain boundary between biotite and plagioclase, which may be located in correspondence of the fast decrease Fe and corresponding Ca content increase.
Step 1)
BtI → BtII + WmII + Alm-rich GrtI
PlI stable
Step 2)
BtI + Ca2+ (PlI) → BtII + WmII + Grs-rich GrtI
WmI + Ca2+ (PlI) → WmII + Grt
PlI + H2O + K+ + Ti4+ + Mg2+ +Fe2+ → Ab + WmII + Ep ± Grt
PlI rim + H2O + K+ + Ti4+ + Mg2+ +Fe2+ → WmII + Ab ± Ep ± GrtI
PlI core + H2O + K+ → WmII + Ep + Ab + GrtI
Step 3)
K-feldspar + Na+ → Ab + K+
Image Analysis (Modal proportion analysis)
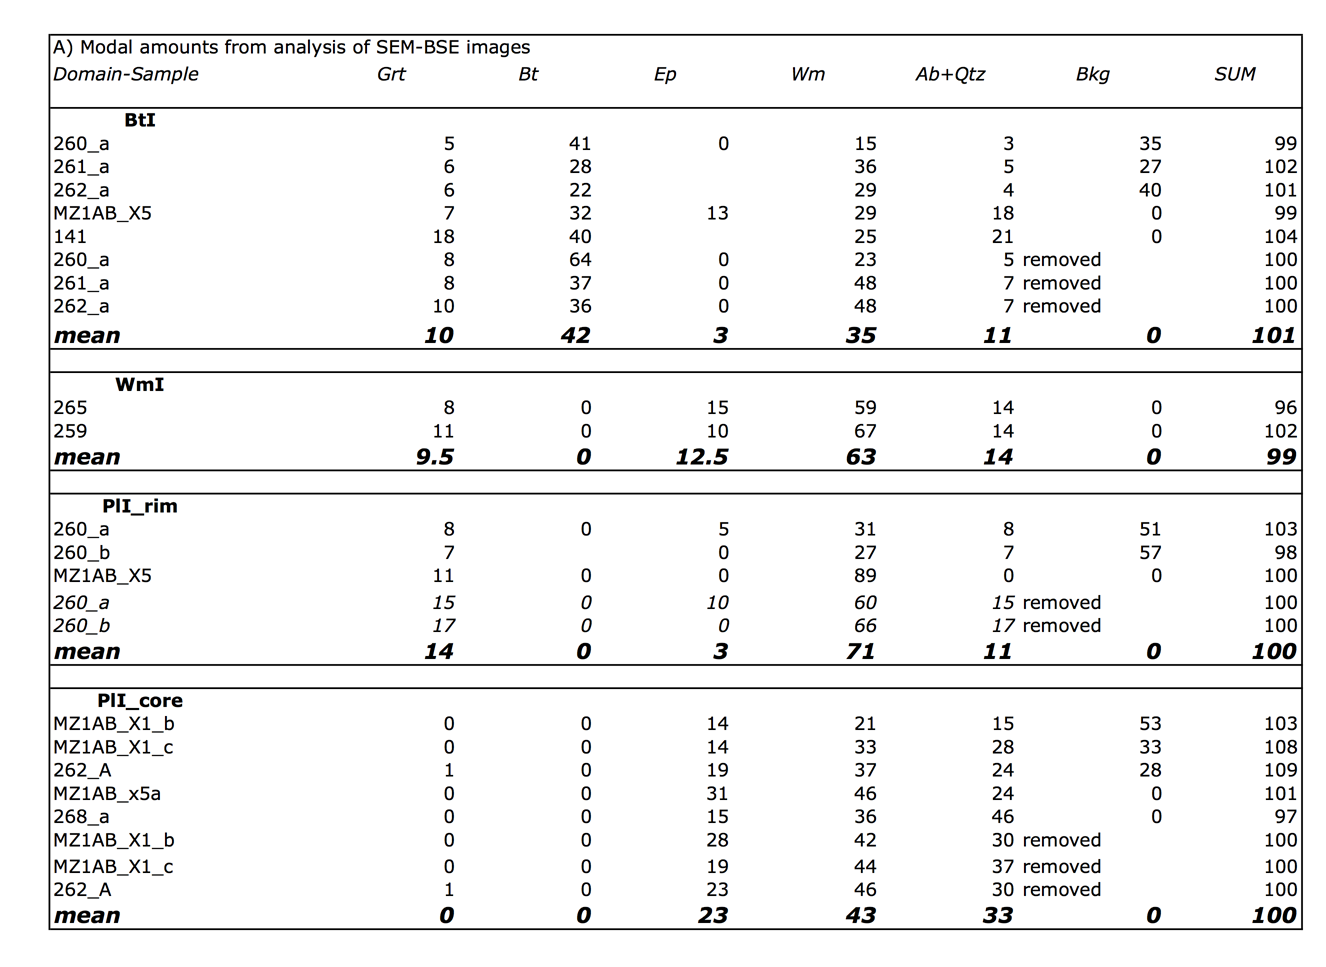
From BSE images composite scripts with open source ImageJ software (Rasband, 1997; Abramoff 2004) have been used to separate individual mineral phases and then obtain their amount. The automated scripts allow to separate object using their colours in the grey scale. BSE images are well suited for this purpose. This analysis has been performed on 4 main microdomain: PlI cores, allowing to quantify the amount of Ep, WmII and Ab constituting the fine-grained aggregates that substitute PlI; PlI rims, constituted by coarse grained WmII + PlI-facing Grt; WmI, constituted by WmII + Ep + Ab + GrtI + Qtz; BtI, constituted by BtI + WmII + BtI-facing Grt. The automated scripts run 8-bit conversion, set thresholds to specific interval from 0 (black) to 255 (white), previously set on the basis of the grey intervals at BSE images for each phase (0-35 Ab and Qtz; 35-75 Wm; 76-125 Ep; 95-135 Bt; 145-255 Grt). The obtained images are now binary (black and white) where black corresponds to the investigated phase; the last step is the measurement of the black pixels with respect to the total (Fig. 9, Tab. 2). The latter quantity corresponds to the amount of the investigated phase. The same procedure is repeated for each mineral phase (i.e. Ep, Ab, Wm, Grt). Table 2 reports the mean results of these calculations performed on PlI (cores and rims), BtI, WmI microdomains. The obtained values are combined with modal amounts of each phase to calculate the bulk compositions for each microdomain.
Figure 10. Qualitative chemical profiles along the GrtI coronas at BtI – PlI boundaries.

Fe-content X-ray map shows the location of the profile lines. On top of the chemical profiles different colors correspond to the crossed mineral phases.
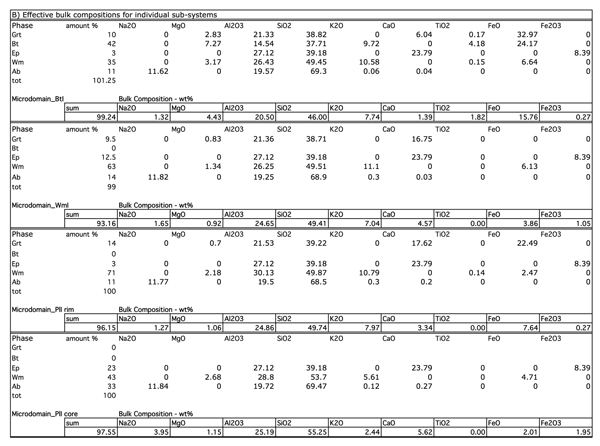
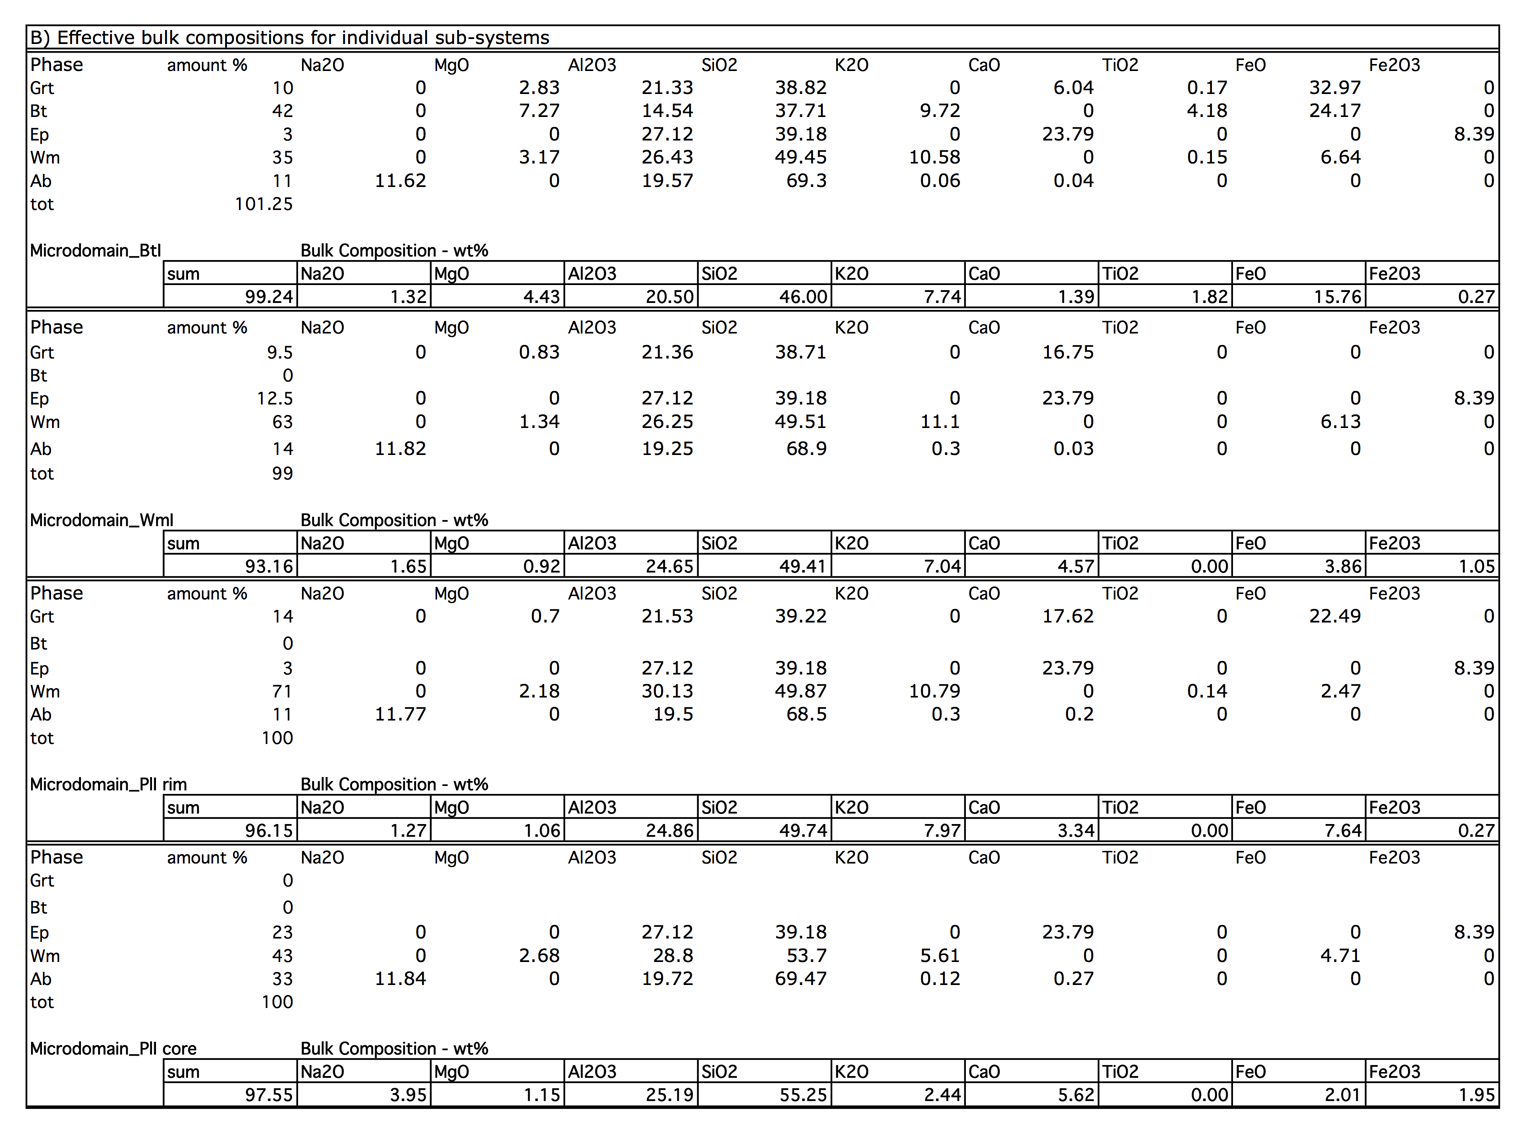
Figure Table 2. A) Modal amounts obtained from the image analysis on BtI, WmI, WmII+Grt, PlI microdomains; B) Effective bulk compositions obtained by combining modal amounts from image analysis and mineral phases compositions of Table 1.
