Methods
Samples were collected from PQU rocks from the Hellenic forearc ridge in South Aegean and from within the present volcanic arc (Fig. 2). The samples were crushed with a hydraulic press and a rotary mill. Zircon separation was carried out using hydro-gravimetric (Wilfley table), magnetic (Frantz isodynamic separator) and density (tetra-bromo-ethylene and methylene iodide) separation techniques followed by handpicking under a binocular microscope. Zircon grains were mounted in Teflon, sectioned and polished. Zircon grains were imaged on a SEM fitted with cathodoluminescence (CL) detector to characterize chemical zoning, and to identify core-rims relationships (Hunchar and Miller, 1993; Nasdala et al., 2003). SEM imaging was performed using Variable Pressure (VPS) or Secondary Electrons (SE) with no coating on the samples (Fig. 3). Zircons vary from ca. 80 to 280 μm length, and their morphology ranges from long prismatic to isometric. Most of the detrital zircons show some rounding.
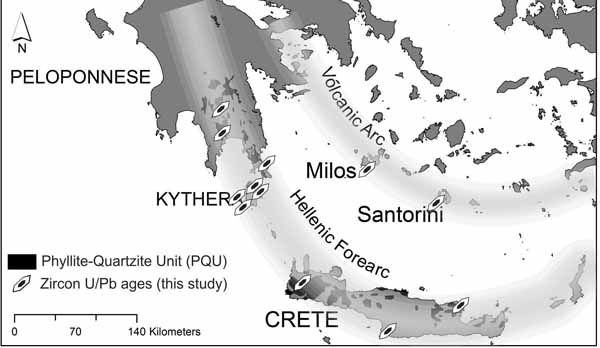
Figure 2. Distribution of zircon U/Pb samples in the Phyllite-Quartzite Unit of Peloponnese, Kythera, Crete, Santorini, and in the Cyclades blueschist of Milos.
Sample localities are shown in the index map. The black areas in the index map indicate the exposures of the PQU.
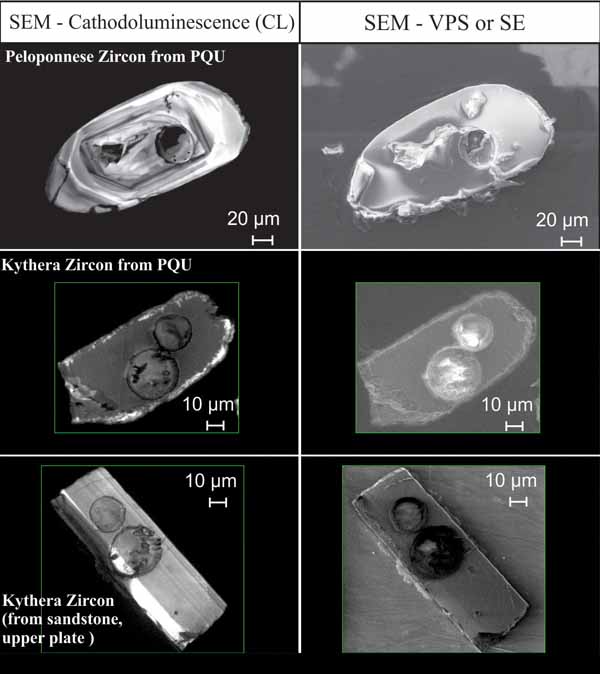
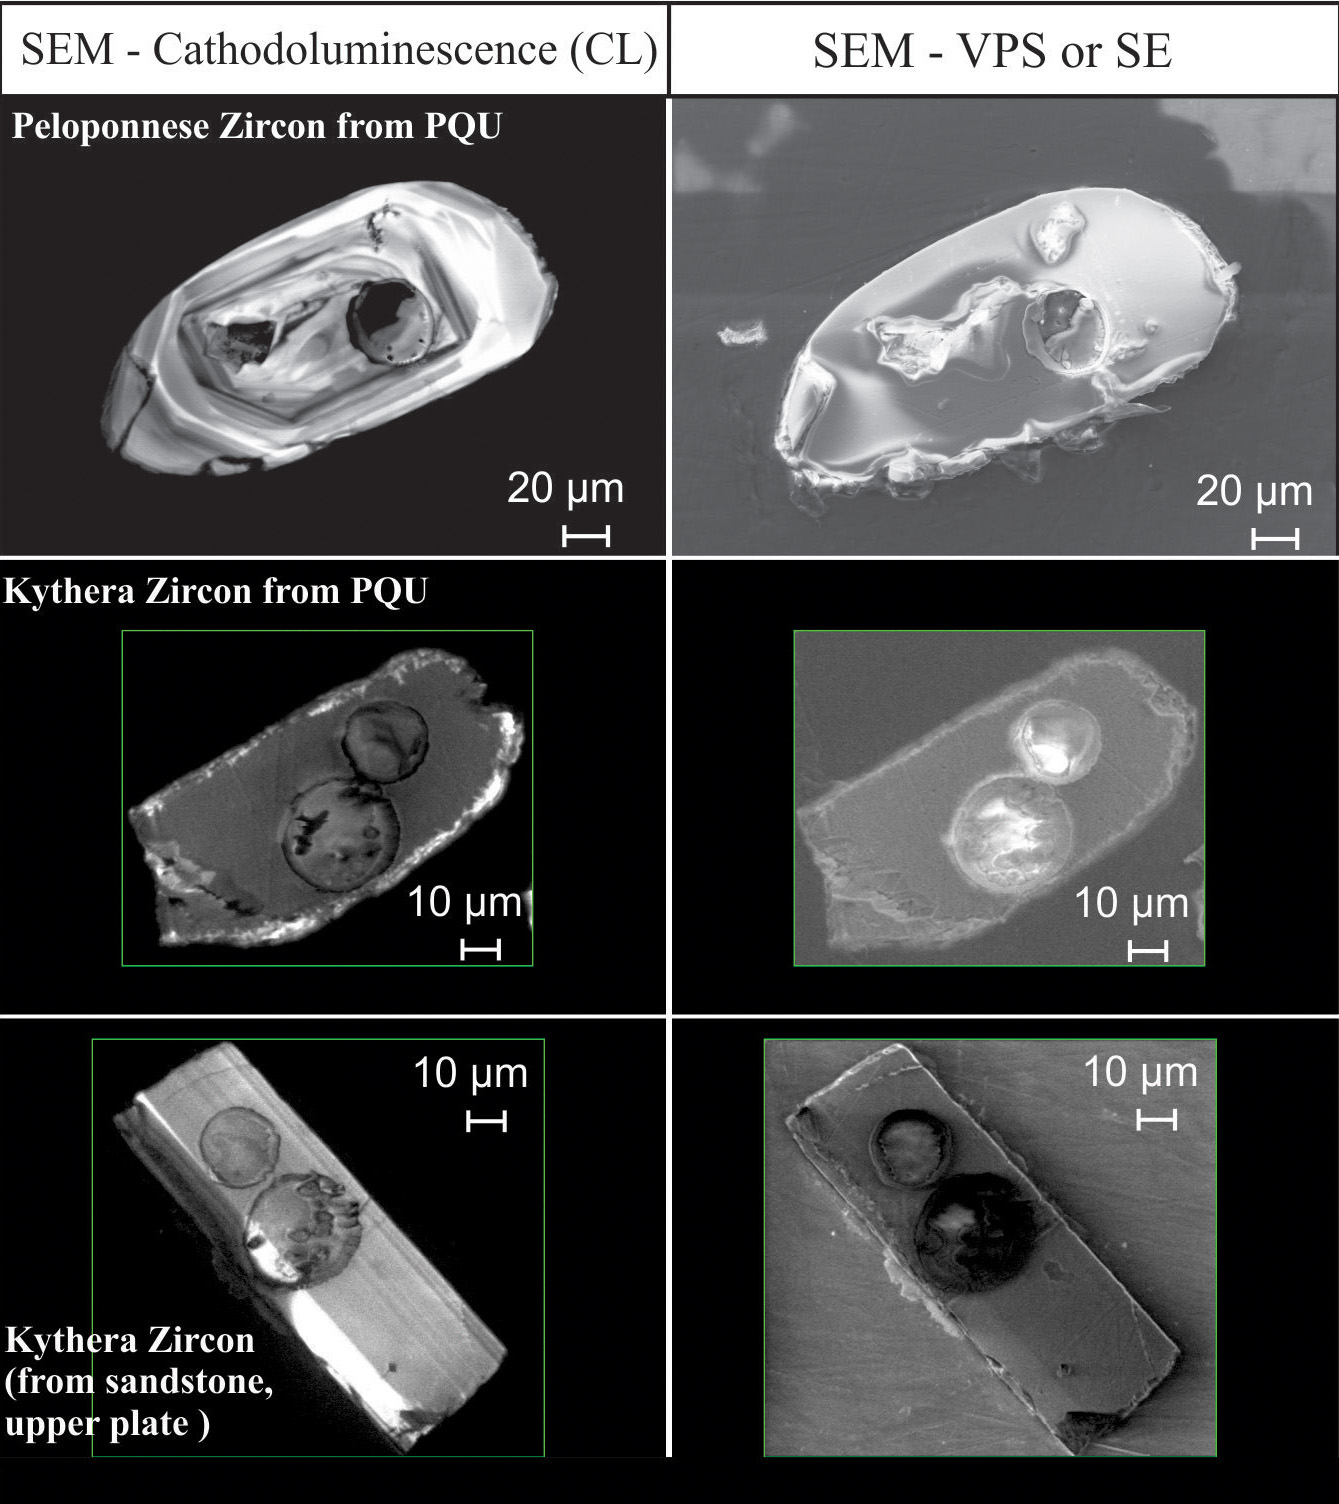
Figure 3. Cathodoluminesence (CL), variable pressure (VPS) images of zircon from selected Aegean samples.
Zircons were mounted in teflon and polished to expose approximate midsections. White circles identify position and true size of MC-LA-ICPMS analytical spots. The smaller spot is from the U-Pb analyses. Scale is indicated by white bar.
Laser ablation U-Pb analyses were performed at the University of Florida and at the Arizona LaserChron Center. Analyses at the University of Florida were performed using a Nu-Plasma multi-collector inductively-coupled plasma mass spectrometer (MC-ICP-MS) following methods described by Mueller et al. (2008). A New Wave 213 nm laser was used for the laser ablation experiments. The U-Pb isotope analyses were performed on spots with 30 microns beam size, 6Hz, and 60% power. Isotopic data were acquired during the analyses using Time Resolved Analysis (TRA) software provided by Nu-Instruments. Before the ablation of each zircon a 20s on-peak zero was determined on the blank He and Ar gases with closed laser shutter. Following blank acquisitions individual zircons underwent spot analyses for 30s. Every 10 analyses of unknown zircons were “bracketed” by 2 analyses of FC-1 (Forest Center, Minnesota) zircon standard. Raw isotopic data obtained from the LA-MC-ICP-MS analyses were reduced with in-house Microsoft Excel© spreadsheet. Representative age errors based on the long-term reproducibility of FC-1 standard were 2% for 206Pb=238U (2σ) and 1% for 207Pb=206Pb (2σ) for more details see Mueller et al. (2008). A small subset of the U-Pb analyses were performed at the Arizona LaserChron Center using a New Wave/Lambda Physik DUV193 Excimer laser (operating at a wavelength of 193 nm) using a spot diameter of 30 mm. The ablated material was carried in helium into the plasma source of a GVI Isoprobe equipped with a flight tube of sufficient width that U, Th, and Pb isotopes were measured simultaneously. Each analysis consisted of one 20-s integration on peaks with the laser off (for backgrounds), 20 1-s integrations with the laser firing, and a 30-s delay to purge the previous sample and prepare for the next analysis. 206Pb/238U ages are quoted for analyses younger than 1.0 Ga, whereas 207Pb/206Pb ages are quoted for analyses older than 1.0 Ga. Only zircon U-Pb analyses for grains less than 10% discordant were plotted in a histogram (Fig. 4) and they were classified into groups (Fig. 5) and decomposed for the peak age analysis (Fig. 6) after using Isoplot (Ludwig, 2003) and SPSS, 2Step-cluster analysis.
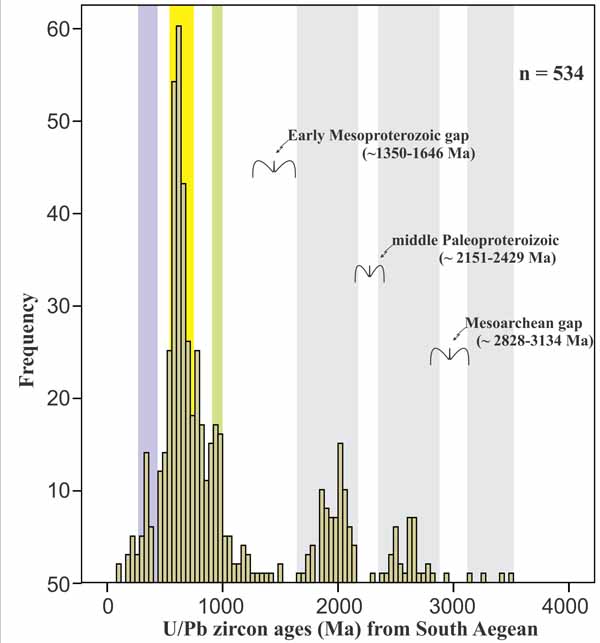
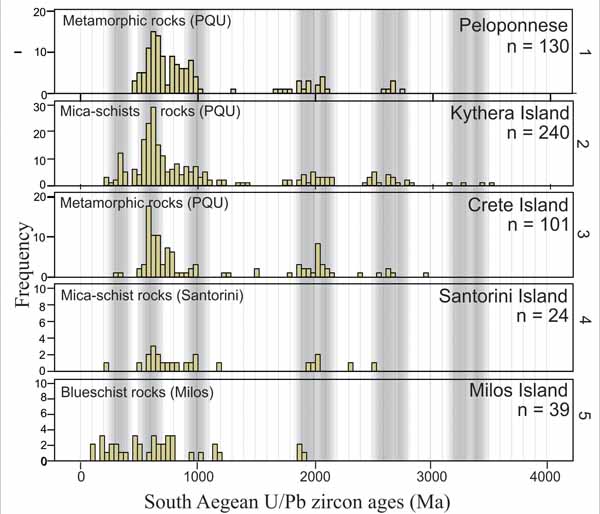
Figure 4. U/Pb zircons ages from South Aegean.
206Pb/238U ages are quoted for analyses younger than 1.0 Ga, whereas 207Pb/206Pb ages are quoted for analyses older than 1.0 Ga. Grey shaded bars are important thermal events (discussion in the text).
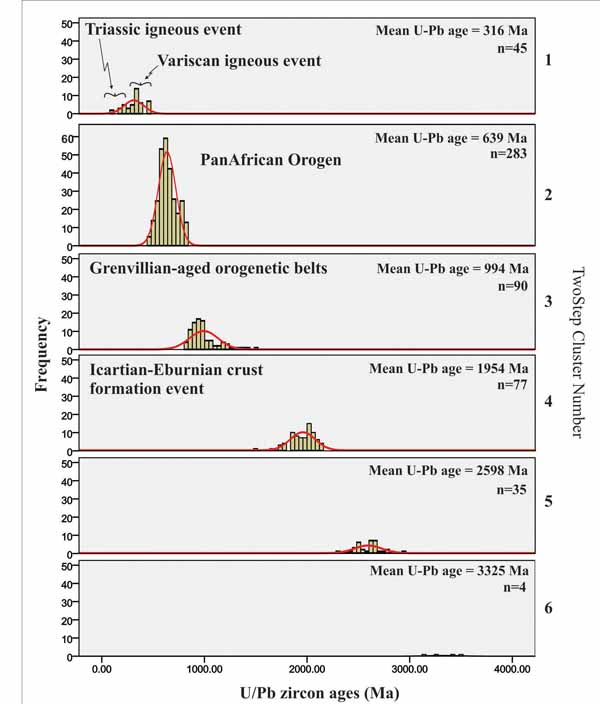
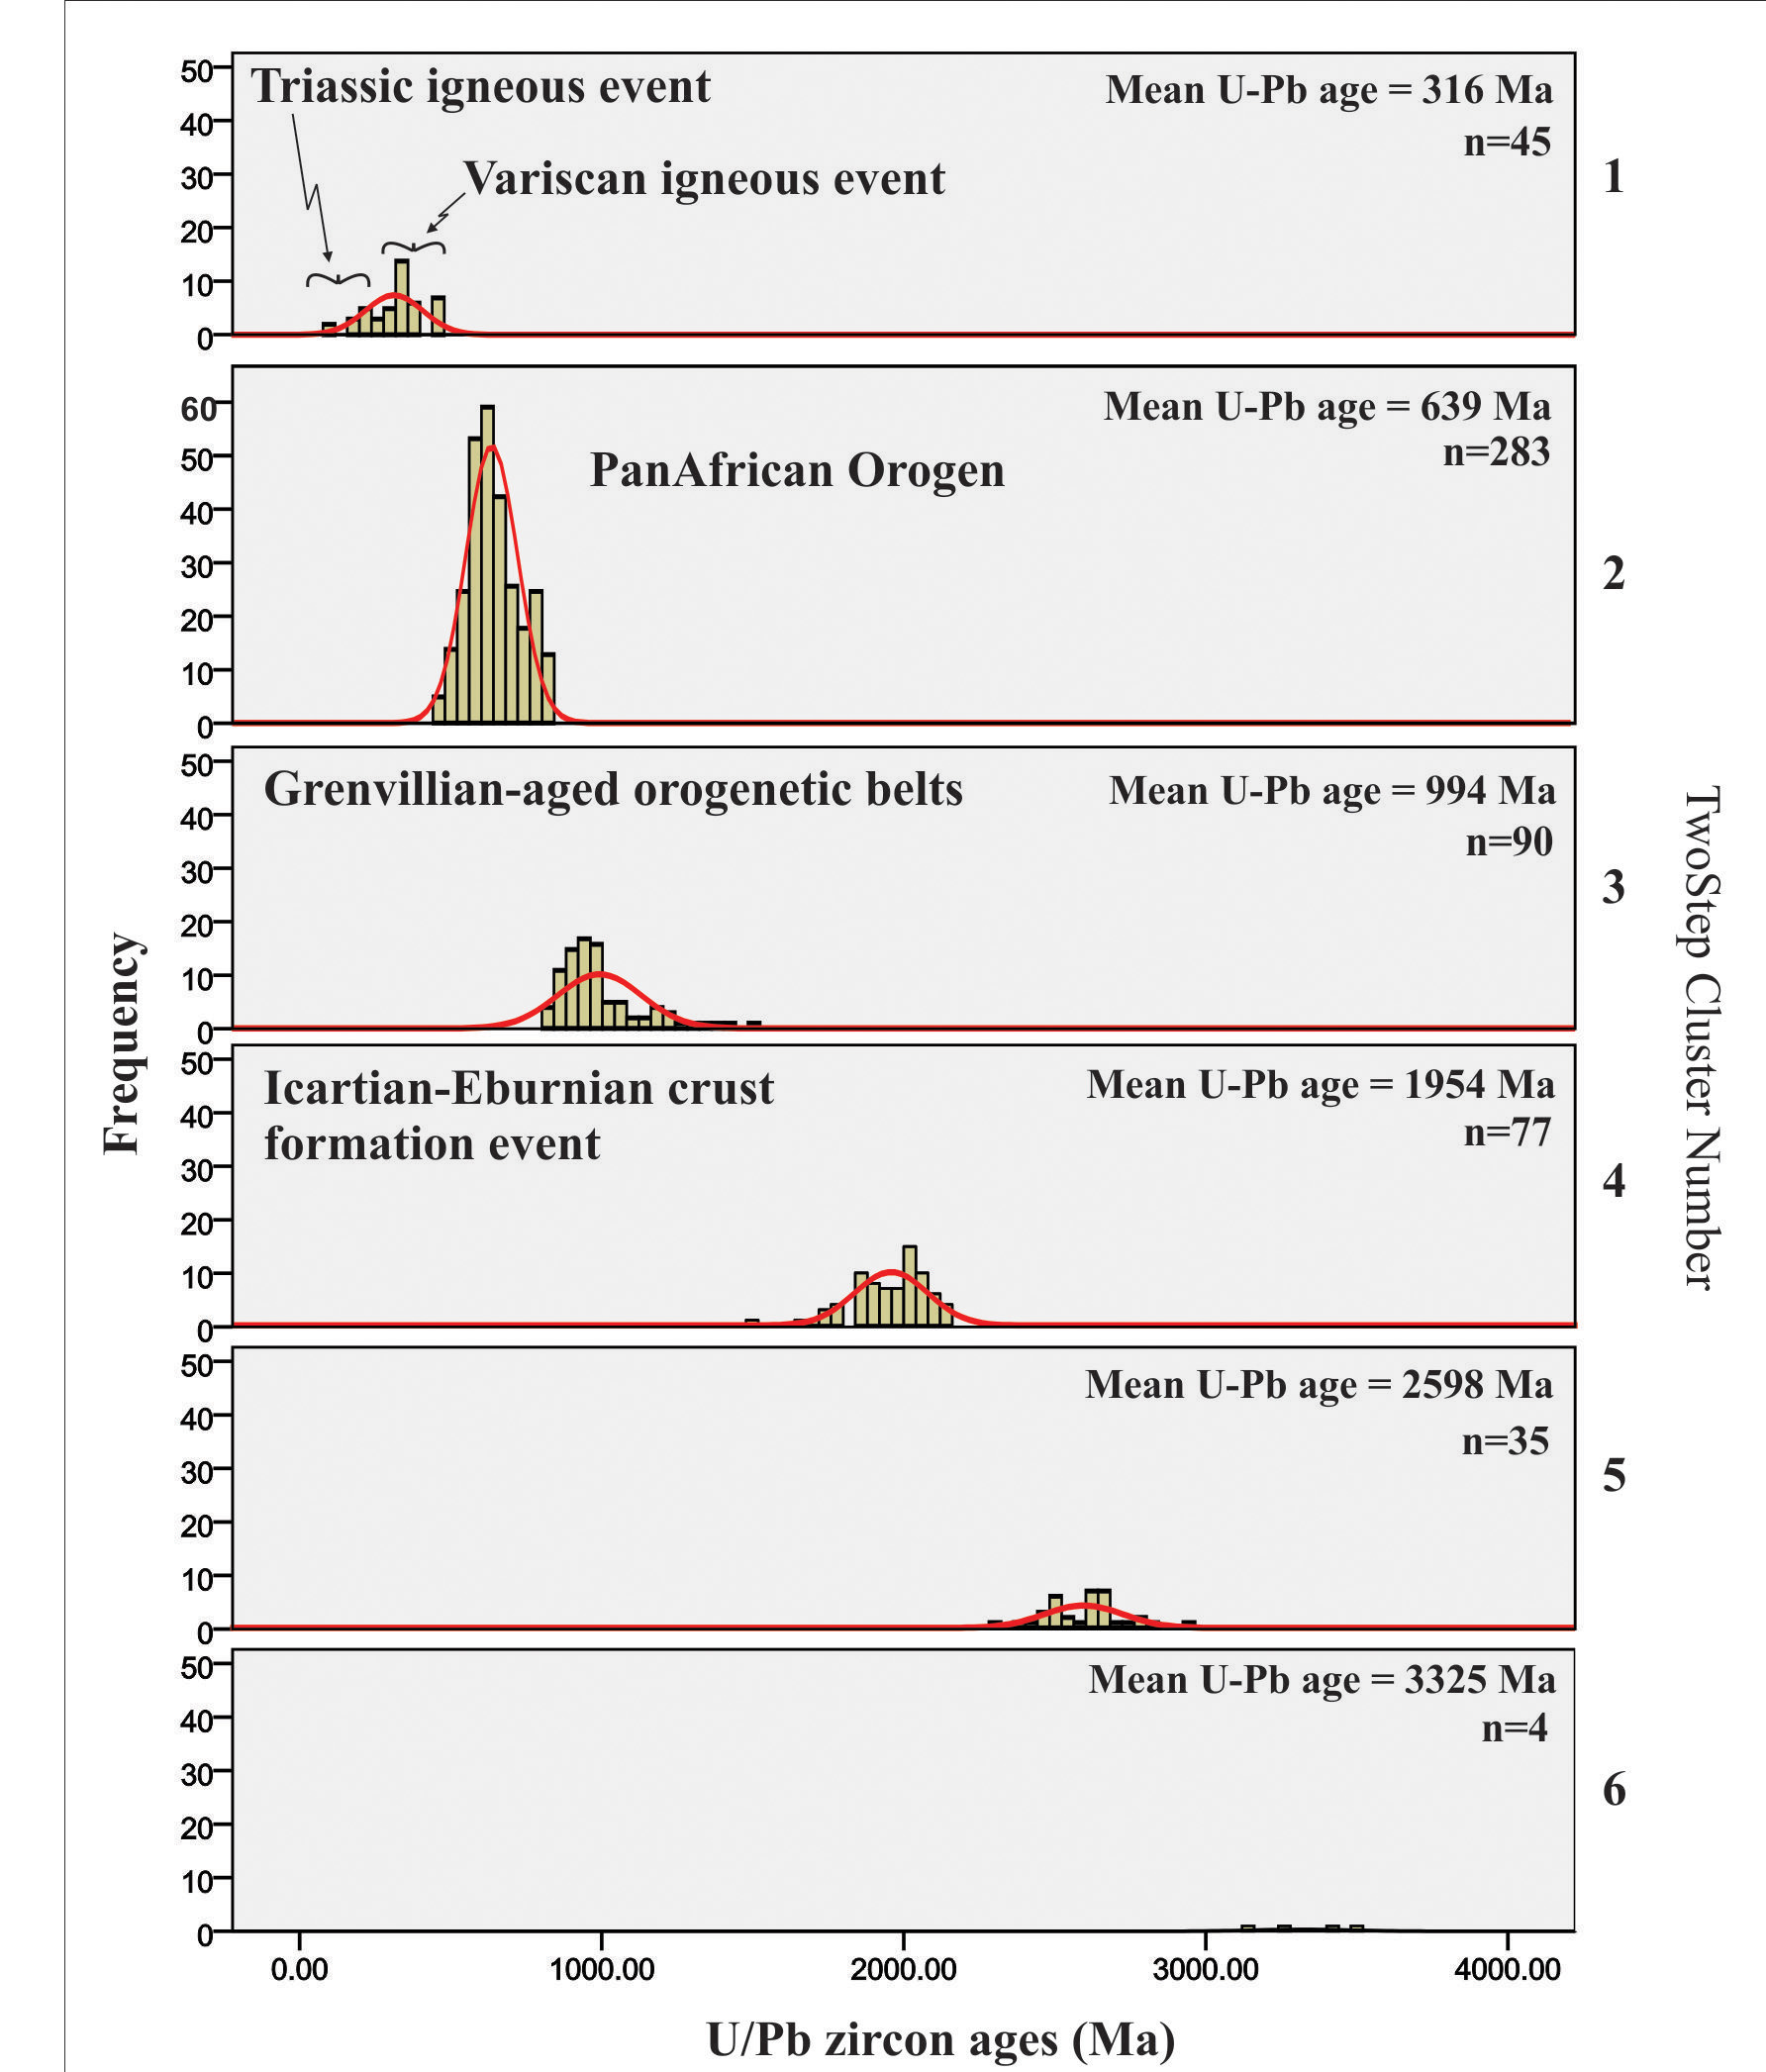
Figure 5. Decomposed zircon U/Pb age populations from South Aegean using 2Step-cluster analysis.
206Pb/238U ages are quoted for analyses younger than 1.0 Ga, whereas 207Pb/206Pb ages are quoted for analyses older than 1.0 Ga.
Figure 6. U-Pb ages of zircons from localities of the forearc and volcanic arc at the South Aegean.
206Pb/238U ages are quoted for analyses younger than 1.0 Ga, whereas 207Pb/206Pb ages are quoted for analyses older than 1.0 Ga. Grey shaded bars are important thermal events (discussion in the text).