Laboratory preparation of samples for EBSD
Orientating samples
Any type of sample can be analysed by EBSD, as long as the sample is crystalline and hard enough to produce a topographically flat surface after polishing. After field mapping has been completed and orientated hand specimens have been collected or laboratory experimental samples have been produced, the most appropriate reference frame to study the sample needs to be chosen (Prior et al., 1987). A common geological reference frame for deformed rocks is the kinematic reference frame where samples are cut perpendicular to foliation and parallel to lineation. This is also referred to as the XZ reference frame (Zucali et al., 2002). For samples produced from laboratory rock deformation experiments it is more applicable to work in a stress-related reference frame, such as using the compression or extension direction as the important external parameter (Llana-Fúnez and Rutter, 2005). A common reference frame for metallurgical research is related to the rolling, normal and transverse directions that correspond to how the metal was processed (Saeid et al., 2010; Siqueira et al., 2011). It is important to record what reference frame is being used as it will be needed during data presentation and interpretation.
It is vital to choose the most applicable reference frame for the research before preparing EBSD samples. It is advisable to keep linear features, whenever possible, parallel to either the long or short axis of the sample (depending upon shape) as this makes data interpretation easier later on. The overall size and shapes of samples that can be studied using EBSD is mainly limited by the size and shape of the SEM EBSD holder. Most holders produced specifically for EBSD analysis (often custom made) will normally accept standard thin sections (30 µm thick slices of rock glued onto glass slides that are often 4.5 x 2.5 cm) and blocks (blocks either rectangular 4.5 x 2.5 cm or 1 inch diameter cylinders). Oversized holders have been made to allow larger samples to be studied and the maximum holder size possible is determined by the size of the SEM sample chamber.
Advanced preparation of samples for EBSD
EBSD can be performed on broken surfaces of samples that do not polish well, but most laboratories work on specially polished sample surfaces. After samples have been cut and polished to produce standard blocks or thin sections, the samples are mechanically polished using decreasing grades of diamond paste such as 3µm, 1µm and either 0.5µm or 0.25µm diamond paste. It is necessary to perform a final stage of polishing to remove the surface layer damaged produced by the previous lapping and mechanical polishing stages. This final damage layer must be removed by an advanced polishing technique such as chemical-mechanical polishing (CMP) (metal and geological specimens), electro-polishing (metals), chemical etching (metals) or ion beam milling (metal and geological specimens). For geological specimens the most common technique used is CMP using either a colloidal silica suspension (0.02-0.06 µm) (Flynn and Powell, 1979; Lloyd, 1987b) or 0.05µm colloidal alumina suspension. This chemical-mechanical polishing process results in very slow abrasion rates removing 1-2 µm of material per hour or ~ 1 atomic monolayer per second (Lloyd, 1987a).
The important differences between the colloidal silica and alumina are the grain shape and pH. Colloidal silica is more rounded in shape and has typical pH values of greater than 9, whereas the alumina suspension has a platy shape and a typical pH value of approximately 7. Different brands of colloidal silica and alumina will have slightly different properties with differences normally being in the grain size and pH. For instance Buehler produces two colloidal silica suspensions which have different pHs and particle sizes, namely (1) MasterMet which is a 0.06μm colloidal silica suspension with a pH of ~10; and (2) MasterMet 2 which is a 0.02μm non-crystallizing colloidal silica suspension with a pH of ~10.5. It is important to make sure to use the suspension which has the properties which suit your task best and which suspension to use depends upon the bulk mineralogy of the thin section and the aims of the research. If part of the aim of the research is to quantify geochemical variations, as well as textural variations, Al is often one of the important constituent elements studied and if the sample is polished with an alumina suspension some of the polishing particles can become embedded into cracks, holes and in the sample surface and may create errors in any geochemical data collected. A good post polishing cleaning routine will reduce this problem but if both silica and alumina suspensions are available and there are no other parameters significantly influencing your choice then colloidal silica is the better option. Due to the pH of colloidal silica many researchers will not use it to polish carbonates as it can cause chemical etching of the sample. Chemical etching can also be a problem if any sample is left to polish for too long a time.
There are many different types of polishing machines and polishing pads available. Polishing pads can be made from cloth that is either stretched out over a disc on the polishing machine or can be attached via an adhesive back. Firms that produce quality equipment and consumables include Buehler, Struers and Kemet. Most of these firms will send out samples so researchers can perform polishing tests on your own equipment to determine the best consumables for your research. Also many of these firms will perform polishing tests on samples supplied to them. When selecting a suitable final stage polishing cloth or pad, choose items that are described as chemically resistant, durable pad ideal for rough and final polishing of hard steels, ceramics and composites for use with CMP or for use with activated suspensions.
Recently I performed a polishing test on a quartz rich sample using a Syntron brand vibratory polishing machine type LP.01C, style B-60693, which operates on 240V, 1.25 amps and 50 cycles. The control dial was turned to 85 (max = 100). A Buehler brand ChemoMet 10” PSA pad and Buehler brand MasterMet colloidal silica were used as the polishing pad and medium. With this setup, the sample needed to be polished for at least 2 hours to produce a surface giving reasonable EBSD patterns. This was slow in comparison to other vibratory polishing machines I have used in the past and the weight of the holder was similar (heavier holder should decrease polishing time). Polishing time of 4-5 hours for this quartz-rich sample gave the best compromise between polishing time and polishing quality. A sample polished for 10 hours showed an extremely high quality polish but this was not absolutely necessary for EBSD. In general, harder materials require more time to polish. Minerals of a similar hardness to quartz should be polished for a similar amount of time.
When performing CMP, the sample requires systematic checking to prevent possible problems such as ‘lifting’ (thin sections) or plucking of grains (thin sections and blocks). ‘Lifting’ in thin sections is a term used to describe when the rock slice begins to peel away from the glass slide as the polishing fluid flows between the rock slice and glass slide. This can be a common occurrence if using thin sections which were manufactured a long time ago. This is due to the fact that the adhesives used to prepare the thin sections may have degraded over time or were not as high quality as those used in thin section preparation nowadays. If lifting does occur, cease polishing immediately since ‘lifted’ sample sections cannot be studied using EBSD and the sample will have to be used as is. Plucking of grains causes problems as it reduces the grains available for analysis in the sample but also the loose fragments can scratch the sample surface causing damage to other polished areas.
Post polishing cleaning routines
Figure 1. The effects of polishing and data processing

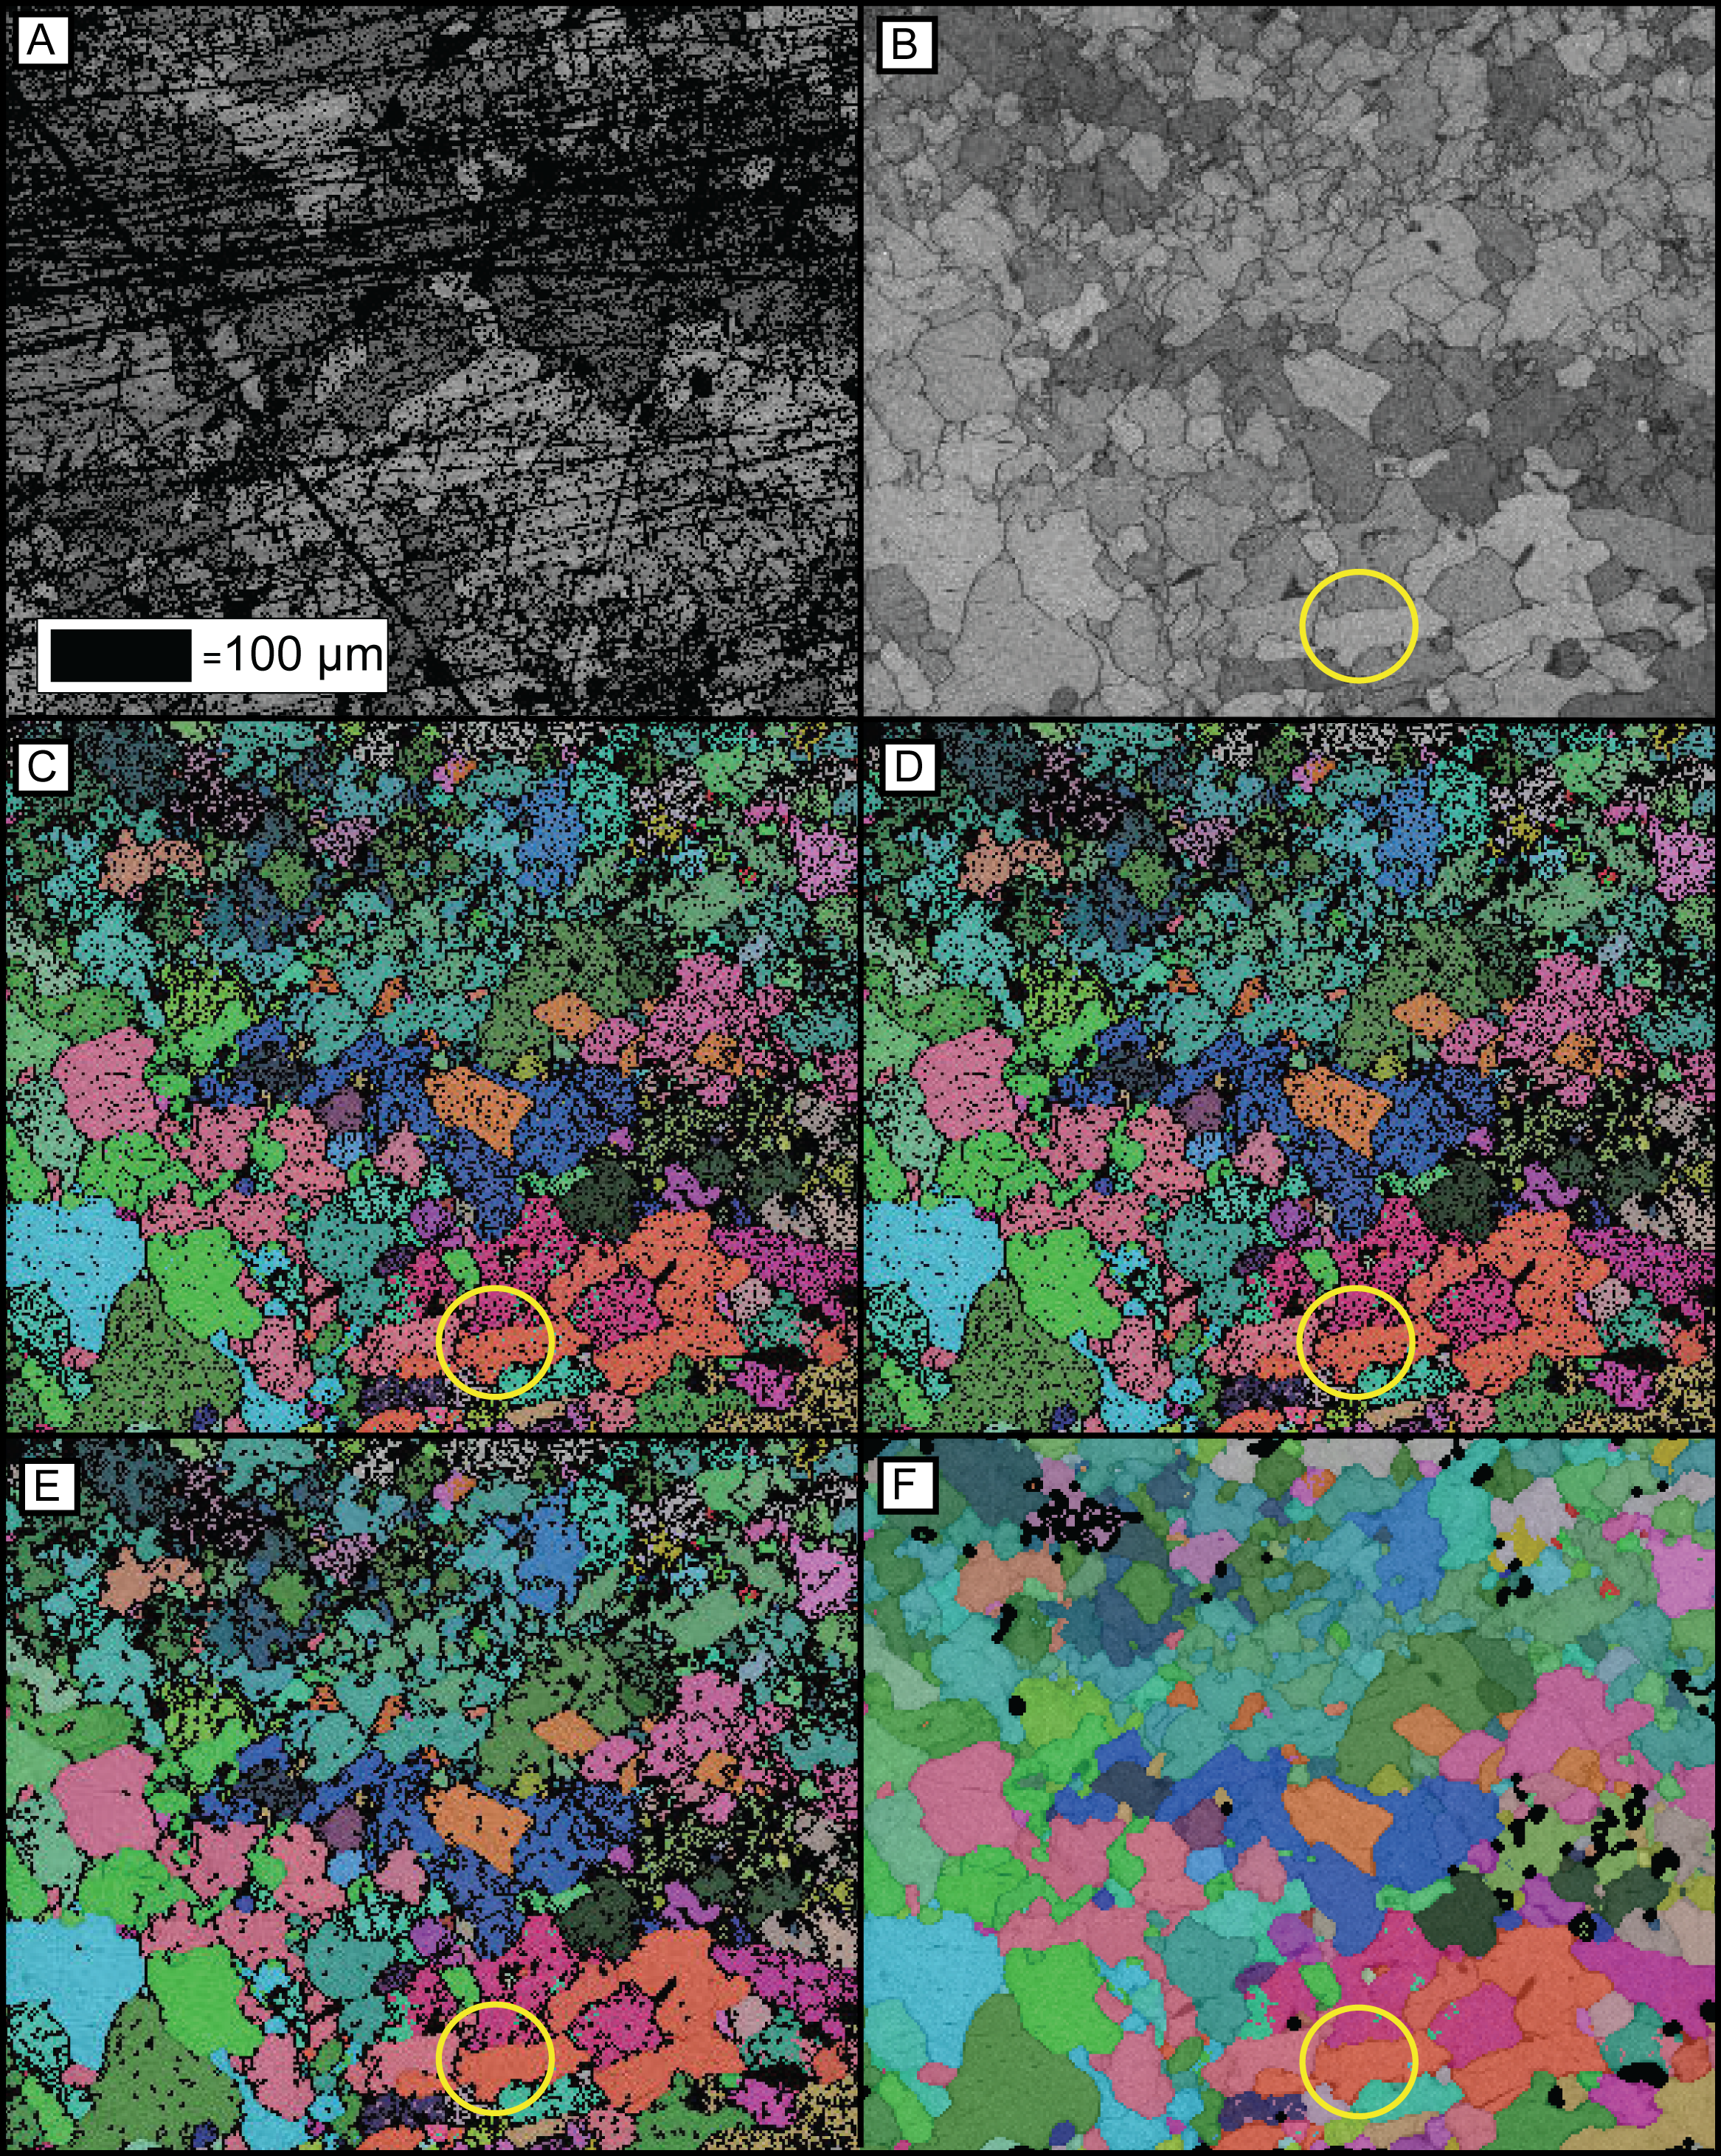
(A) Is an example of a poorly polished sample surface. (B) Is a well polished sample surface where all grains and their boundaries are well defined. This sample is used for remaining figures. (C) The raw EBSD data for an experimentally deformed calcite sample. (D) Illustrates how the ‘wildspikes’ data processing technique has removed erroneous single data points. Compare the area inside the yellow circle between figures 1C and 1D and the green single pixels have been removed. (E) Displays the data after growth to completion based on 8 and 7 neighbours. (F) Shows the final data after processing is complete.
After the allotted polishing time, check the polished sample using reflected-light on an optical microscope for polishing defects. Figure 1a & 1b illustrate the difference between a poorly polished surface (Fig. 1a) and a well polished surface (Fig. 1b). It is important to thoroughly clean the sample surface to remove all contamination caused during polishing. The sample should be rinsed under cold water, placed into a small beaker of water, and then deposited into an ultrasonic cleaner for approximately ten minutes. This will remove some of the polishing solution particles that have become located in cracks, holes, grain boundaries and embedded into the sample surface. The sample can then be removed from the ultrasonic cleaner and dried using lint free tissues. Another cleaning method is to wipe the surface with ethanol and then allow it to evaporate taking dirt and grease particles with it or dry it using a hot-air dryer. The sample should then be blown off using an inert aerosol spray such as dust off to remove loose particles still attached to the sample surface before being placed into the SEM.