Microstructural and microchemical analysis
It is vital that all micro-scale information be directly linked to the local and the regional structural geological framework. Microstructural analysis of the pebble was done to quantify the character of the pebble itself, and to determine deformation patterns and the quality of individual grains. Microchemical analysis was undertaken to provide information on the variation between possible different generations of white mica grains, and any intra-grain changes and character of the white micas. This combined data has been essential for the understanding of the 40Ar/39Ar geochronology undertaken in this study.
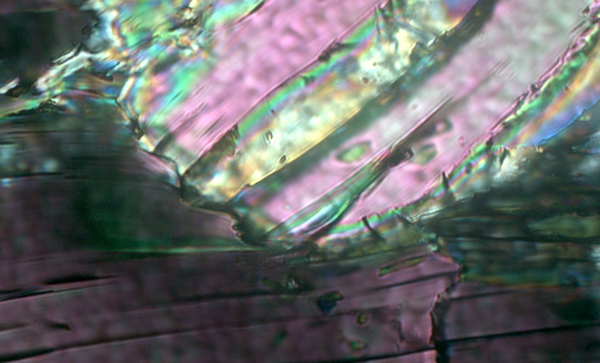
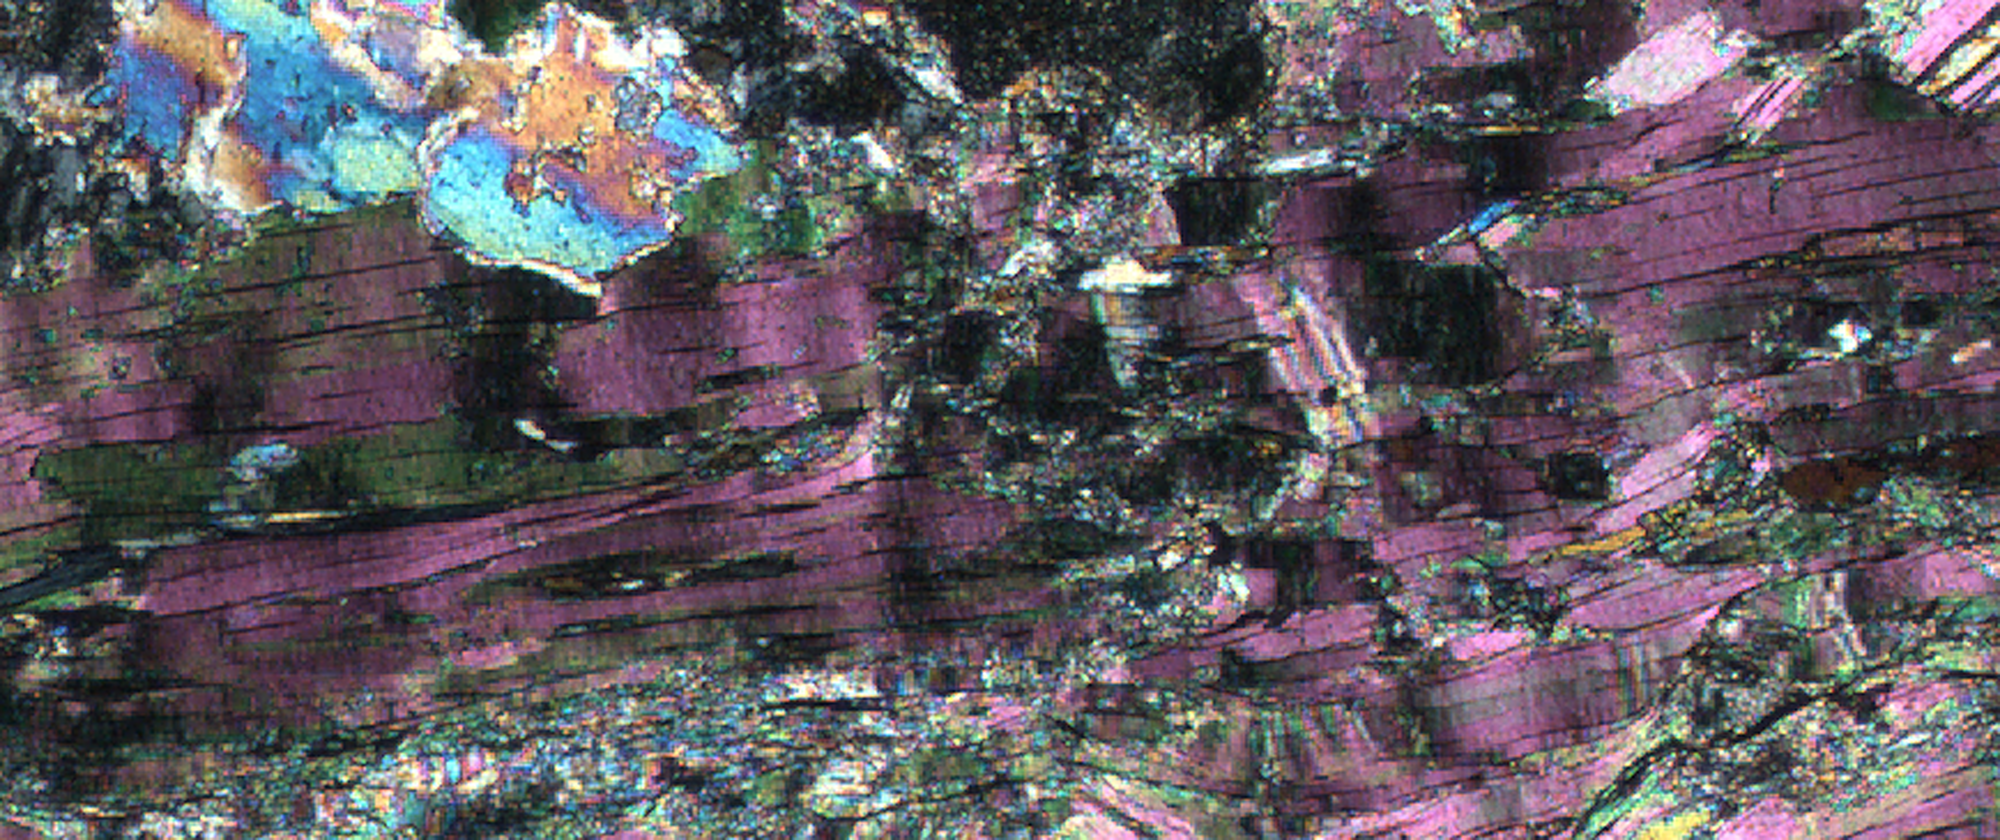
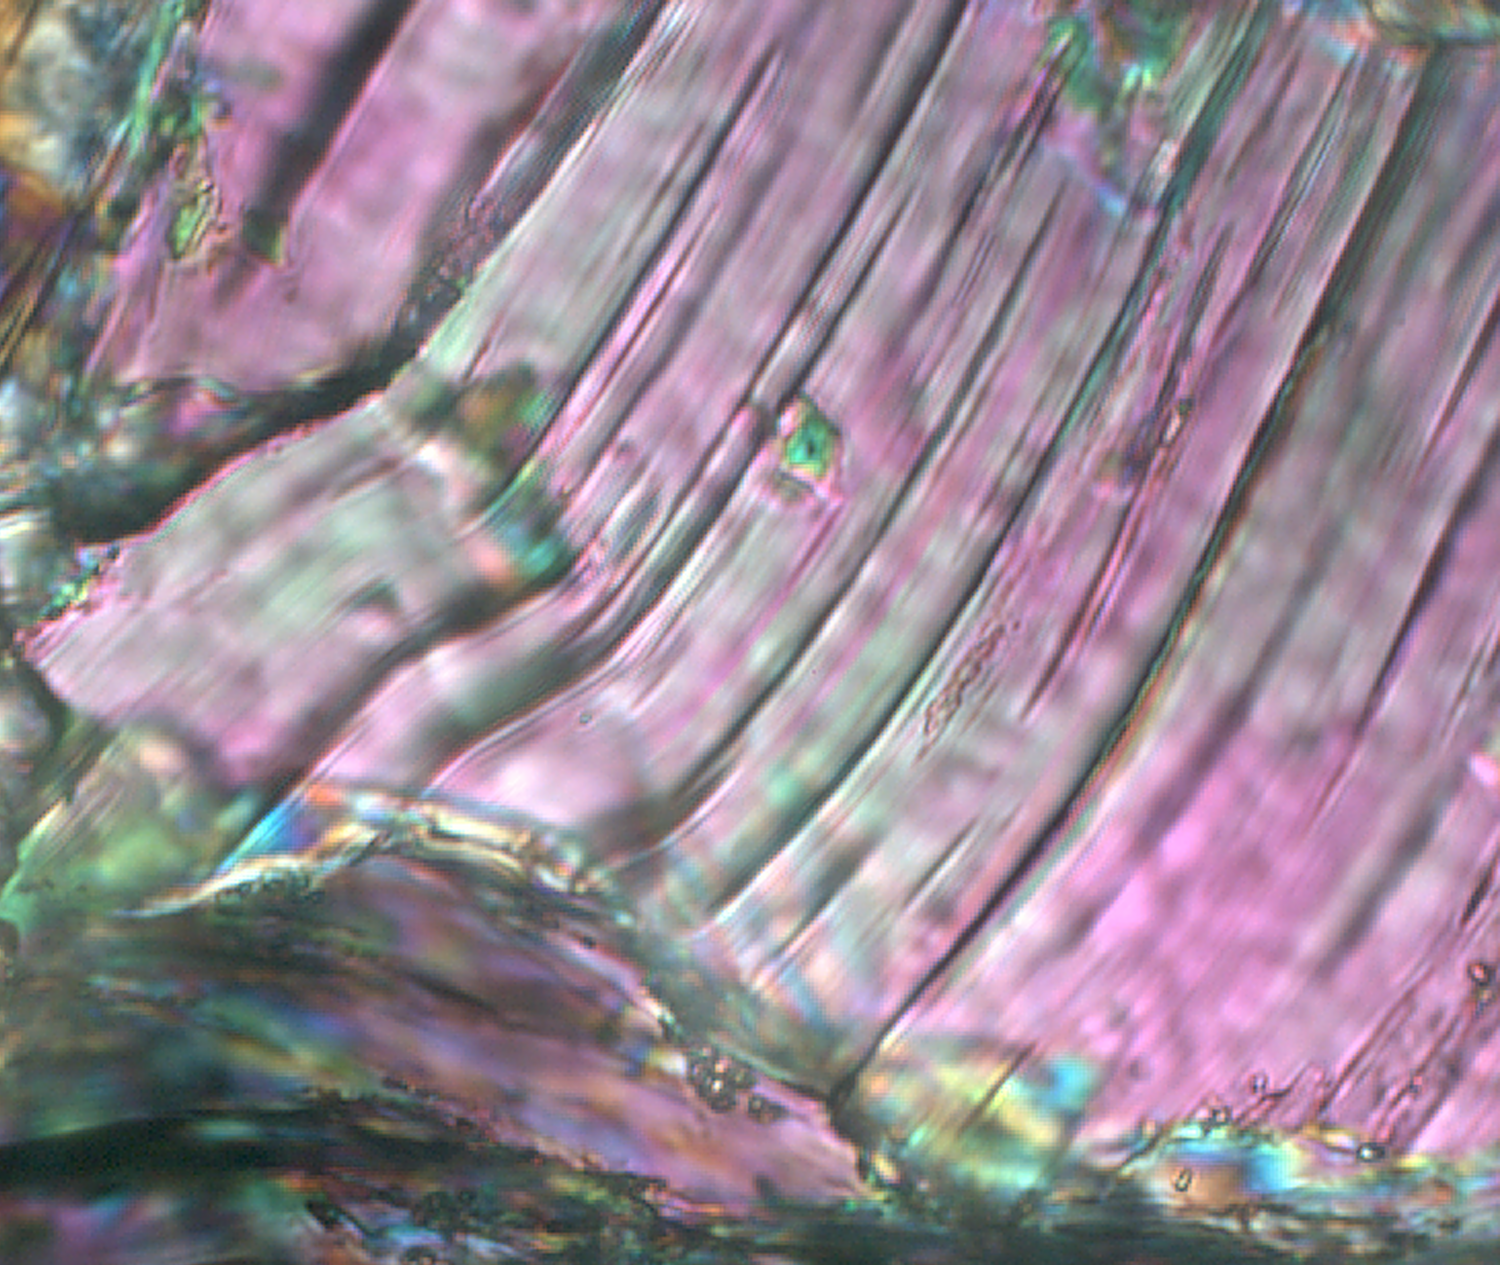
Figure 6. Microphotograph of white mica zones.

White micas with grain-scale deformation. Recrystallisation occurred mainly at the margins and adjacent to defects. Irregular deformed high-strain zones remain frozen into the grains. Field of view ~5 mm.
The granite pebble used in this study contains isolated zones of aligned white micas that anastomose across the whole pebble. White mica grains do occur elsewhere in the pebble but are rare (Figure 3b). Microstructurally the narrow zones of white mica grains represent a deformational fabric or micro-scale shear zone (Figure 6). These white mica-rich zones are commonly 2-4 grains thick with grains up to 1:10 W:L ratio, however not all grains remain as whole grains due to fracturing and significant internal deformation. For example, some grains are themselves folded, generally with the fold axis perpendicular to the long edge of the grain. Also irregular kinks of single grains occur causing extensive irregular undulose extinction (Figures 6, 7, 8). In addition complete and partial fracturing of the grains is common phenomena (Figure 9). Micro-scale localised recrystallisation is observed around the margins of grains and in zones at the boundaries of fractures, or high strain zones (Figures 7, 8 and 9). A greater degree of recrystallisation is present in the smaller grains compared to the larger elongate grains.
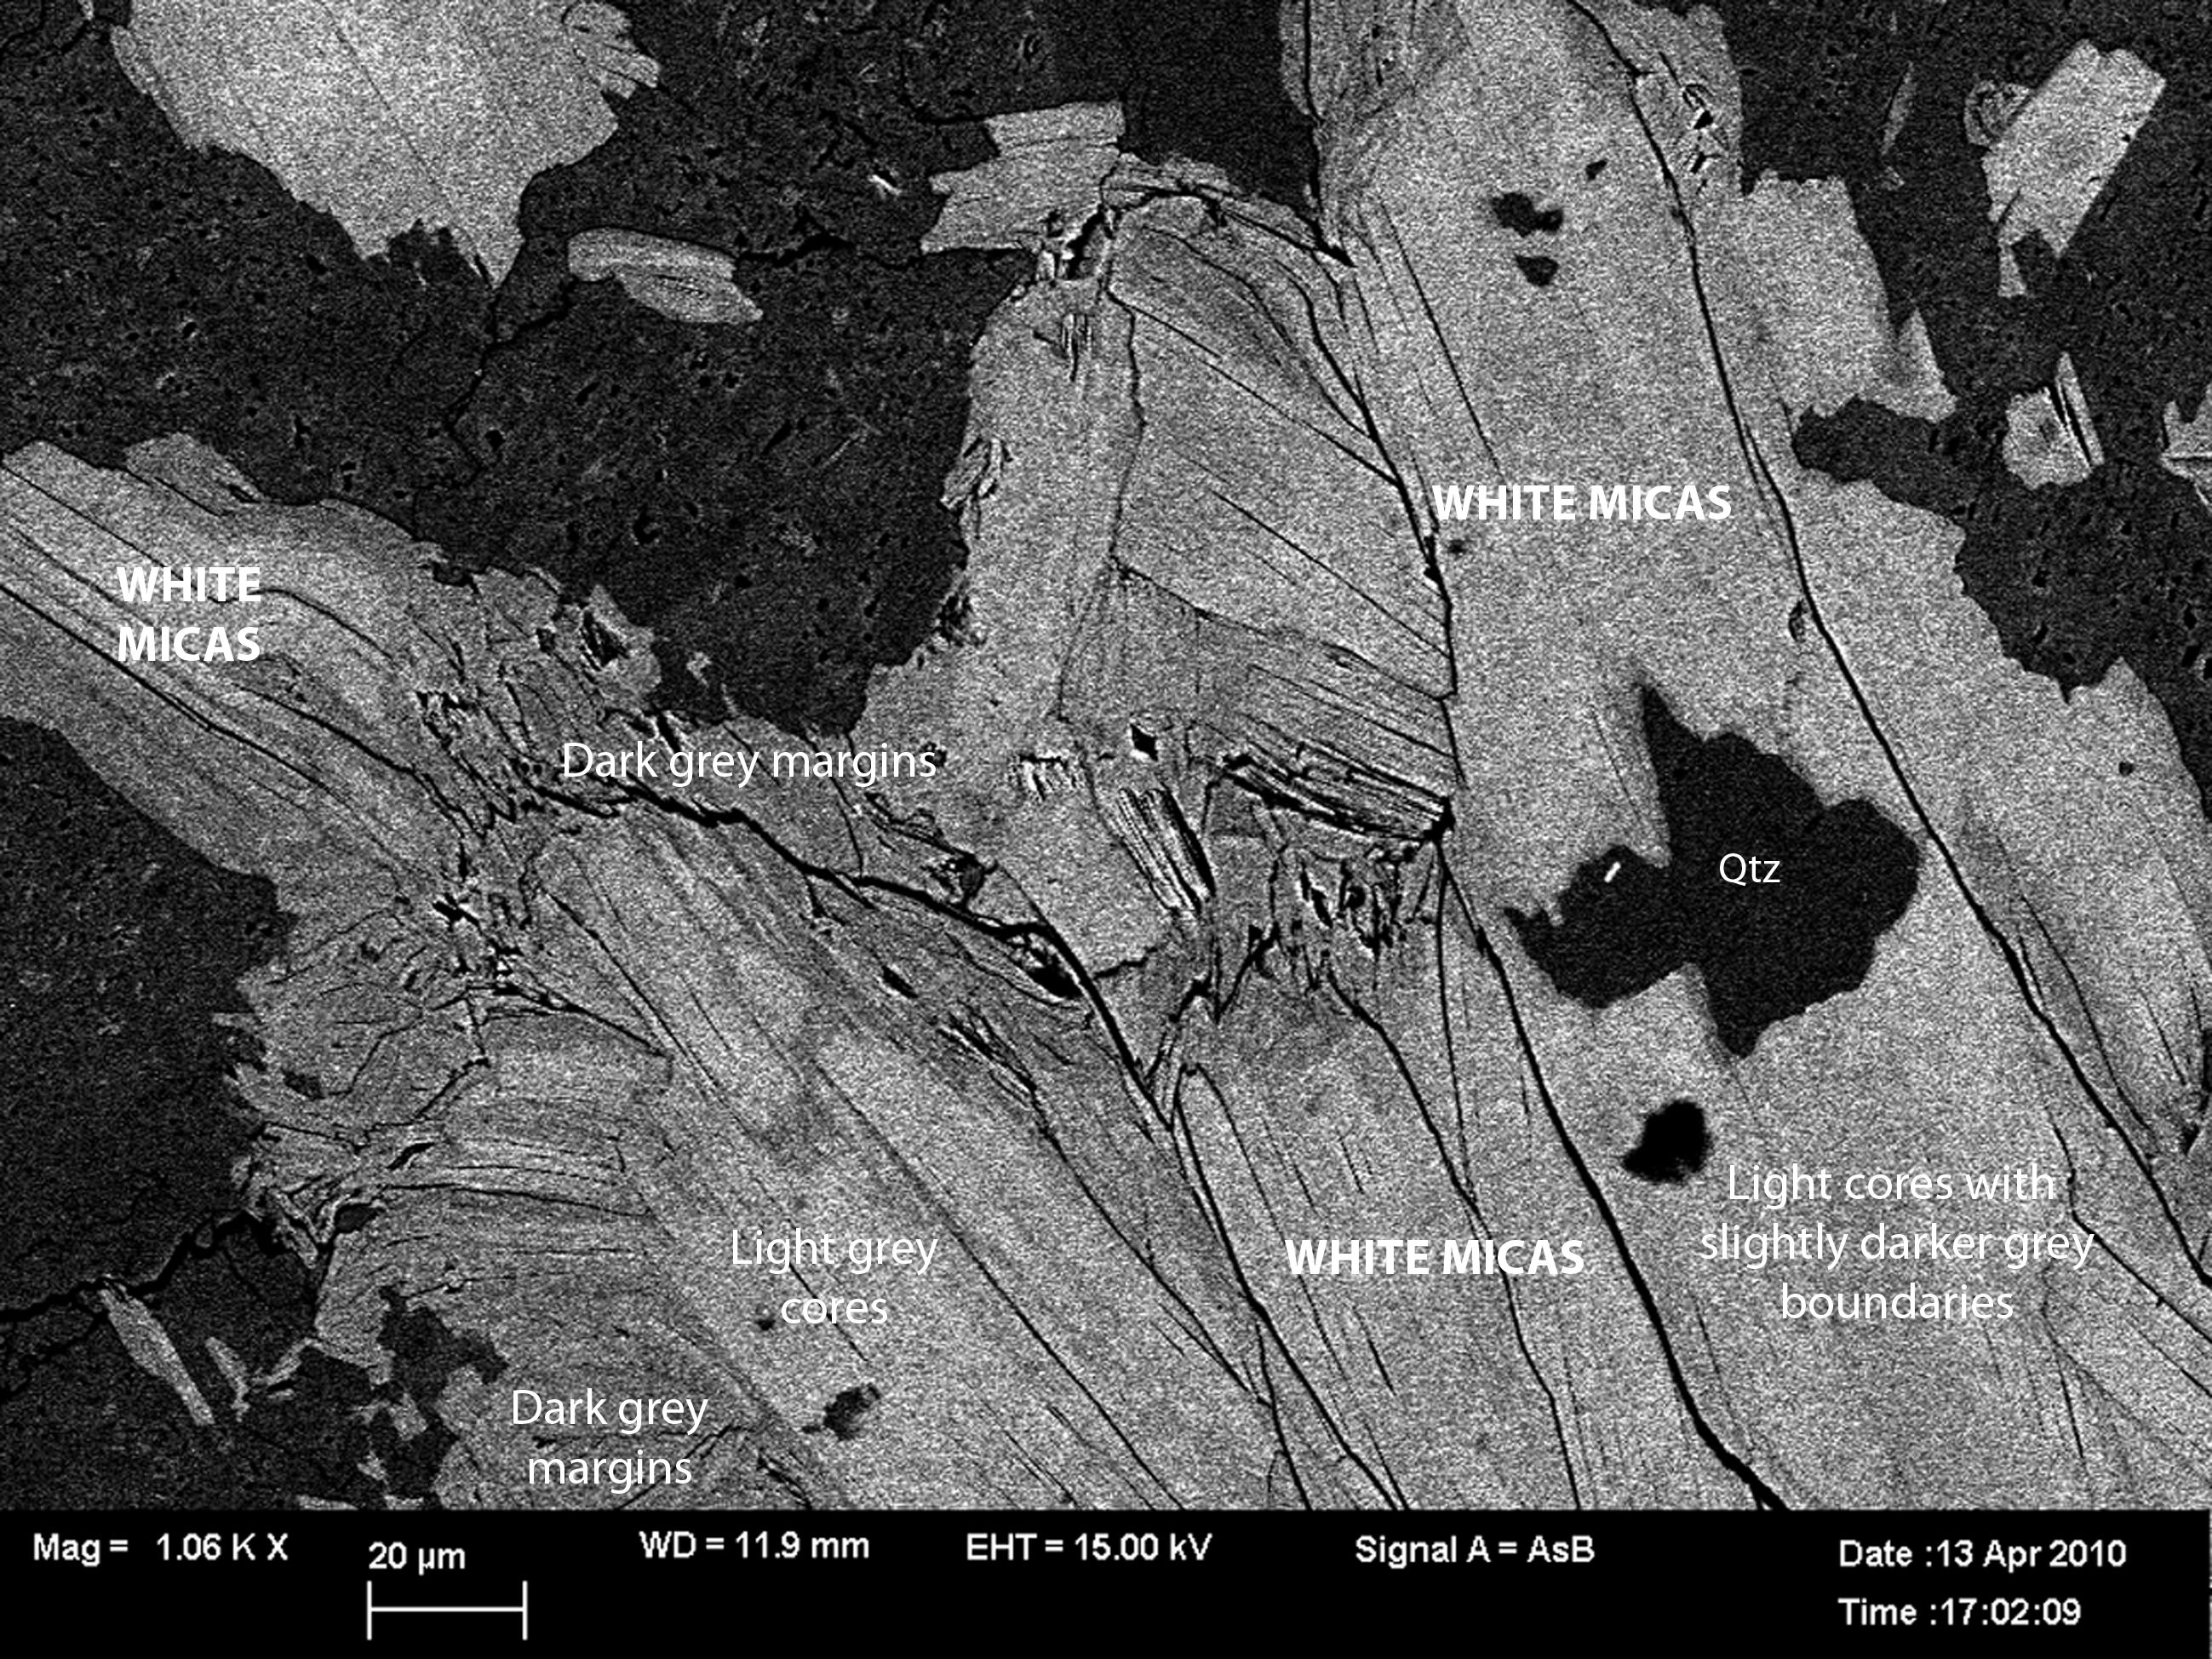
Figure 7. Backscatter image of several grains of white mica indicating the variation in composition using tonal variation (dark to light grey).
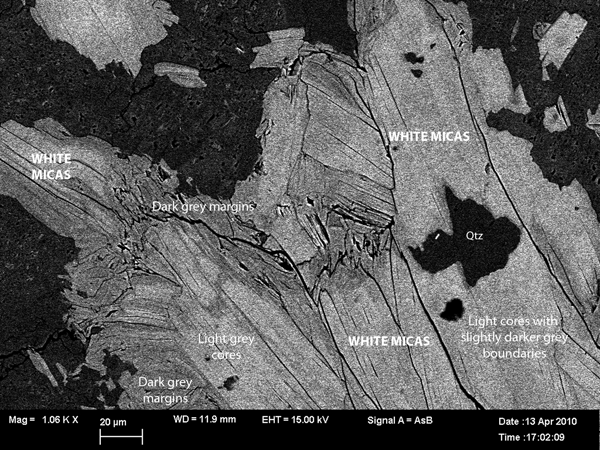
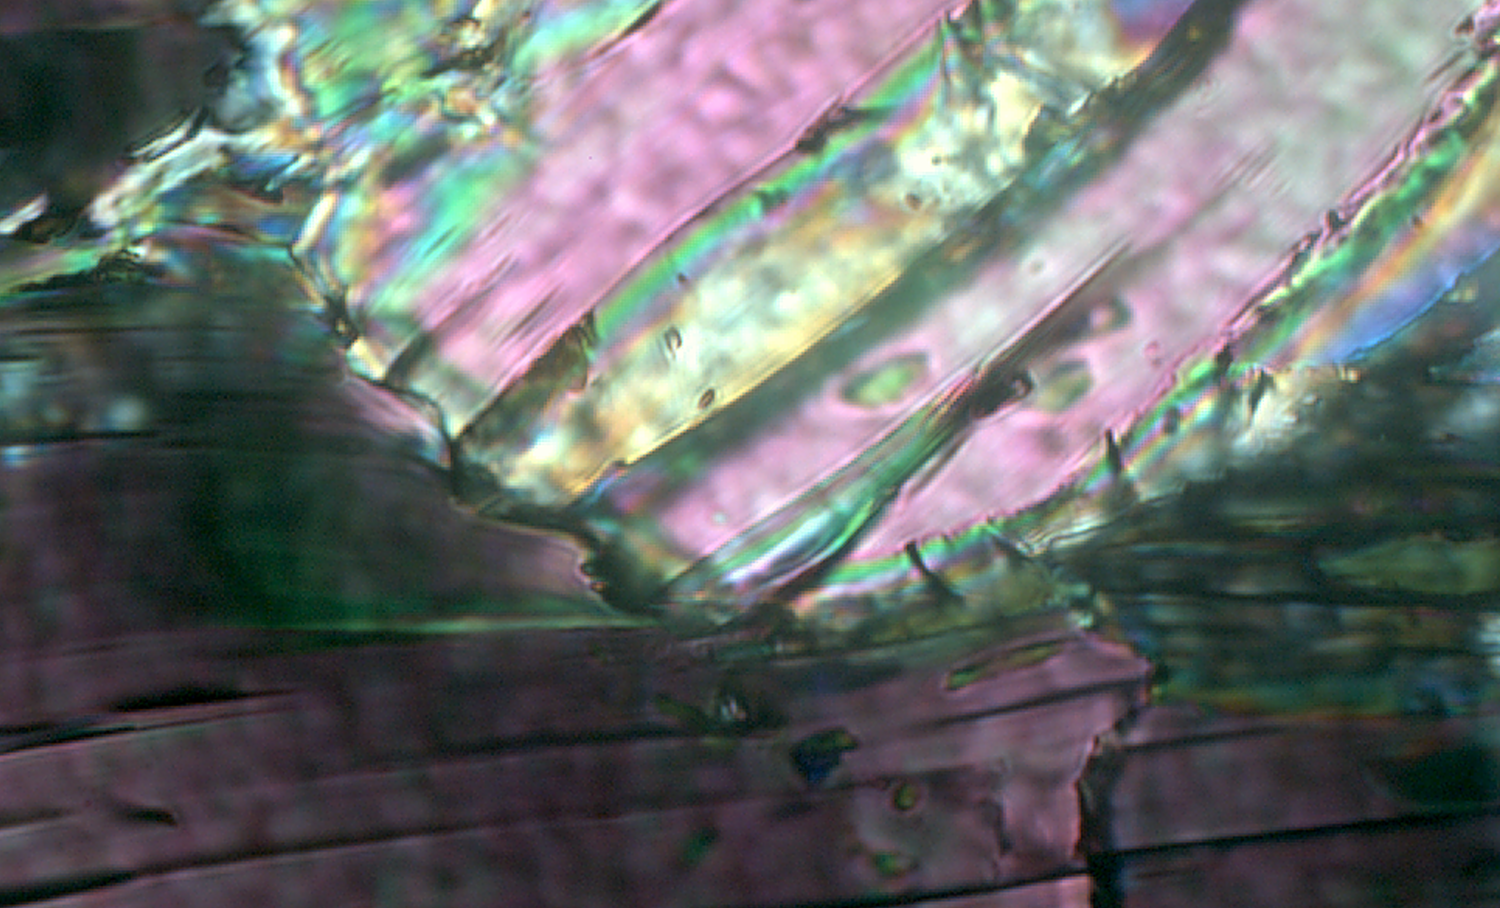
Figure 8. Microphotograph of deformed white mica with little to no recrystallisation occurring along high strain zone.

Backscatter images verified intra-grain deformation and localised crystallisation of the white micas. Images of the white mica grains within these small-scale shear zones showed a chemical variation, recorded as three different tones within and between white micas (Figure 7). Micro-chemical analysis of the different shaded zones was undertaken to determine any differences in composition, three different compositions of white micas were detected, the lighter core was the dominant composition. A mid-grey rim to the core was common as it rimmed all the light grey zones, however it was a narrow zonation. The third chemical composition was the darker regions. The recrystallisation seen as the darker areas in the backscatter image, is not as abundant as the core composition and occurred on the very margin, fractured terminations to grains were generally completely recrystallised, as were simple fractured zones. Any new white mica grew as small grains and also had this chemical composition.
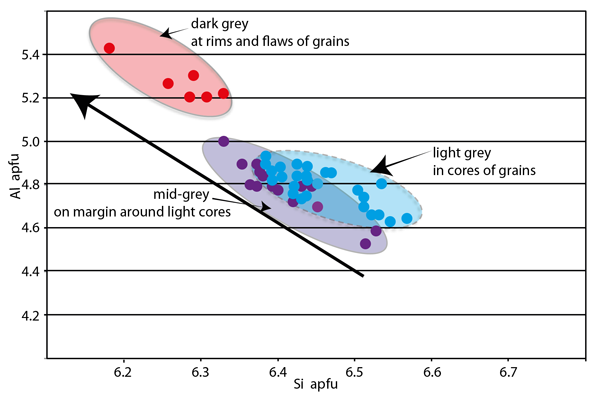
When these three different microchemical compositions are plotted on an Al/Si apfu (Atomic Per Formula Unit) plot (Figure 10) it can be observed that the texturally younger, dark zones (observed in the back scatter image) are microchemically distinct (low Si apfu) when compared with the cores. The older cores of the grains (light grey) and the rims of the cores (middle-grey) overlap on the plot with the lighter cores having the highest Si-content numbers. The micro-chemical results of the three different generations of white mica show a distinct shift from higher Si-content of almost 6.6 (Si apfu) in the white mica cores to a low of just under 6.2 (Si apfu) in the darker rims of small grains, reflecting a decrease in pressure with later crystallization (Bröcker et al. 1993 ).
Figure 10. Graph of microchemical variation defined by Si- and Al-apfu (Atomic Per Formula Unit).
The cores of grains had slightly higher Si-apfu, however mostly there is very minor variation compared to the rims of these grains. A generation of white mica growth, defined as a darker grey in the backscatter image, Figure 7, has distinctly lower Si-apfu compared to cores. These growth areas are minor in the overall volume of the analysis of white micas from this pebble.