Strait of Messina
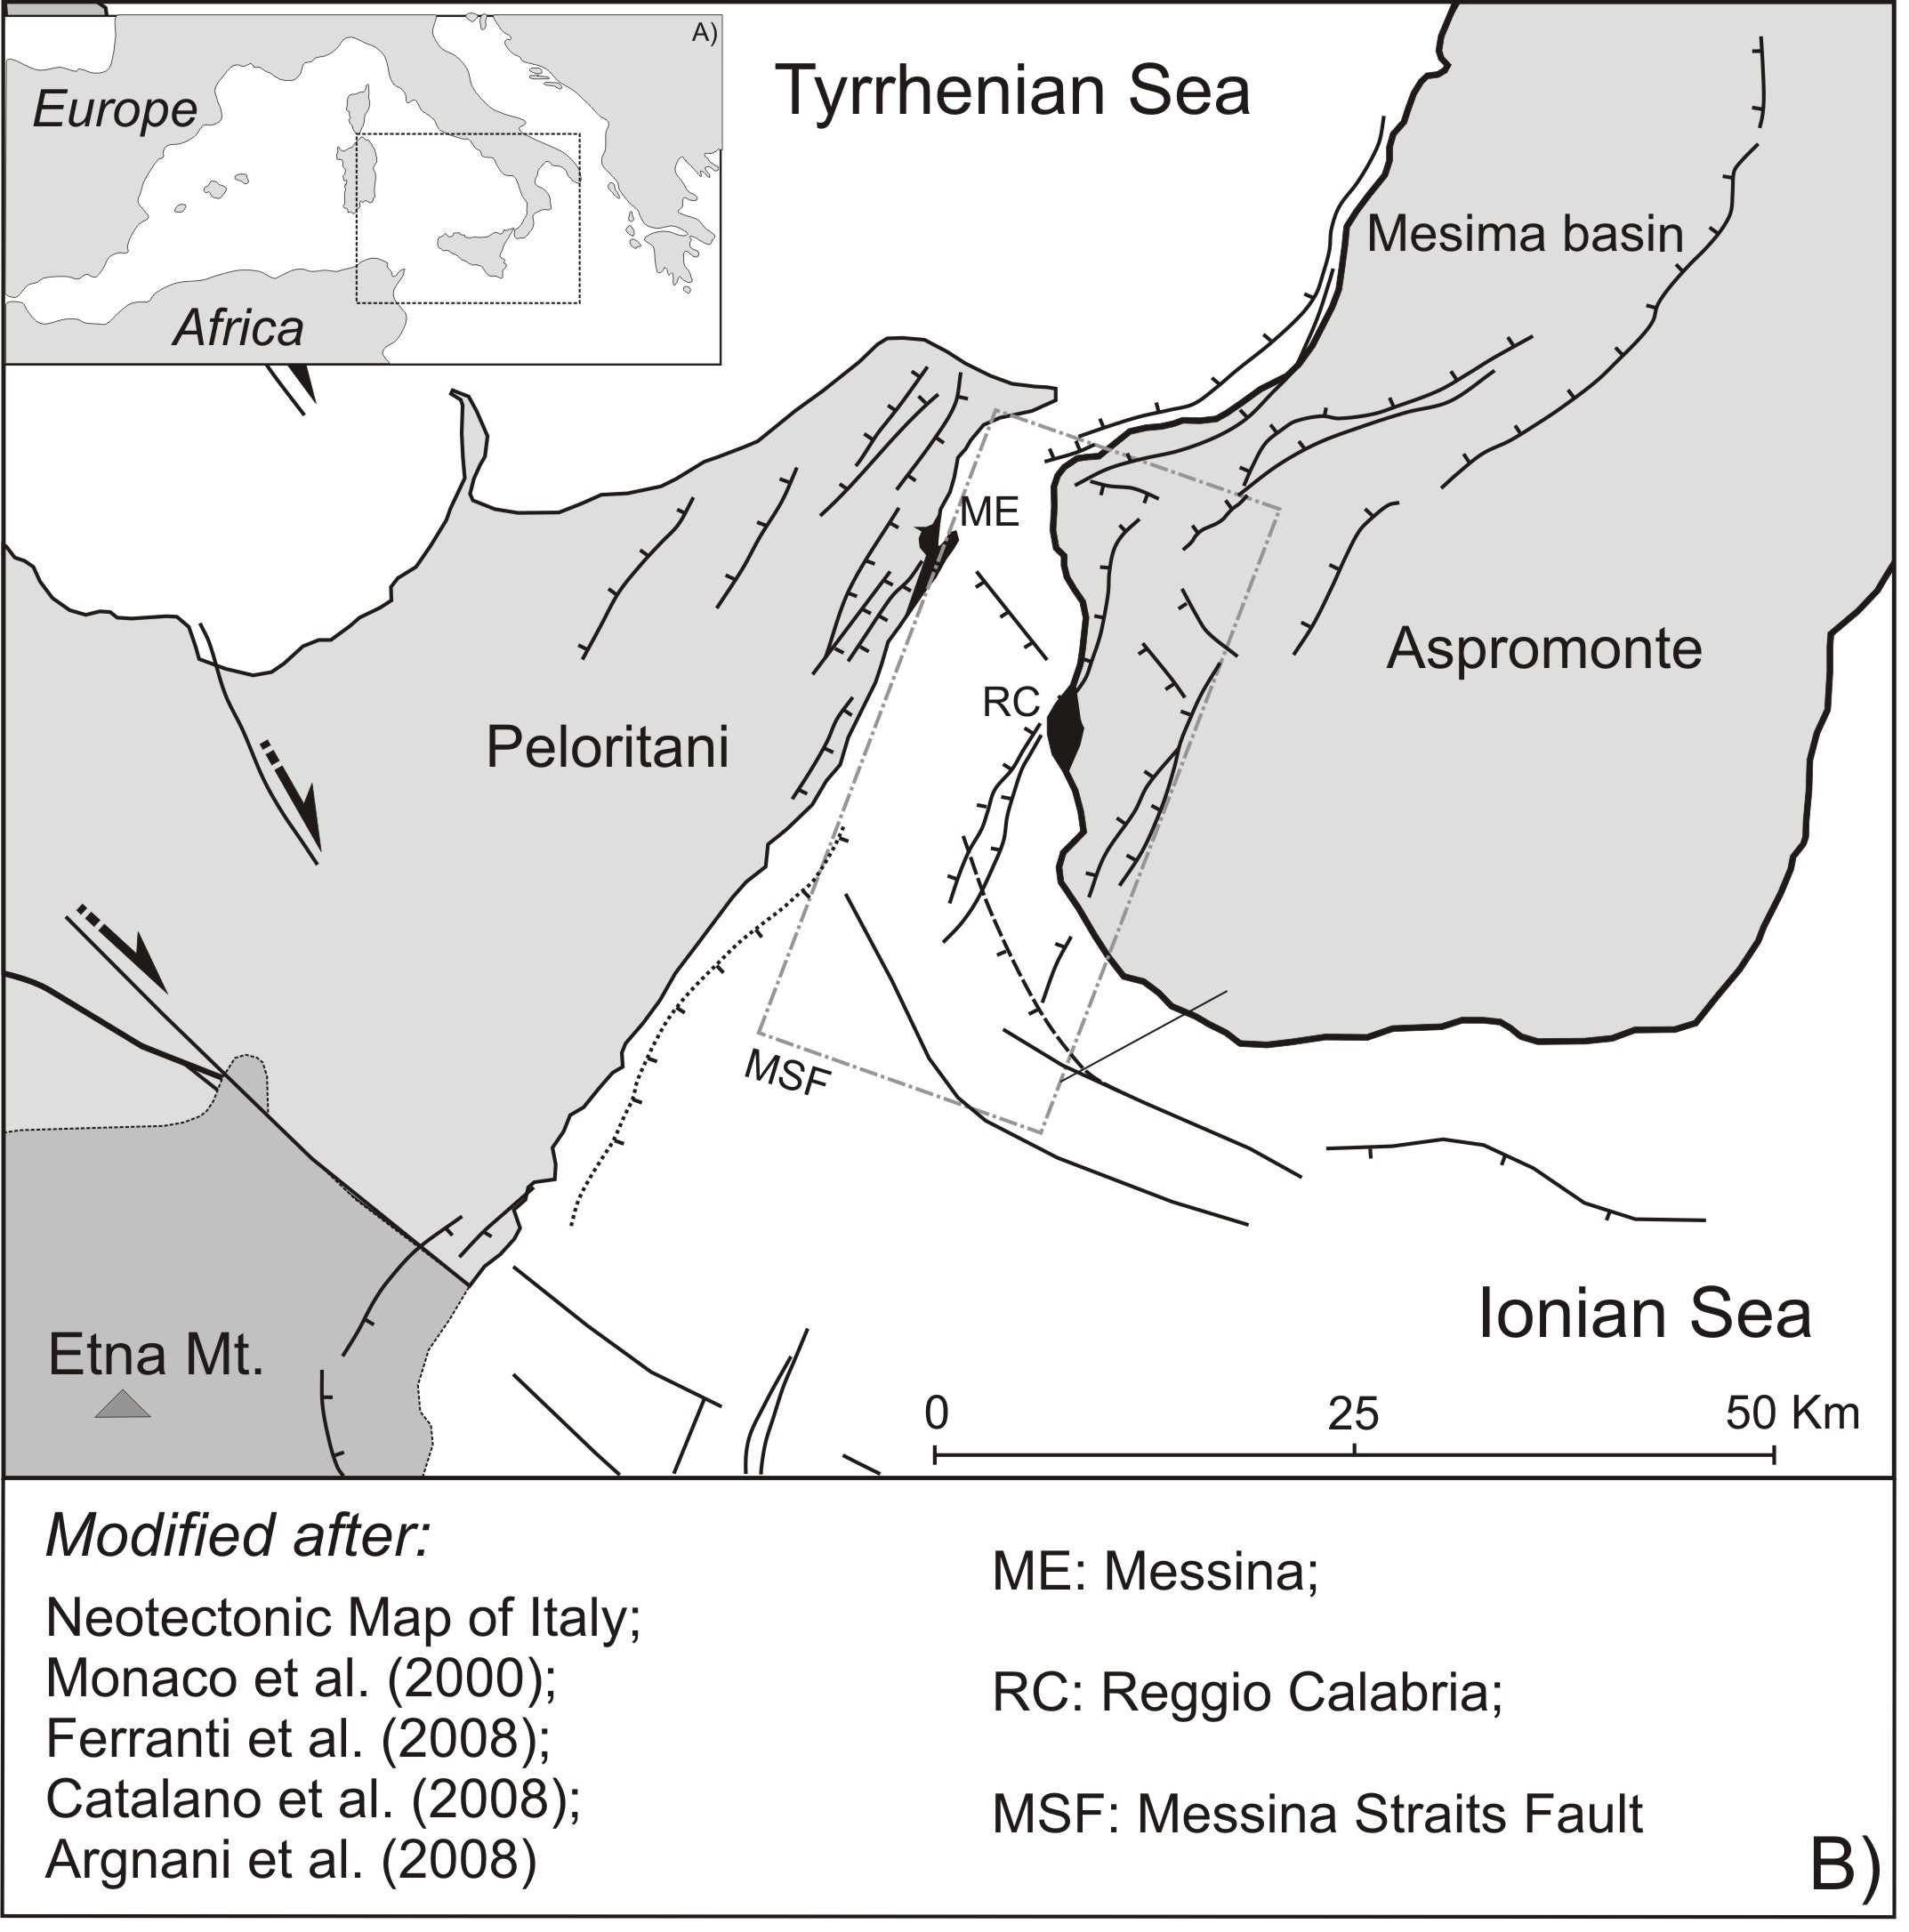
The Strait of Messina is characterized by a complex geodynamic process which affects both the Calabrian Arc compressive zone system and the Tyrrhenian extensional tectonic system (Lentini et al., 1996). The strait and surrounding areas show the highest seismic activity in the central Mediterranean.
This strait exhibits the effects of intense Quaternary tectonics mainly represented by a huge regional uplift beginning 0.6 Ma (Westaway, 1993; Tortorici et al., 1995) and by normal faulting consistent with the regional WNW-ESE oriented extension (Catalano et al., 2008). This area is largely affected by intense seismic activity, including large earthquakes that are both crustal (D<35 km) and subcrustal (>35km) in origin. The distribution of recorded crustal seismicity, including major earthquakes (M = 6), are in the hanging wall of the different Quaternary normal fault segments. Many important seismic sequences struck this region, including the southern Calabria region earthquake (1783, M = 5.6 - 7.1), Capo Vaticano Peninsula earthquake (1905, M = 7.0), Messina Reggio Calabria earthquake (1908, M = 7.1), with a number of smaller events in the Strait of Messina (1975, M = 4.7), in Gulf of Patti (1978, M = 5.6) and in southeastern Sicily (1990, M = 5.4) (Monaco and Tortorici, 2000).
Figure 1. Schematic map of Messina Strait

Schematic map of the Strait of Messina showing different faults detected by various authors. The inset map shows location of the Strait of Messina in Italy.
Messina Fault
According to Valensise and Pentosti, (1992) also Bonini et al. (in prep) the most probable source of the Messina earthquake (1908) is on a low angle blind normal fault that started from 3 km beneath the earth surface and extending to around 12 km depth with 30° dipping in SE direction. The total length of fault is 20 km along the dip and 40 km along the strike of the fault plane. The slip rate of the entire fault plane is 1.42 m (Bonini et al., in prep).
Experiment set up
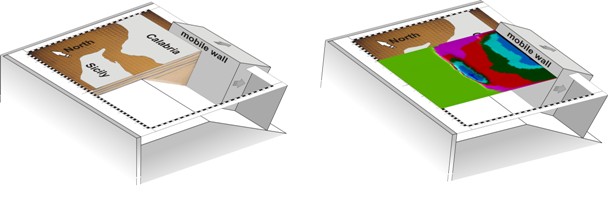
An 80cm wide and 43cm long sandbox was used to reproduce the setting described above. Quartz sand and glass microbeads are the two granular materials used to model this context. To reproduce the geomechanical features of the fault rocks, we used glass microbeads because of their very low internal friction angle (300-400 mm; F=24°). Due to their high sphericity and roundness (Schellart, 2000) they act as detachment levels and simulate rocks such as clay and shales. A well-rounded, spherical material is better suited to model the brittle behavior of rocks in crustal- and lithospheric-scale sand models than less well-rounded material, since it has a less cohesion and a coefficient of internal friction closer to values of natural rocks (Schellart, 2000). Quartz sand (100-300 mm; F=34°) has negligible cohesive strength and deforms according to Navier-Coulomb failure. Different colours of quartz sand have been used to represent different lithological units and also to highlight faults and displacements in the internal sections at the end of the experiment. The scale of the model is 1:100000, so that 1cm in model represented approximatively 1 km in nature. Animation 1 and Figure 2 illustrate the complete experimental setup and show some images of the internal sections (sections are 2cm spaced in all models). (Animations are available only in the online electronic version.)
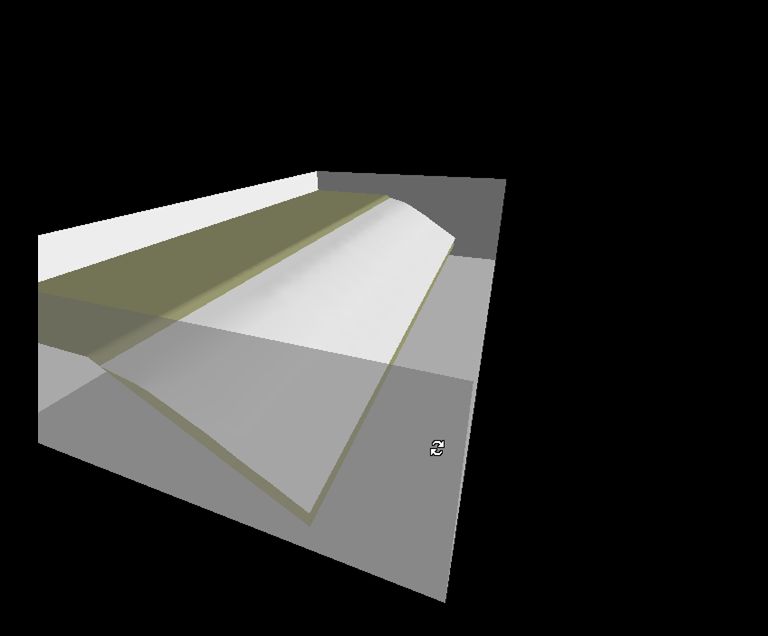
Figure 2. 3D model of sandbox experiment
3D model of sandbox experiment with topographic surface showing the position of central graben with respect to fault plane. Mobile wall is moving outside in different stages (0.5, 2.0, 3.5cm extension along the fault plane) of experiment.
Animation A-1. Experiment setup
The complete experimental setup including 30° fault plane, microbeads layer and different colours of sand for various lithounits. This movie also shows some of the internal sections at 2cm intervals.