Geochemistry
Sampling and Analytical Methods
Eighty one samples encompassing all the lithounits of the Baghmara Formation and the Arjuni Formation were collected as a part of a pilot project on tectonomagmatic evolution of the greenstone belts of the Bastar craton, central Indian shield. In this paper, we present the high precision geochemical data of the mafic and the felsic volcanic rocks of the Baghmara Formation. Samples were collected from exposures throughout the area based on accessibility, soil and forest cover. Utmost care was taken to collect fresh samples from unweathered exposures free from veins and amygdules. Locations of important sample collection sites are shown in Fig. 2. After careful petrographic evaluation for alteration, a total of 15 samples were selected for geochemical analysis. The selected samples include: 07 samples of Lower Unit basalt, 03 samples of Upper Unit Basalt and 05 samples of Felsic Volcanics (Table 2).
Table 2. Major (wt%) and trace element (ppm) data of the volcanic rocks of the Baghmara Formation of the Sonakhan Group
| Lower Unit Basalt | Upper Unit Basalts | Acid Volcanics | ||||||||||||||
|---|---|---|---|---|---|---|---|---|---|---|---|---|---|---|---|---|
| Sample No. | S-709 | S-710 | S-711 | S-712 | S-713 | S-714 | P-733 | S-758 | S-762 | S-763 | J-717 | J-718 | J-719 | A-736 | A-737 | |
| SiO2 | 49.44 | 50.24 | 51.94 | 49.98 | 47.67 | 50.22 | 48.93 | SiO2 | 51.72 | 69.39 | 57.8 | 69.96 | 70.02 | 65.73 | 53.25 | 58.94 |
| TiO2 | 1.07 | 0.83 | 0.97 | 1.05 | 1.27 | 1.16 | 1.07 | TiO2 | 0.79 | 0.56 | 0.61 | 0.34 | 0.33 | 0.31 | 1.17 | 1.74 |
| Al2O3 | 12.81 | 13.77 | 11.79 | 13.86 | 13.17 | 13.48 | 13.36 | Al2O3 | 14.94 | 15.92 | 13.9 | 15.86 | 15.37 | 17.28 | 16.31 | 19.44 |
| Fe2O3(T) | 14.23 | 12.73 | 12.86 | 13.74 | 16.15 | 13.82 | 14.84 | Fe2O3(T) | 6.93 | 3.18 | 7.52 | 3.18 | 3.17 | 3.97 | 15.92 | 8.84 |
| MnO | 0.19 | 0.18 | 0.21 | 0.2 | 0.2 | 0.21 | 0.18 | MnO | 0.11 | 0.02 | 0.1 | 0.01 | 0.03 | 0.03 | 0.18 | 0.07 |
| MgO | 7.11 | 7.74 | 7.39 | 6.84 | 7.98 | 7.06 | 7.59 | MgO | 3.61 | 1.19 | 6.62 | 0.66 | 0.8 | 0.82 | 6.51 | 1.9 |
| CaO | 11.84 | 12.12 | 11.68 | 10.31 | 10.59 | 10.56 | 11.14 | CaO | 8.87 | 1.17 | 5.18 | 0.58 | 2.26 | 1.81 | 0.61 | 0.64 |
| K2O | 0.15 | 0.1 | 0.17 | 0.43 | 0.31 | 0.69 | 0.18 | K2O | 1.27 | 5.05 | 2.51 | 3.39 | 3.22 | 3.51 | 0.74 | 1.21 |
| Na2O | 1.92 | 2.03 | 2.39 | 3.22 | 1.63 | 2.87 | 1.86 | Na2O | 3.22 | 1.25 | 3.38 | 3.69 | 3.47 | 3.52 | 1.07 | 1.88 |
| P2O5 | 0.1 | 0.06 | 0.08 | 0.09 | 0.11 | 0.11 | 0.12 | P2O5 | 0.11 | 0.19 | 0.21 | 0.09 | 0.1 | 0.08 | 0.05 | 0.1 |
| LOI | 2.04 | 1.08 | 1.79 | 1.67 | 1.56 | 1.04 | 1.87 | LOI | 8.82 | 2.89 | 3.01 | 3.78 | 3.01 | 2.78 | 5.78 | 4.42 |
| Total | 100.89 | 100.88 | 101.27 | 101.41 | 100.65 | 101.23 | 101.14 | Total | 100.39 | 100.82 | 100.84 | 101.54 | 101.77 | 99.85 | 101.59 | 99.19 |
| Cu | 103 | 92 | 49 | 121 | 203 | 64 | 61 | Cu | 53 | 10 | 35 | 0 | 0 | 0 | 2 | 2 |
| Zn | 68 | 46 | 63 | 79 | 66 | 80 | 65 | Zn | 40 | 35 | 56 | 16 | 16 | 15 | 23 | 22 |
| Pb | 13 | 146 | 12 | 13 | 69 | 67 | 11 | Pb | 161 | 74 | 24 | 50 | 127 | 65 | 114 | 49 |
| Ga | 15 | 14 | 11 | 17 | 16 | 15 | 16 | Ga | 15 | 21 | 18 | 22 | 23 | 23 | 17 | 21 |
| Cr | 283 | 391 | 272 | 471 | 170 | 144 | 296 | Cr | 211 | 42 | 326 | 3 | 2 | 2 | 24 | 16 |
| Co | 60 | 55 | 66 | 113 | 74 | 55 | 63 | Co | 34 | 7 | 32 | 11 | 12 | 11 | 64 | 42 |
| Ni | 109 | 151 | 135 | 171 | 101 | 97 | 138 | Ni | 95 | 14 | 104 | 2 | 1 | 1 | 10 | 6 |
| Rb | 3 | 3 | 4 | 13 | 11 | 12 | 4 | Rb | 37 | 240 | 84 | 105 | 96 | 107 | 20 | 35 |
| Sr | 102 | 118 | 156 | 156 | 139 | 140 | 122 | Sr | 413 | 74 | 527 | 272 | 343 | 383 | 69 | 85 |
| Cs | 0.25 | 0.41 | 0.09 | 0.31 | 0.28 | 0.27 | 0.14 | Cs | 3.11 | 4.73 | 1.33 | 4.39 | 3.16 | 4.41 | 0.52 | 0.69 |
| Ba | 108 | 185 | 139 | 166 | 143 | 299 | 131 | Ba | 531 | 1093 | 867 | 921 | 844 | 1044 | 289 | 302 |
| Sc | 43 | 46 | 41 | 44 | 45 | 39 | 38 | Sc | 25 | 11 | 15 | 3 | 4 | 3 | 30 | 23 |
| V | 291 | 281 | 283 | 309 | 316 | 271 | 292 | V | 143 | 37 | 114 | 14 | 15 | 16 | 114 | 128 |
| Ta | 0.26 | 0.32 | 0.46 | 0.43 | 0.47 | 0.17 | 0.34 | Ta | 0.27 | 1.29 | 0.6 | 0.89 | 0.89 | 0.62 | 0.33 | 0.51 |
| Nb | 3 | 2 | 3 | 3 | 4 | 3 | 4 | Nb | 3 | 22 | 9 | 6 | 6 | 6 | 2 | 3 |
| Zr | 11 | 20 | 10 | 35 | 37 | 23 | 16 | Zr | 106 | 364 | 192 | 95 | 104 | 99 | 23 | 52 |
| Hf | 1 | 1 | 1 | 1 | 1 | 1 | 1 | Hf | 3 | 9 | 4 | 3 | 3 | 3 | 1 | 2 |
| Th | 0.18 | 0.16 | 0.27 | 0.33 | 0.2 | 0.3 | 0.43 | Th | 4 | 26 | 8 | 12 | 12 | 11 | 0.47 | 0.63 |
| U | 0.07 | 0.05 | 0.1 | 0.1 | 0.36 | 0.09 | 0.1 | U | 1 | 6 | 2 | 2 | 2 | 9 | 0.26 | 0.35 |
| Y | 26 | 21 | 24 | 24 | 28 | 26 | 28 | Y | 14 | 47 | 18 | 10 | 10 | 10 | 9 | 13 |
| La | 3.4 | 2.5 | 3.6 | 4.4 | 4.1 | 4.6 | 4.4 | La | 23.2 | 88.9 | 47.1 | 47.5 | 48.4 | 37.7 | 2.8 | 7.3 |
| Ce | 8.5 | 6 | 8.5 | 9.9 | 9.3 | 10.6 | 10.3 | Ce | 39.9 | 144.3 | 79.6 | 85 | 86.4 | 67.5 | 6.7 | 14.6 |
| Pr | 1.3 | 0.9 | 1.3 | 1.4 | 1.5 | 1.5 | 1.5 | Pr | 4.4 | 14.8 | 8.5 | 8.6 | 8.7 | 6.8 | 1 | 2.3 |
| Nd | 8 | 5.6 | 7.4 | 8.5 | 9 | 9 | 8.9 | Nd | 19.7 | 61.7 | 37.3 | 30.8 | 31.2 | 24.7 | 4.9 | 11.4 |
| Sm | 2.5 | 1.9 | 2.3 | 2.6 | 2.9 | 2.7 | 2.9 | Sm | 3.7 | 10.9 | 6.3 | 4.4 | 4.5 | 3.6 | 1.4 | 2.8 |
| Eu | 0.9 | 0.7 | 0.7 | 1 | 1 | 1 | 1 | Eu | 1.1 | 2.1 | 1.7 | 1.2 | 1.1 | 1 | 0.5 | 0.7 |
| Gd | 3 | 2.2 | 2.8 | 2.9 | 3.3 | 3.1 | 3.2 | Gd | 3.2 | 10 | 5.4 | 3.4 | 3.5 | 2.9 | 1.2 | 2.1 |
| Tb | 0.5 | 0.4 | 0.5 | 0.5 | 0.6 | 0.5 | 0.6 | Tb | 0.4 | 1.3 | 0.6 | 0.4 | 0.4 | 0.3 | 0.2 | 0.3 |
| Dy | 3.9 | 3.1 | 3.6 | 3.6 | 4.3 | 3.9 | 4.2 | Dy | 2.2 | 7.6 | 3.1 | 1.9 | 1.9 | 1.7 | 1.7 | 2.3 |
| Ho | 0.9 | 0.7 | 0.8 | 0.8 | 0.9 | 0.9 | 0.9 | Ho | 0.5 | 1.5 | 0.6 | 0.2 | 0.2 | 0.2 | 0.2 | 0.3 |
| Er | 2.3 | 1.8 | 2.1 | 2.1 | 2.5 | 2.3 | 2.5 | Er | 1.2 | 3.9 | 1.5 | 0.6 | 0.6 | 0.6 | 0.6 | 0.9 |
| Tm | 0.3 | 0.2 | 0.3 | 0.3 | 0.3 | 0.3 | 0.3 | Tm | 0.2 | 0.5 | 0.2 | 0.1 | 0.1 | 0.1 | 0.1 | 0.1 |
| Yb | 1.7 | 1.4 | 1.5 | 1.5 | 1.8 | 1.7 | 1.8 | Yb | 0.9 | 2.6 | 1 | 0.6 | 0.7 | 0.7 | 1 | 1.4 |
| Lu | 0.4 | 0.3 | 0.3 | 0.3 | 0.4 | 0.4 | 0.4 | Lu | 0.2 | 0.6 | 0.2 | 0.1 | 0.1 | 0.1 | 0.2 | 0.2 |
| (Nb/Th)pm | 2 | 1.6 | 1.5 | 1.1 | 2.2 | 1.2 | 1 | (Nb/Th)pm | 0.1 | 0.1 | 0.1 | 0.1 | 0.1 | 0.1 | 0.5 | 0.6 |
| (La/Th)pm | 2.3 | 1.9 | 1.7 | 1.6 | 2.5 | 1.9 | 1.3 | (La/Th)pm | 0.8 | 0.4 | 0.7 | 0.5 | 0.5 | 0.4 | 0.7 | 1.4 |
| La/Nb)pm | 1.1 | 1.2 | 1.1 | 1.4 | 1.1 | 1.5 | 1.3 | La/Nb)pm | 9.5 | 4.2 | 5.7 | 7.7 | 7.9 | 6.5 | 1.4 | 2.4 |
| (La/Yb)cn | 1.5 | 1.4 | 1.7 | 2.1 | 1.6 | 1.9 | 1.7 | (La/Yb)cn | 18.4 | 24.3 | 35.3 | 54.5 | 50.4 | 39.1 | 2 | 3.6 |
| (La/Sm)cn | 0.9 | 0.8 | 1 | 1.1 | 0.9 | 1.1 | 1 | (La/Sm)cn | 4.1 | 5.3 | 4.8 | 7 | 6.9 | 6.8 | 1.3 | 1.7 |
| (Gd/Yb)cn | 1.5 | 1.3 | 1.5 | 1.6 | 1.5 | 1.5 | 1.5 | (Gd/Yb)cn | 2.9 | 3.2 | 4.7 | 4.5 | 4.2 | 3.4 | 1 | 1.2 |
| Nb/Yb | 1.9 | 1.6 | 2.1 | 2.1 | 2.1 | 1.8 | 1.9 | Nb/Yb | 2.8 | 8.3 | 9 | 10.3 | 9.2 | 8.8 | 2.1 | 2.2 |
| Ta/Yb | 0.2 | 0.2 | 0.3 | 0.3 | 0.3 | 0.1 | 0.2 | Ta/Yb | 0.3 | 0.5 | 0.6 | 1.4 | 1.3 | 0.9 | 0.3 | 0.4 |
| Nb/Ta | 11.8 | 6.6 | 7.2 | 7.4 | 7.9 | 18.6 | 10.5 | Nb/Ta | 9.5 | 16.9 | 14.4 | 7.2 | 7.2 | 9.7 | 6.5 | 6.1 |
| Y/Ho | 30.7 | 31.2 | 30.2 | 31.1 | 29.9 | 30.3 | 29.5 | Y/Ho | 28.8 | 31 | 31.8 | 53.8 | 53.1 | 54 | 46 | 48 |
| Zr/Y | 0.4 | 1 | 0.4 | 1.4 | 1.3 | 0.9 | 0.6 | Zr/Y | 7.9 | 7.8 | 10.5 | 9.6 | 10.5 | 10.4 | 2.6 | 4 |
| Ti/Zr | 5597 | 2331 | 5276 | 1688 | 1925 | 2848 | 3700 | Ti/Zr | 415 | 85 | 178 | 202 | 177 | 173 | 2858 | 1889 |
| Nb/Y | 0.1 | 0.1 | 0.1 | 0.1 | 0.1 | 0.1 | 0.1 | Nb/Y | 0.2 | 0.5 | 0.5 | 0.6 | 0.6 | 0.6 | 0.2 | 0.2 |
| (Zr/Sm)pm | 0.2 | 0.4 | 0.2 | 0.5 | 0.5 | 0.3 | 0.2 | (Zr/Sm)pm | 1.2 | 1.3 | 1.2 | 0.9 | 0.9 | 1.1 | 0.7 | 0.7 |
| (Ti/Sm)pm | 0.9 | 0.9 | 0.9 | 0.8 | 0.9 | 0.9 | 0.8 | (Ti/Sm)pm | 0.4 | 0.1 | 0.2 | 0.2 | 0.1 | 0.2 | 1.7 | 1.3 |
| (Eu/Eu*) | 1 | 1.1 | 0.8 | 1.1 | 1 | 1 | 1 | (Eu/Eu*) | 1 | 0.6 | 0.9 | 0.9 | 0.9 | 1 | 1.1 | 0.9 |
| Nb/Nb* | 1.4 | 1.2 | 1.2 | 1 | 1.5 | 1 | 0.9 | Nb/Nb* | 0.1 | 0.2 | 0.2 | 0.1 | 0.1 | 0.1 | 0.7 | 0.5 |
| Zr/Hf | 15.3 | 28.3 | 17.3 | 30.4 | 25.8 | 23.2 | 20.8 | Zr/Hf | 41.1 | 41.8 | 43.4 | 33.1 | 33.6 | 32 | 31.1 | 34.4 |
| (Nb/La)pm | 0.9 | 0.8 | 0.9 | 0.7 | 0.9 | 0.6 | 0.8 | (Nb/La)pm | 0.1 | 0.2 | 0.2 | 0.1 | 0.1 | 0.2 | 0.7 | 0.4 |
| Nb/Y | 0.1 | 0.1 | 0.1 | 0.1 | 0.1 | 0.1 | 0.1 | Nb/Y | 0.2 | 0.5 | 0.5 | 0.6 | 0.6 | 0.6 | 0.2 | 0.2 |
| Nb/U | 46.4 | 42.9 | 34.6 | 32.8 | 10.3 | 34.3 | 34.8 | Nb/U | 2.5 | 3.3 | 3.8 | 3 | 2.8 | 0.7 | 8.5 | 8.8 |
| Nb/Th | 17.1 | 13.2 | 12.4 | 9.6 | 18.6 | 10.4 | 8.3 | Nb/Th | 0.7 | 0.8 | 1.1 | 0.5 | 0.5 | 0.6 | 4.6 | 5 |
| Nb/La | 0.9 | 0.8 | 0.9 | 0.7 | 0.9 | 0.7 | 0.8 | Nb/La | 0.1 | 0.2 | 0.2 | 0.1 | 0.1 | 0.2 | 0.8 | 0.4 |
Approximately 1 kg of each rock sample was crushed to ~2 mm size chips and about 50 g split of each sample was pulverized to -200 mesh fine powder in an agate mill. Major elements were analyzed by SIEMENS SRS 3000 sequential X-Ray Fluorescence (XRF) Spectrometer on fused discs glued with polyvinyl alcohol at the Wadia Institute of Himalayan Geology, Dehra Dun, whereas trace elements, including rare earth elements, were analyzed at the National Geophysical Research Institute, Hyderabad by inductively coupled plasma mass spectrometer (ICP-MS, Perkin Elmer SCIEXELAN DRC II). The samples were fused with LiBO2 followed by treatment with HNO3 and further dilution of dissolved bead solution to 250 ml to reduce the total dissolved solids to less than 0.12% in fluid solution as proposed by Roy et al. (2007). The analytical accuracy of the major oxide data is <5% and the average precision is always better than 1.5 %. The precisions achieved for ICP-MS analyses were <5% RSD with comparable levels of accuracy. International standards were used for calibration and testing of accuracy. The geochemical data are presented in Table 2.
Assessment of alteration and element mobility
Only those samples were selected for geochemical analysis, which show the least alterations. Important chemical modifications that generally take place in subaqueous spilitization process, deuteric alteration and greenschist facies metamorphism include: high loss on ignition (LOI) values, scatter and inconsistency of major element data. The studied samples have low LOI (mostly < 3 wt%), except for a few which show slightly high LOI values. In addition to low LOI for the most of the samples, the most of the major elements and trace elements including large ion lithophile elements (LILE), high field strength elements (HFSE) and rare earth elements (REE) exhibit coherent intra- and inter-sample behaviour of the samples. However, the significant variations in some major elements, notably Na2O, K2O, SiO2 and LOI may be due to alteration. There are no erratic or spurious anomalies in the REE patterns of the samples. These observations suggest that elemental variations in the samples reflect primary igneous processes. Nevertheless, our petrogenic interpretations of the rocks heavily rely on immobile trace elements.
Major and trace element variations
Lower Unit Basalts
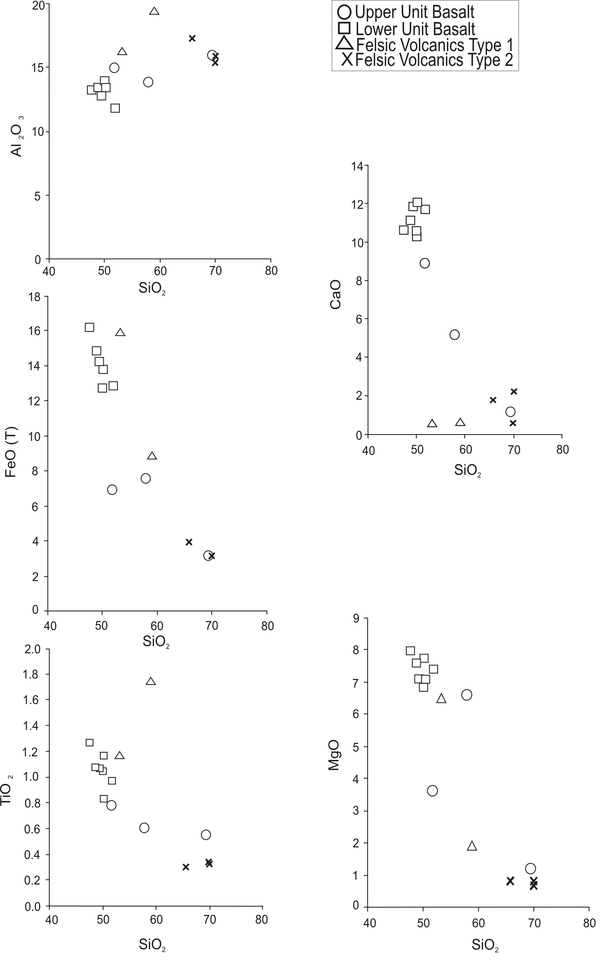
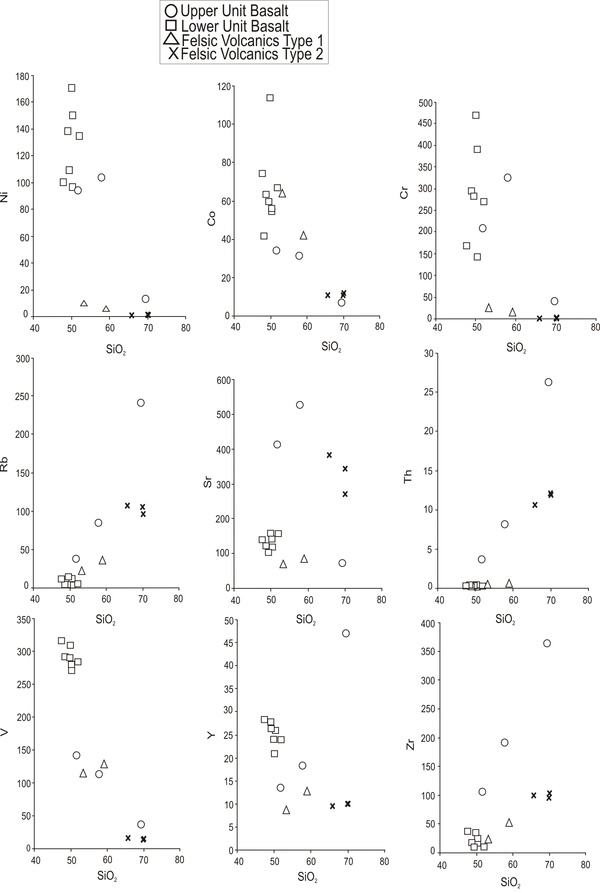
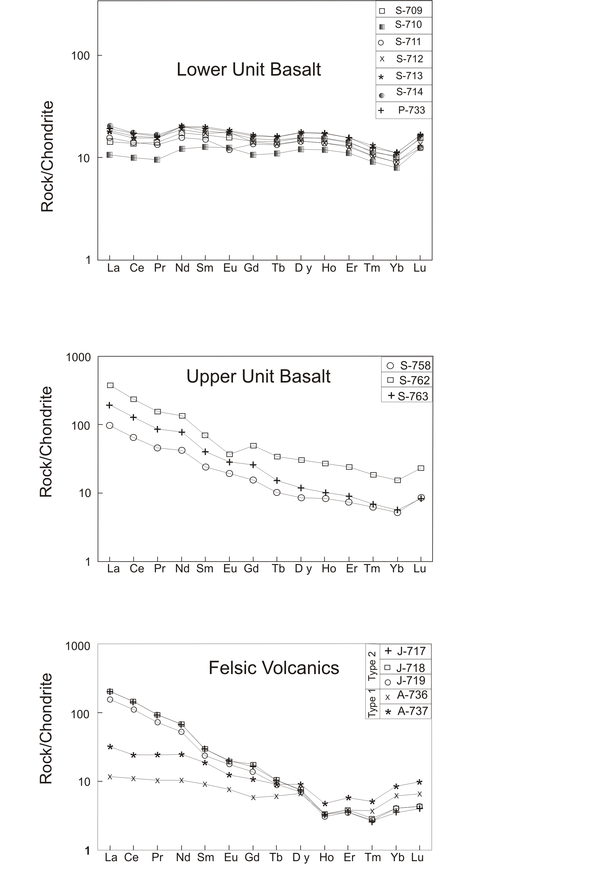
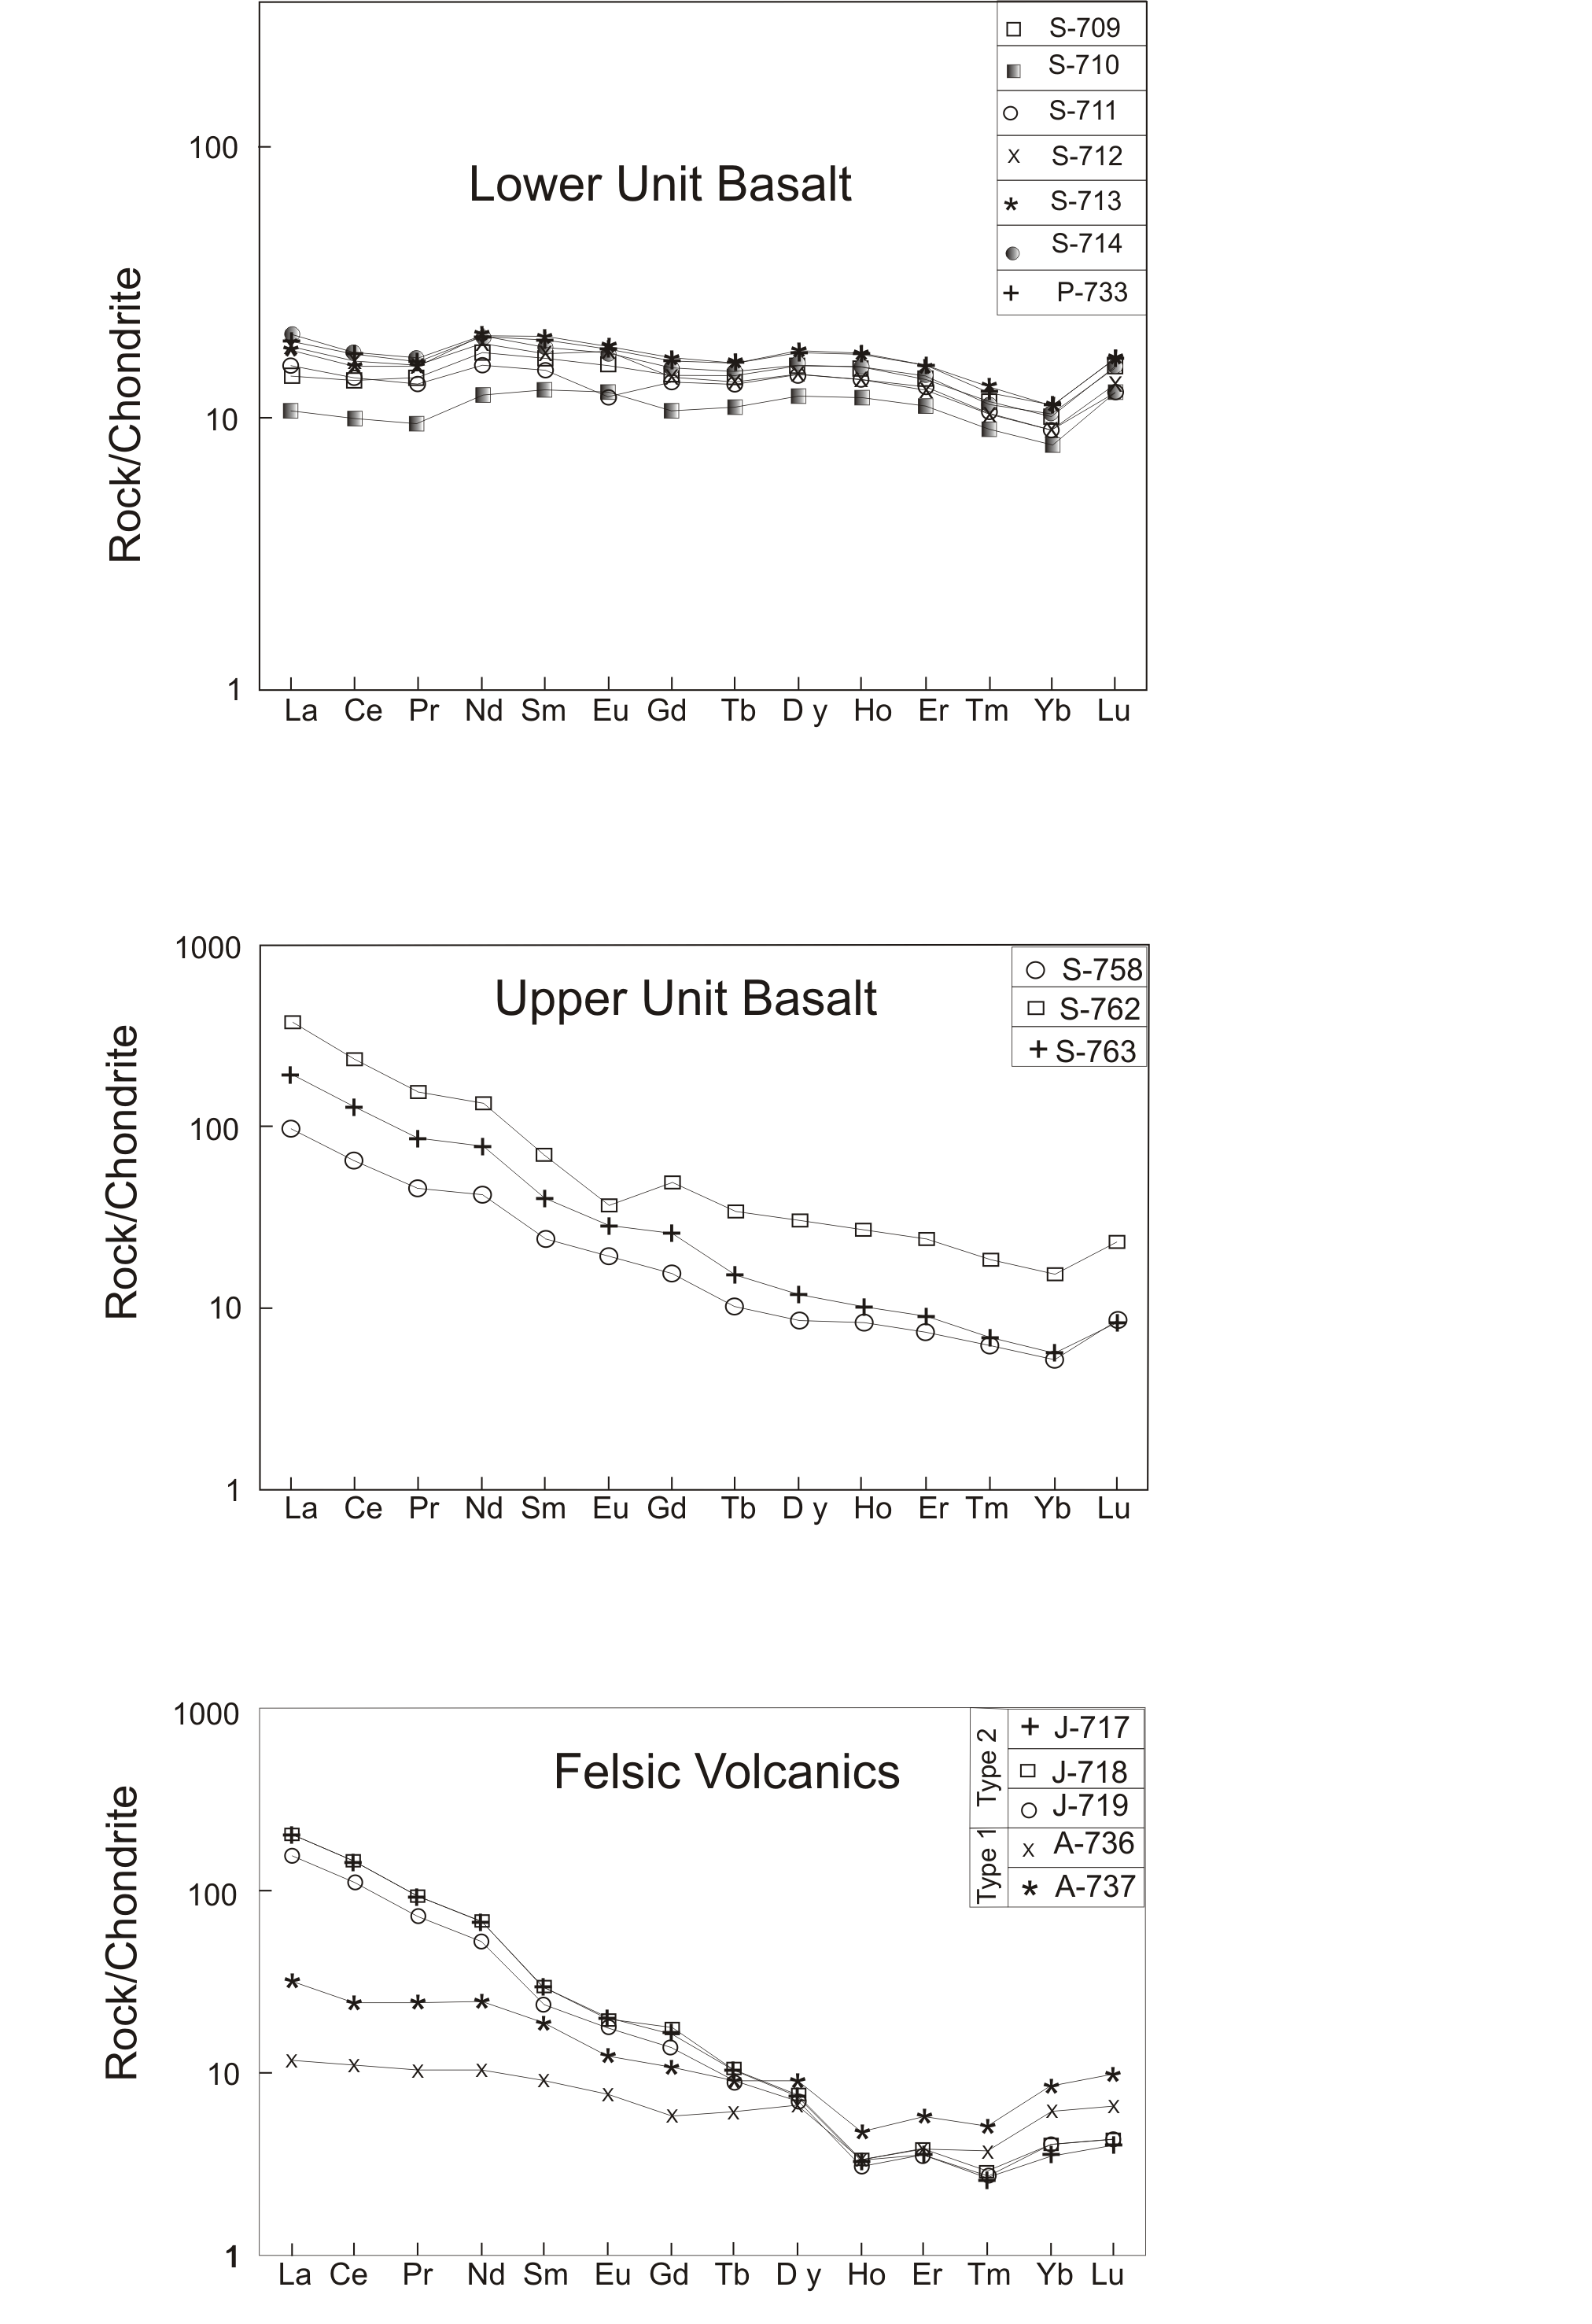
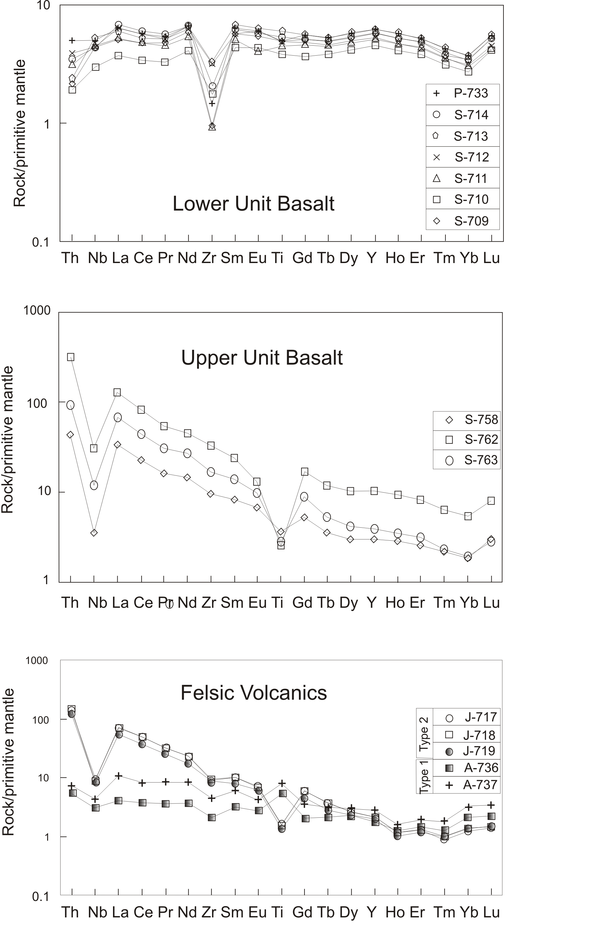
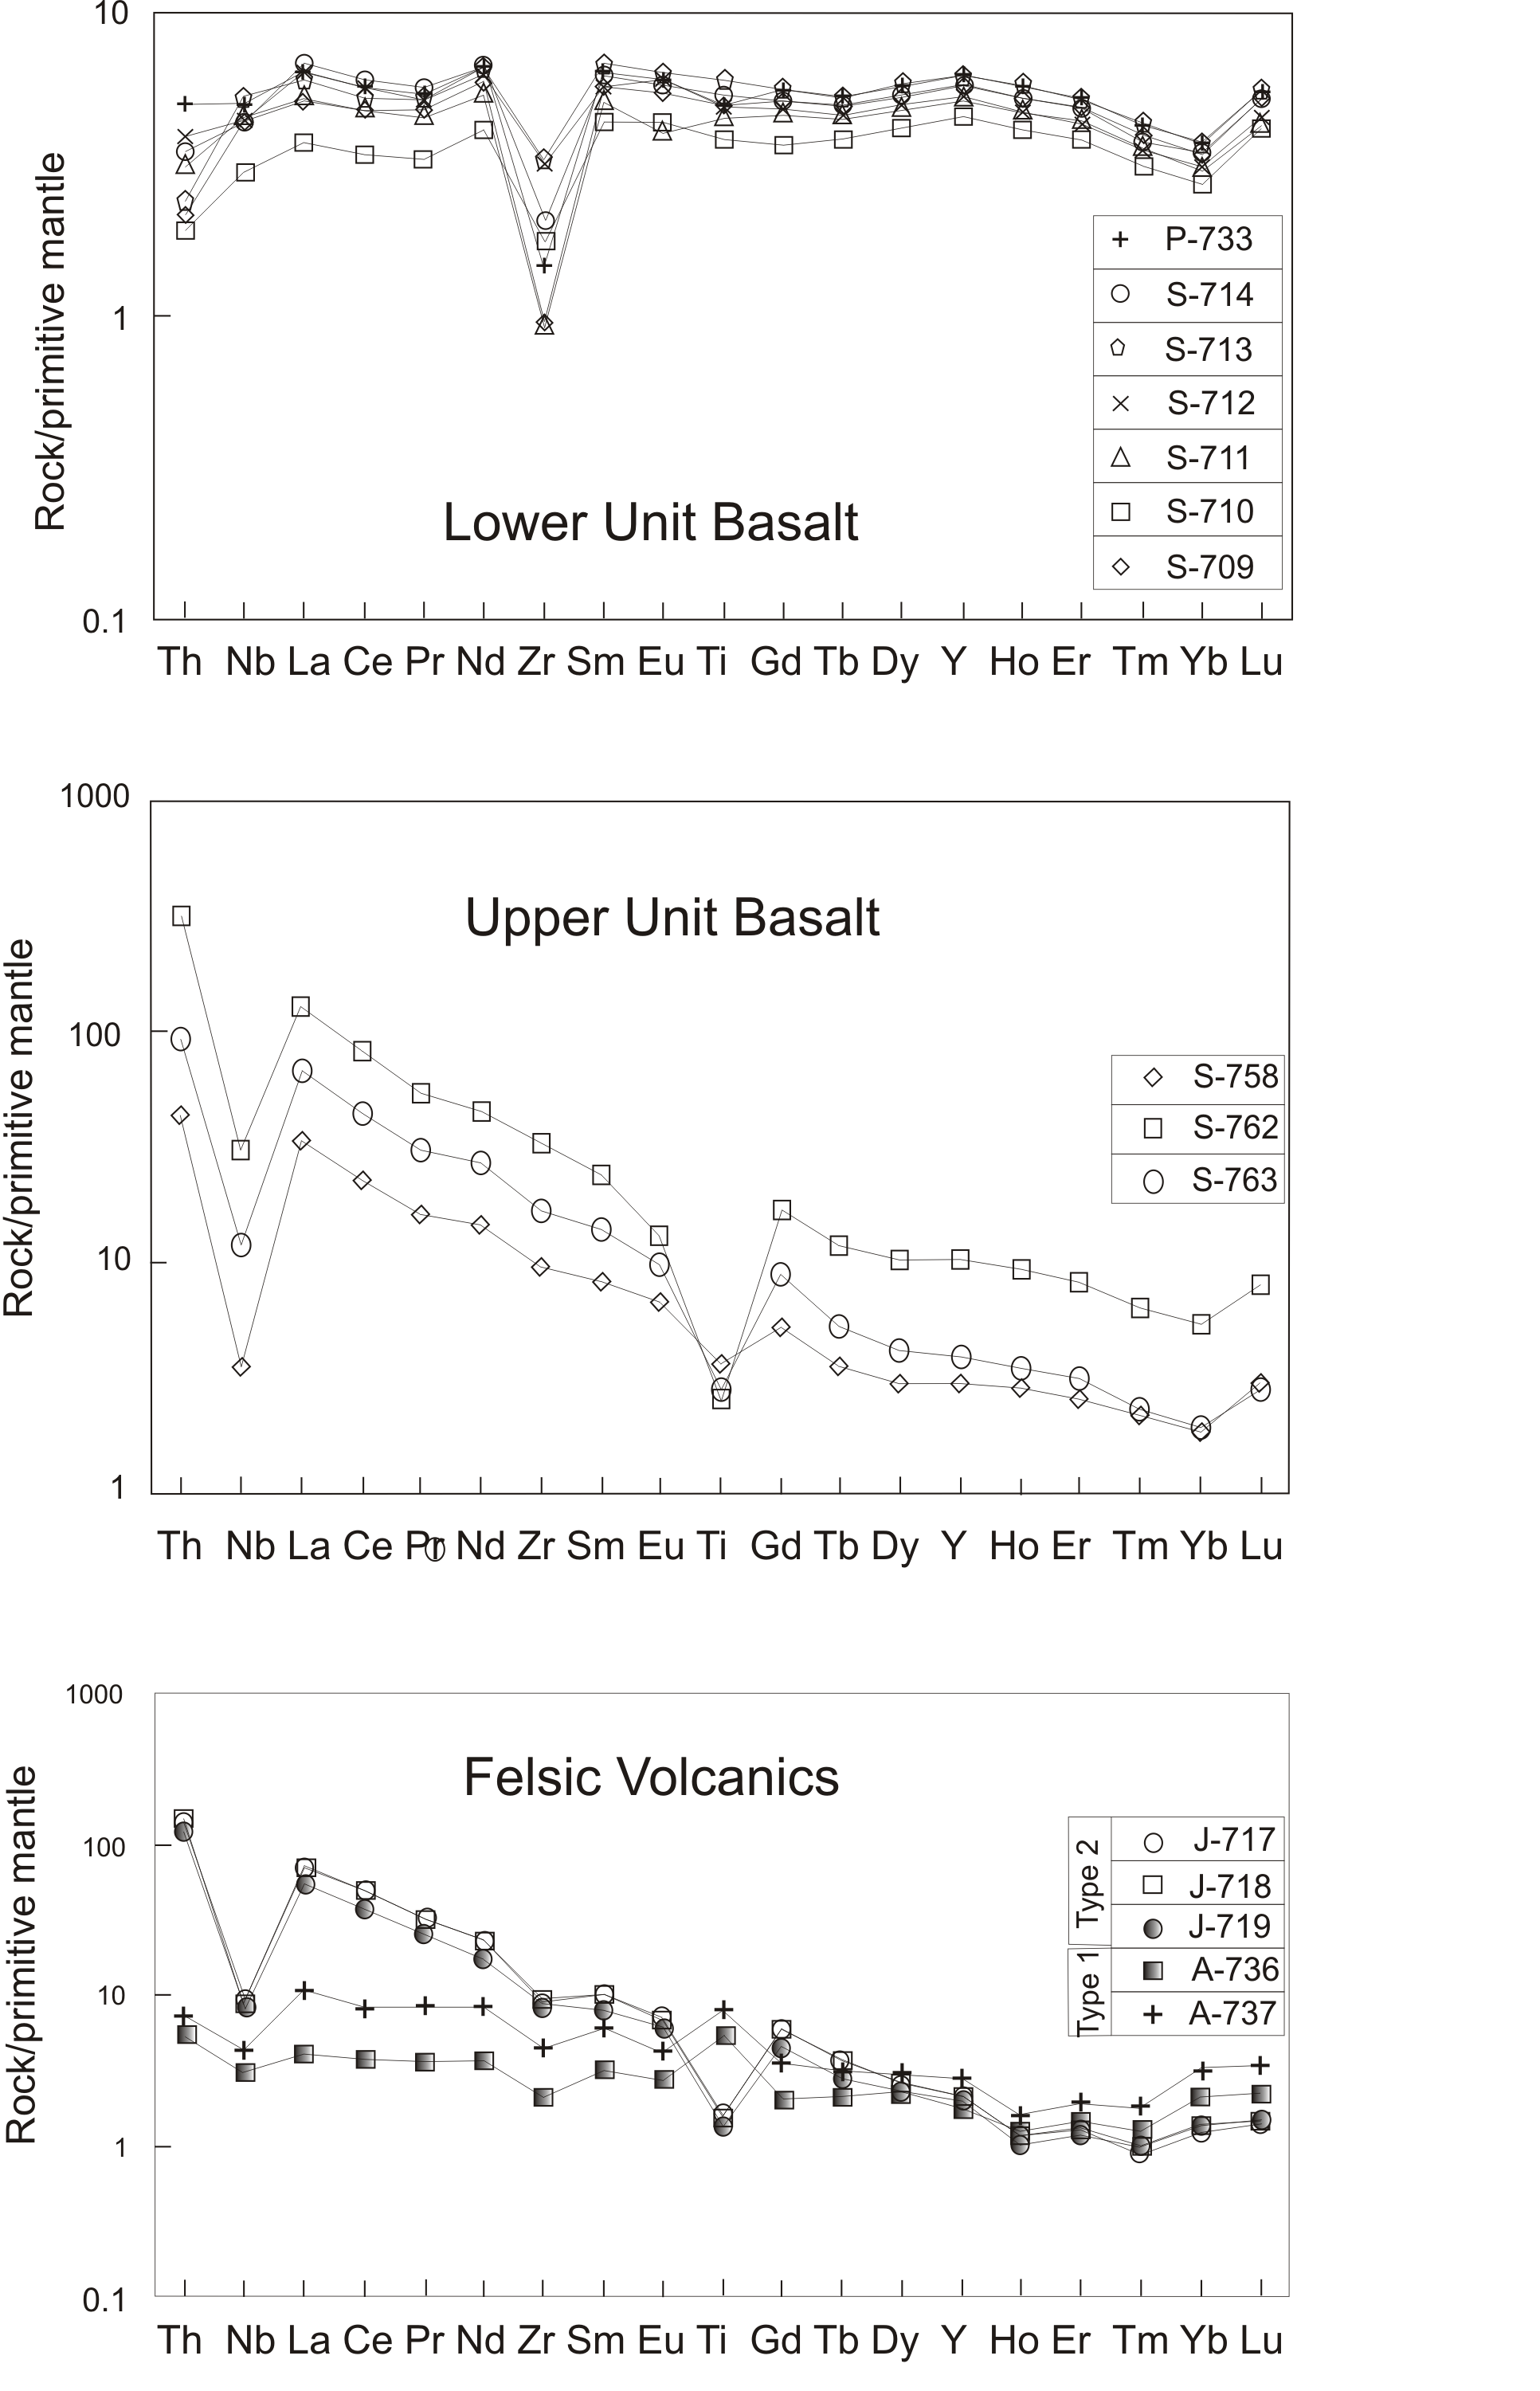
The basalts from the lower part of the Baghmara Formation plot in the subalkaline basalt field (Fig. 5) on the immobile trace elements based discrimination diagram of Winchester and Floyd (1977). They are characterized by 47.67 to 51.94 wt% SiO2, 6.84 to 7.98 wt% MgO, 12.73 to 16.15 wt% Fe2O3(T), 11.79 to 13.86 wt% Al2O3, 0.83 to 1.27 wt% TiO2 and 10.31 to 12.12 wt% CaO (Fig. 6, Table 2). They have lower concentrations of Ni (97- 171 ppm, mean 129 ppm) and Cr (144-471 ppm, mean 289 ppm) (Fig. 7, Table 2) compared to N-MORB (Hofmann, 2004). These values are too low for magmas that have equilibrated with peridotite mantle (Roeder and Emsile, 1970). Thus, the lower unit basalts appear to have undergone fractionation. They possess sub-chondritic Nb/Ta values (6.62 – 18.62) except for one sample (S-714) which has super-chondritic Nb/Ta value of 18.62 (chondritic values after Sun and McDonough, 1989). Ti/Zr ratios of these samples are consistently higher (1687-5597) than the chondritic value (111.98). The ratios of Zr/Y and Zr/Hf range from 0.41 to 1.45 and 15.34 to 30.43, respectively which are less than those of chondrite (2.46 and 36 respectively). On the chondrite-normalized diagram (Sun and McDonough, 1989) (Fig. 8), the lower unit basalts exhibit near-flat REE pattern. On the primordial mantle-normalized multi-element diagram (Sun and McDonough, 1989) (Fig. 9), the samples show N-MORB like La-Nb-Th patterns having ratios of (La/Nb)pm = 1.14 – 1.56; (La/Th)pm = 1.28 – 2.54; (Nb/Th)pm = 0.99- 2.22). They also show depletion of Ti relative to middle rare earth elements (MREE) having ratios of (Ti/Sm)pm = 0.77 – 0.89). Some important trace element characteristic features of the lower unit basalts are their Nb-anomalies which are either zero-anomalies or positive-anomalies (Nb/Nb* = 0.93 – 1.48). All these geochemical features along with pillow structures are consistent with oceanic plateau basalts which are generated by a rising mantle plume (Sandeman et al., 2006; Van Boening and Nabelek, 2008).
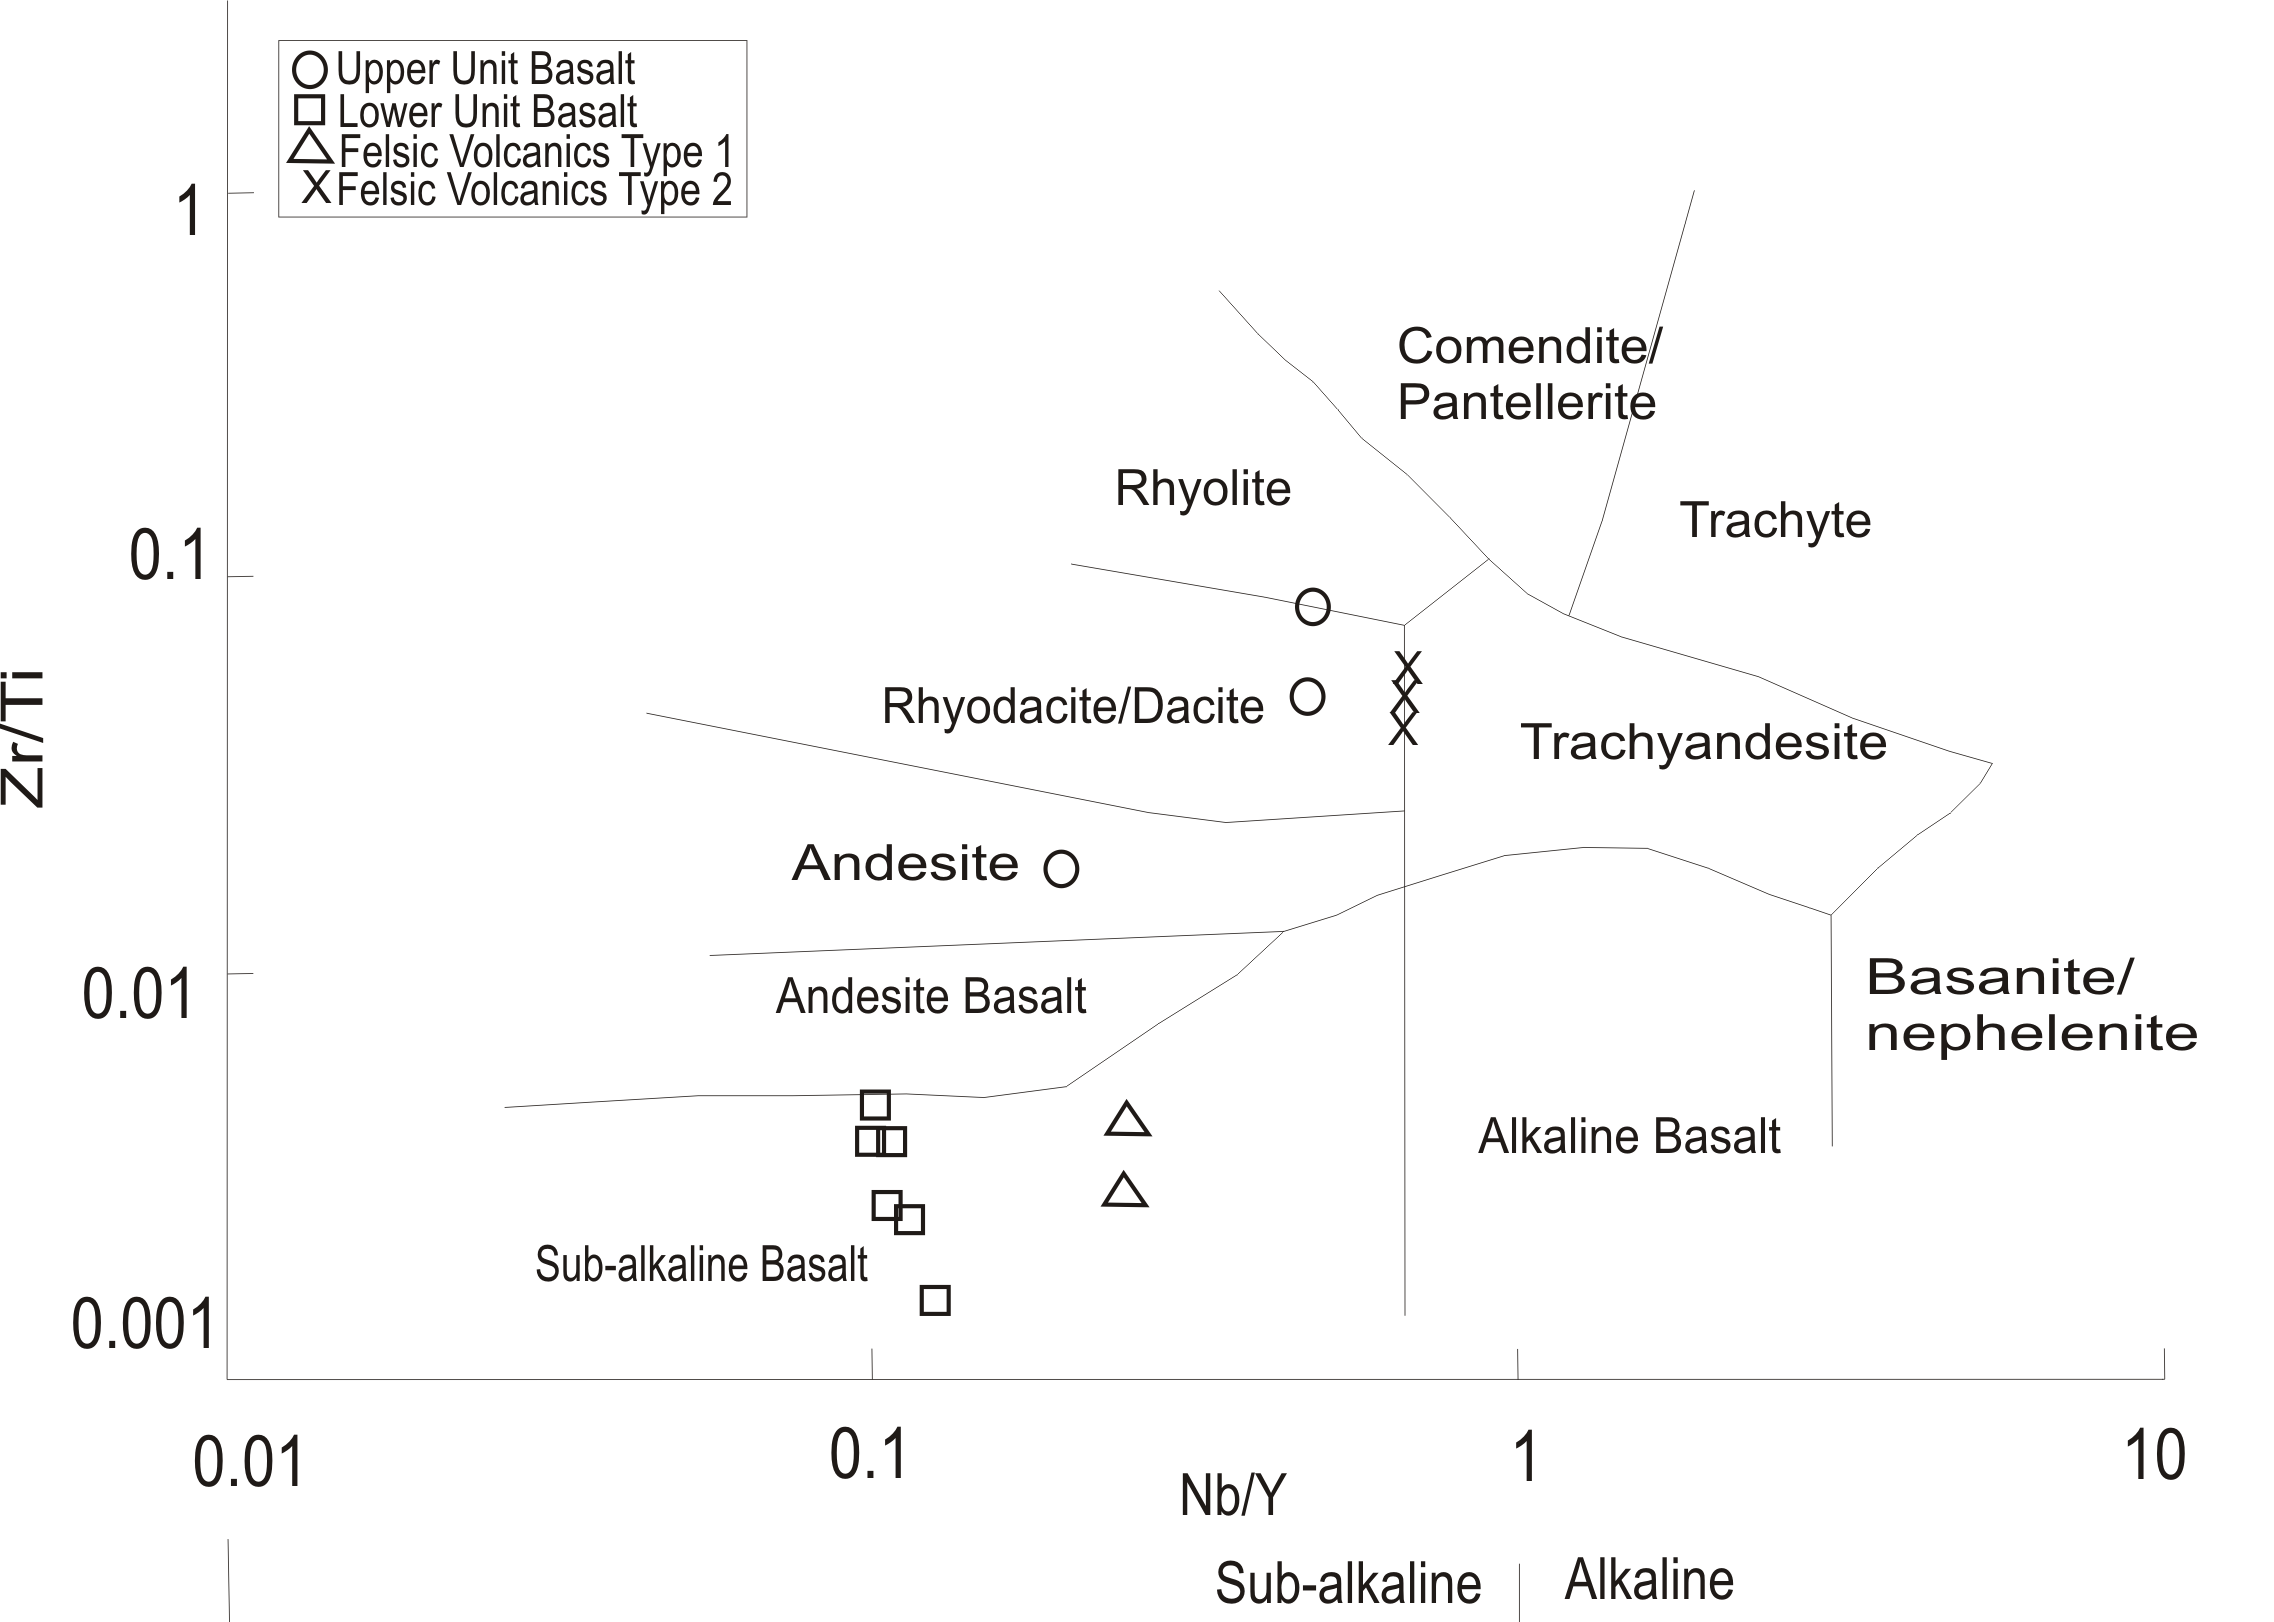
Figure 5. Nb/Y vs. Zr/Ti classification diagram

Nb/Y vs. Zr/Ti classification diagram (Winchester and Floyd, 1977) of the volcanic rocks of the Baghmara Formation.
Figure 6. SiO2 vs. TiO2, Fe2O3(T), Al2O3, MgO and CaO variation diagram
SiO2 vs. TiO2, Fe2O3(T), Al2O3, MgO and CaO variation diagram of different litho-units of the Sonakhan Greenstone belt.
Figure 7. SiO2 vs. V, Rb, Ni, Y, Sr, Co, Zr, Th and Cr variation diagram
SiO2 vs. V, Rb, Ni, Y, Sr, Co, Zr, Th and Cr variation diagram of different litho-units of the Sonakhan Greenstone belt.
Figure 8. Chondrite-normalized REE patterns
Chondrite-normalized (Sun and McDonough, 1989) REE patterns of the volcanic rocks of the Baghmara Formation.
Figure 9. Primordial mantle-normalized multi-element patterns
Primordial mantle-normalized (Sun and McDonough, 1989) multi-element patterns of the volcanic rocks of the Baghmara Formation.
Upper Unit Basalts
The upper unit basalts of the Baghmara Formation of the Sonakhan Group are subalkaline basalts ranging in composition from andesite through dacite to rhyolite (Fig. 5). These basalts are characterized by 51.72 – 69.39 % SiO2, 0.56 – 0.79% TiO2, 1.19 – 6.62% MgO, 13.90 – 15.92% Al2O3 and 3.18 – 7.52% Fe2O3(T) (Table 2, Fig. 6). There are large variations in Ni (13 - 104 ppm), Cr (42-326), V (37- 143 ppm), Zr (106- 364 ppm), Co (13 – 104 ppm) and Y (13 – 47 ppm) (Table 2, Fig. 7). The ratios of Ti/Zr (85 – 414) are sub- to super-chondritic, whereas Zr/Y ratios (8- 10) are always super-cohondritic. In addition, they have the following trace element characteristics: highly fractionated REE patterns having (La/Yb)cn = 18.39 to 35.27, (La/Sm)cn = 4.1 – 5.29, (Gd/Yb)cn = 2.89 – 4.66); minor negative to no Eu-anomalies (Eu/Eu* = 0.62 – 1.02) and large negative Nb-anomalies [(Nb/Th)pm = 0.08 – 0.13; (Nb/La)pm = 0.10 – 0.24] (Fig. 5 & 6, Table 2). Nb/Nb* of these basalts are always very low (Nb/Nb* <0.16). These features are closely similar to those of subduction related island arc basalts (Polat et al, 2005; Polat and Hofmann, 2003). Since the upper unit basalts are enriched in LILE and LREE, and depleted in HFSE, particularly in Nb, Ta and Ti on the normalized trace element diagrams, it is proposed that they represent typical island arc lavas.
Felsic Volcanic Rocks
The felsic volcanic rocks of the Baghmara Formation of the Sonakhan Group are characterized by 53.25 – 70.02% SiO2, 0.31 – 1.74% TiO2, 0.66 – 6.51% MgO, 15.37 – 19.44% Al2O3, 3.17 – 15.92% Fe2O3(T) (Table 2, Fig. 6). Compared to the upper unit basalts, these felsic volcanics are depleted in Ni (1 - 10 ppm), Cr (2-24 ppm) and Zr (23- 104 ppm) but comparable in V contents (14- 128 ppm) (Table 2, Fig. 7). The ratios of Ti/Zr (85 – 414) are sub- to super-chondritic, whereas Zr/Y ratios (8- 10) are always super-cohondritic. In addition, they have the following trace element characteristics: moderately to highly fractionated REE patterns having (La/Yb)cn = 1.97 to 54.55, (La/Sm)cn = 4.1 – 5.29, (Gd/Yb)cn = 2.89 – 4.66; minor negative Eu-anomalies (Eu/Eu* = 0.62 – 1.02) and large negative Nb anomalies [(Nb/Th)pm = 0.08 – 0.13; (Nb/La)pm = 0.10 – 0.24] (Fig. 8 & 9, Table 2). Like the upper unit basalts, the felsic volcanics also exhibit low values of Nb/Nb* (0.10 – 0.68). The felsic volcanics can be divided into two types based on multi-element patterns (Fig. 9): Type 1: samples with minor negative Nb-anomaly but positive Ti-anomaly and Type 2: samples with pronounced negative Nb- and Ti-anomalies. The patterns of type 1 rocks may be a fractionated product of plume-generated basaltic rocks, very much similar to those of the lower unit basalt. Multi-element patterns of the type 2 felsic rocks are fractionated and are very much similar to those of the upper unit basalt of island arc affinity.