When compared to the Australian continent as a whole, the Flinders Ranges in South Australia appears as a topographic high (ca. 1200 m) and a region of high seismicity (Figure 1a). In more detail it is apparent the Flinders Ranges are bounded by young faults (Figure 1b). Much of southeast Australia has historical record of earthquakes, but the Flinders Ranges has experienced a large concentration of activity over the past 150 years (e.g. Sandiford, 2003). Cummings et al. (2004) has estimated a reoccurrence interval in southeastern Australia for magnitude 6.0 or larger events as approximately 29 years.
Figure 1. Topography and distribution of Seismicity.
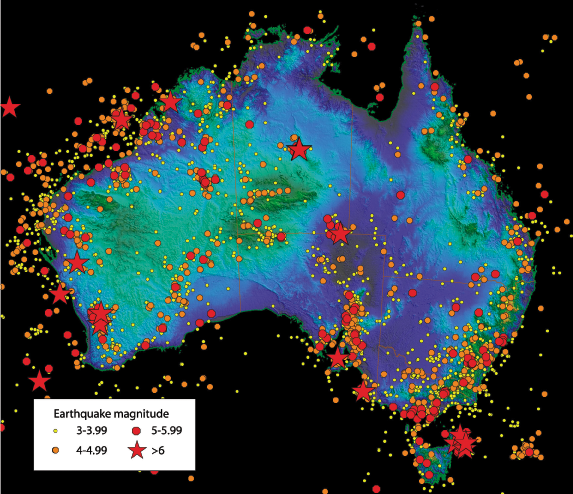
(a) Distribution of seismicity greater than 3 ML. Courtesy of Geoscience Australia.
(b) Shaded topographic relief map. Courtesy of Mike Sandiford.
The limited access and few number of permanent seismic stations in the area have been obstacles in understanding the geodynamics of the region, but the distribution of faults and significant Quaternary displacement help unravel the current tectonic regime. Sandiford (2003) has identified relatively large slip rates during the Quaternary and a dense network of faults indicating the pronounced neotectonic activity in the area. Active faulting has been identified by investigating range bounding scarps that have reverse angle slips rates of 20-150m/106 y (e.g. Sandiford, 2003) .
The lack of permanent seismic stations in the area makes the location of earthquake hypocenters in the area poorly constrained. Geoscience Australia recently deployed an array of temporary seismometers to assess earthquake hazard in South Australia and determine any relationship between the Quaternary faults found by Sandiford and colleagues and earthquake locations (e.g. Cummings et al., 2004). They recorded 194 events during a three month period in late 2003, which are shown in Figure 2 and 3 in Cummings et al. (2004). Events near Hawker were recorded by the temporary deployment, but not recorded by the permanent stations. The difference in depth between the northern and southern Flinders Ranges events are shown in Figure 3 of Cummings et al. (2004).
The largest earthquake recorded during experiment was the ML 3.9 (Ritcher scale) Hawker earthquake of 22 November, 2003. This earthquake was widely felt in the Hawker region and was recorded at 11 of the temporary stations (see Figure 4 in Cummings et al., 2004). Most significantly, the depth was determined to be 17km and the focal mechanism (see Figure 5 in Cummings et al., 2004) illustrated normal faulting. Although Sandiford (2003) describes reverse events from paleoseismology, such normal faulting events have occurred in the Flinders Ranges in the past, but their mechanisms and depths have been poorly constrained.
The data from this study is still being analysed but if it can be shown that the seismicity tends to cluster along faults, then neotectonic and paleoseismological studies focused on these active faults can help constrain the size and frequency of earthquakes in seismic hazard evaluation. There is a lot still unknown about the active seismicity in the region, but more temporary seismometer deployments are planned and with more data incoming, the active tectonics of the region will be more fully understood.