Several authors showed that deformation within strongly deformed ductile rocks (considered as deformable continuum medium) could be approximated as a steady state flow system (Ramberg, 1975; Passchier, 1988; Simpson & De Paor, 1993). In this case deformation could be decomposed in two components: stretching rate (which includes rates of volume changes) and vorticity (instantaneous rotation rate). The relationship between the contributions of vorticity and stretching rate to the flow is referred to as the degree of non-coaxiality which can be expressed in terms of a vorticity numbers (Wm=0 in pure shear and Wm=1 in simple shear). Studies of the degree of non-coaxiality are commonly referred to as vorticity analyses and several examples exist in geological literature (Passchier, 1988; Wallis, 1995; Xypolias & Koukouvelas, 2001; Carosi & Palmeri, 2002; Holcombe & Little, 2001; Law et al., 2004).
In order to unravel the kinematic processes acting during the D2 deformation history vorticity analyses, using two different methods, have been carried out in the study areas.
Analyses have been performed on pre/syn-D2 plagioclase crystals and weakly rigidly deformed garnets from the porphyroblastic paragneisses and micaschists of the Low- Medium Grade Metamorphic Complex. The two methods (Passchier, 1988; Wallis, 1995; Holcombe & Little, 2001) are based on the theoretical mathematical consideration of Jeffery (1922), and on their relative applications to ductile rocks in 2-D and 3-D system made respectively by Gosh & Ramberg (1976) and Passchier (1988). The porphyroblasts are considered as rigid bodies immersed in a matrix behaving as a general Newtonian steady state and homogenous flow. The vorticity vector is assumed to be oriented perpendicular to the maximum and minimum principal axes of finite strain inducing a fabric with a monoclinic symmetry. As stated both by Ramberg (1975), and Passchier (1988), such methods find an ideal application within mylonitic shear zones but a good field context could be represented by strongly deformed and sheared ductile rocks where no strong structural anisotropies (C-S or C' fabric) are observed. As rocks system are not homogeneous and not necessary steady state and the boundaries conditions assumed by all these methods permit us to have only an approximate kinematic description of the deformation history. This implies that the measured flow parameters can only broadly indicate the type of tectonic regime acting during the study deformation event analysed and the reliability of these results strongly depend on the sample chosen to perform the vorticity measurement. The two different techniques used here differ principally on the different parameter type that can be measured in order to define the vorticity number. The two methods employ data collected on sections cut perpendicular to the foliation and parallel to the stretching lineations.
This method is based on measuring the orientation of the long axis of rigid porphyroclasts with respect to the flow, the aspect ratio of rigid porphyroclasts rotating in an homogeneously deforming matrix and on finding a critical aspect ratio (Gosh & Ramberg, 1976; Passchier, 1988; Wallis, 1992) below which porphyroclasts continuously rotate until they achieve a stable orientation. This method assumes no mechanical interaction between the porphyroclasts and no slipping component along the matrix-clast contact. The flow system is considered to merge to the principal flow apophysis direction that could be well approximated by the recrystallized tails (Passchier, 1988) or by the flow matrix (Wallis, 1992). This method has been applied by Carosi & Palmeri, (2002), and Carosi et al., (2003) in the paragneiss and micaschist complexes cropping out respectively in the NE (Posada valley) and NW (Central-Northern Nurra) areas of axial zone using plagioclase and garnet porphyroclasts. The different vorticity values (Wm) estimates show the following results:
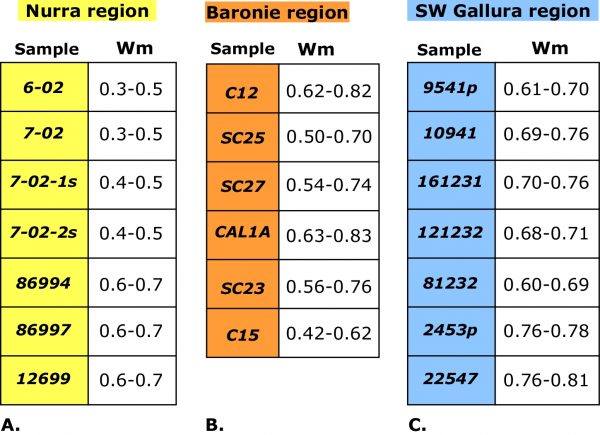
in the central part of Nurra, Wm shows mean value of 0.60-0.70 whereas in the northern area the mean value are in between 0.30-0.50 (Fig. 8a)
in the Posada valley, Wm varies from 0.52 to 0,73 (Fig. 8b)
in the SW Gallura region, Wm confirm the non-coaxial regime (with vorticity values of 0.60-0.75) of deformation with increasing simple shearing approaching the most strained areas (Carosi et al., 2005; Frassi, unpublished data).
Figure 8. Table of the mean vorticity number
Table of the mean vorticity number (Wm) measured in the Northern sector of the Sardinian Basement according to Method 1 (see text). a: Nurra region; b: Baronie region and c: SW Gallura region.
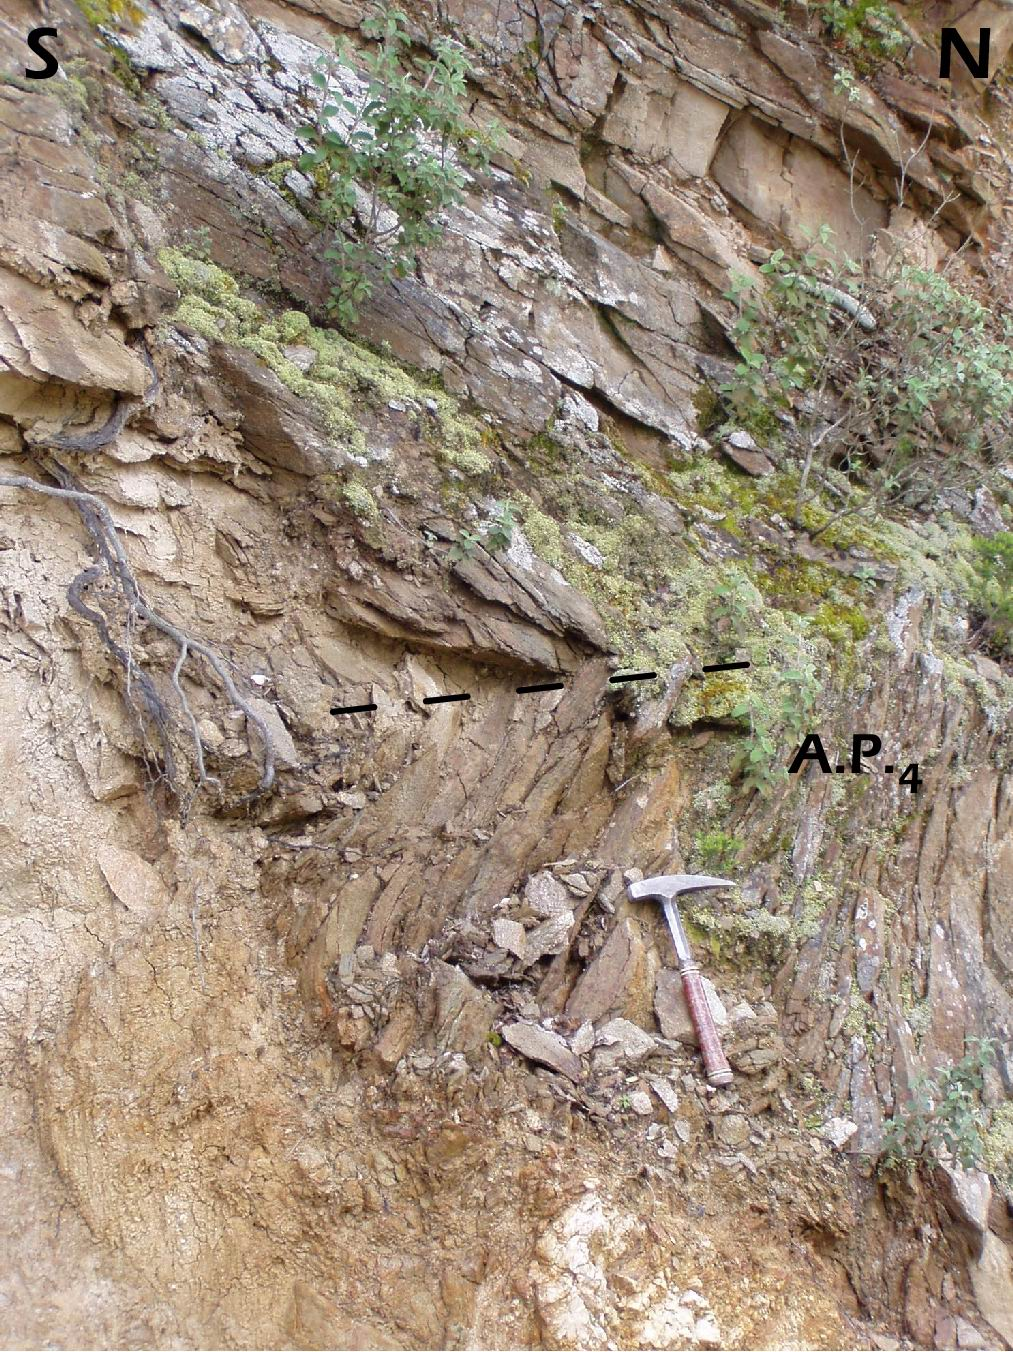
Figure 9. Recumbent fold

Recumbent fold with shallowly dipping axial planes affecting the S2 mylonitic foliation in L-MGMC, SW Gallura.
This method uses porphyroblasts that have overgrown the external shear fabric and contain rotated relict of that fabric as an internal foliation. The internal foliation, represented by helicitic inclusion trails, should be a syn-tectonic foliation. In these rigid porphyroblasts the degree of rotation is measured directly from the orientation of the internal fabric relative to the external foliation. For steady-state monoclinic deformation the amount of internal rotation is a function of pure shear, simple shear, vorticity parameter Wm as well as on the initial orientation of the porphyroblast long axes relative to the shear direction. The vorticity number could be inferred from plots of the orientation of the long axes of each porphyroblast versus the orientation of its internal foliation. This method has been applied by Iacopini, (2005), in the NW transect within rotated garnet with helicitic inclusion continuously linked to the D2 principal schistosity. The Wm value ranges from south to north from 0.60-0.70 to 0.40-0.50, respectively, and it reasonably fits with other values obtained from Method 1.
The two methods indicate that in the eastern section, a pure shear component varies between 45-65% of the total recorded deformation, whereas in the NW regions the pure shear component ranges from 58% to 70 % (from south to north) of the recorded deformation. These broad estimations of the vorticity flow indicate that a significant amount of pure shear, varying in space, was linked to the D2 transpressive event. The development of closed to isoclinal folds with shortening increasing to the north is in agreement with vorticity estimation. Assuming a volume constant deformation, the amount of shortening induced by this event seems to have been accommodated and redistributed partly by a lateral horizontal extrusion as shown by the sub-horizontal stretching lineation observed all over northern Nurra and partly by a vertical extrusion in the northern HGMC (northern Asinara Island), where the stretching lineations are down dip (Carosi et al., 2004).