Results and Conclusions
Bulk Analysis
Geometry
To obtain information about the overall geometry, lengths have been measured
at a comparable shortening of around 21%. The measured lengths according
to Figure 5 are:
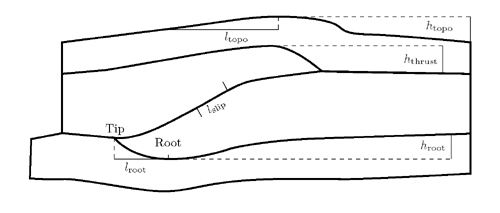
ltopo the half width at half maximum of the topography,
htopo height of the topography,
hroot vertical distance between root and uppermost interface between lower crust and upper mantle (root depth),
lroot horizontal distance between tip of underthrusting slab and root (root width),
hthrust vertical distance between top of lower crust and lowermost interface between the upper and lower crust (overthrusting height),
lslip displacement along the thrust in the thrust experiments,
Figure 5. Description of geometrical measurements. The lengths indicated were measured for the six experiments presented, and compared in Figure 6. (Click for enlargement)
The measured lengths and some ratios thereof are presented in Figure 6. Since the two blocks of the "lower crust" deform internally, the above properties cannot be identified with common properties of thrusts such as "throw" and "heave" as defined by Twiss & Moores (1992).
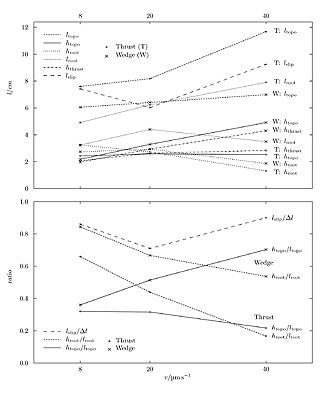 |
| Figure 6. Lengths measured according to Figure 5, and some ratios thereof against convergence rate. Thrust and wedge experiments differ in the point style, corresponding lengths are assigned the same line style. The net slip only applies to the thrust experiments. In the lower plot, it has been normalized by the bulk shortening. (Click for enlargement) |
In both the wedge and the thrust experiments, the wavelength of the topography increased with the convergence velocity. The height of the topography was more or less similar in all the thrust experiments, and increased with convergence rate in the wedge experiments. The overthrusting height behaved similarly. Therefore, all vertical movement along the thrust was transmitted to the surface. However, as no erosion or sedimentation was modelled, the height of the topography (up to 15 km) is grossly exaggerated in these experiments. The steepness of the topography htopo/ltopo in both cases did not vary much around 40%. The wedge experiments tended to have steeper topographies, steepness increasing with the convergence velocity.
The behaviour of the root could be correlated with the convergence velocity more easily in the wedge experiments than in the thrust experiments. In the former, the root depth decreased with increasing velocity. This trend was less clear in the thrust experiments. The root length in the wedge experiments increased with higher velocity, which could not be observed in the thrust experiments. Nevertheless, the root steepness hroot=lroot decreased with increasing convergence rate in both experiment types, the trend being clearer in the wedge experiments.
The net slip shows no consistent behaviour towards the convergence velocity. Values between 6 and 9 cm correspond to 70-85% of the bulk shortening. As the thrust steepened from the initial 20° to 25° consistently in all thrust experiments, heave and throw are 90% and 42% of the net slip in these experiments.
Temperatures
The bulk temperatures measured in the experiments provide concise information
about the stability of the overall temperatures (Figure 7). The preheat
phase ensures a reasonably stable temperature field. Usually, 20 hours
are sufficient for the temperatures to reach an equilibrium. During the
deformation phase, the temperatures at the moving sensors remained constant
within 1°C.
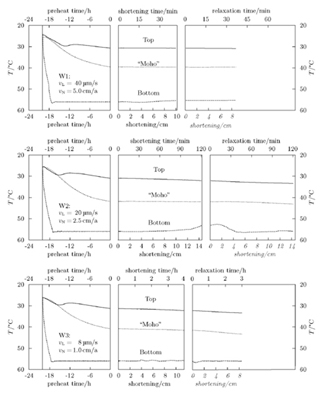 |
| Figure 7. Temperature time series. The time series are split into the preheat, deformation and relaxation phases. In each graph, the temperature increases downwards, as in the model. For the preheat phase, the time scale was 24 hours. For the deformation phase, the temperature is plotted against shortening of the model. The length scale is identical for all plots. For the relaxation phase, time is converted to length using the deformation velocity. The "shortening" in the relaxation phase is indicated by italics. In fact, the model remains its length. (Click for enlargement) |
The temperature at the base of the model in some experiments fell by up to 5°C towards the end of the deformation. This is due to the "cold" tip of the footwall block being pushed downwards towards the stationary base sensor, displacing the "upper mantle". During the relaxation phase, the heating unit counterbalanced this disequilibrium within about 30 minutes.
Stresses
At the very start of each experiment, a pronounced peak in the bulk stress
can be observed (Figure 8) during the first few minutes of the deformation.
This peak was present in all experiments except T2. In that experiment,
problems concerning the force transducer distorted the data. The rise
time of these peaks was about twice their falling time, the height increasing
with the convergence rate. This indicates a sticking phenomenon: Resistance
must be overcome before steady-state deformation can occur.
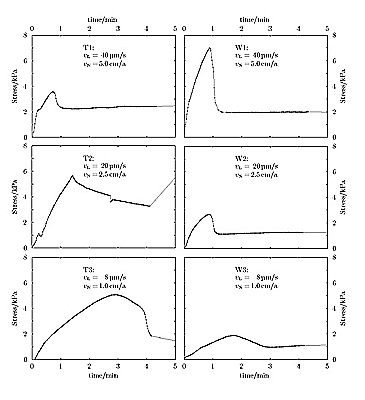 |
| Figure 8. Initial stress peak recorded during the first few minutes of deformation. The peaks are due to initial sticking of the deformation plates. The data for experiment T2 also give evidence for a peak, although the data is distorted due to problems concerning the force transducer. (Click for enlargement) |
After the initial sticking was overcome, the bulk stresses showed a further rise to about 1.8 kPa until about 4 cm (10 %) of shortening (Figure 9). The following decrease of the bulk stress is slowest or even non-existent in the fastest experiments. In these models, the isostatic equilibration was not as effective as in the other experiments. In experiment W1, no material flux underneath the pistons occurred. The slower experiments showed pronounced (T3 and W2) or even sharp (T2 and W3) decreases. Here, the weak material at the model base gave way quickly, reducing the apparent stress at the piston. Note that material behind the piston can lower the stress acting on the plate, even if the material level in the model does not change notably. Nevertheless, this correction (integration of the lithostatic pressure over the model height) would be less than 500 Pa, and variations after an initial phase of some minutes are small.
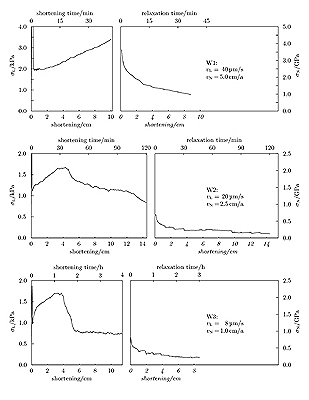 |
| Figure 9. Bulk stress time series. The stress is plotted against the model shortening. For the relaxation phase, the time is converted to length using the deformation velocity (cf. Figure 7). The stress scales are given for the laboratory and for nature. Note the different stress scale for the fast experiment. (Click for enlargement) |
This process of rather sudden isostatic equilibration is an artefact of the experiments. The material flux under the pistons strongly depended on the temperature of the model base and therefore on the exact positioning of the lower temperature sensor. However, collapse processes have been predicted for orogenes by Dewey (1988), who even suggests the reversal of the overall stresses from horizontally compressive to extensive regimes due to gravitative effects. The latter processes have not been modelled in the experiments presented here, the observation was finished with the end of a relaxation phase about as long as the deformation required.
During the relaxation, the bulk stress decreased almost exponentially. The characteristic time for the first decrease was around 100 s, the overall characteristic time was on the order of some 10 minutes. In all experiments, a residual stress of ca. 100 Pa remained. This should not occur in a Newtonian material, and indicates that the waxes used in the experiments show non-Newtonian behaviour. A stress exponent larger than one would result in such a "threshold-stress".
During the relaxation, the stress occasionally fell in "steps". After abrupt decreases, the stress level remained constant for some minutes, or even rose again before the next decrease. This indicates some sort of "stick-slip" movement, and is probably due to the isostatic equilibration. The molten material leaving the model domain underneath the pistons did not move continuously, but rather sporadically.