Detailed Analysis
As described in Section 3, deformation analysis could be done for each of the available triangles. The figures of the results are supplied as Quicktime movies for the six experiments listed in Table 6.
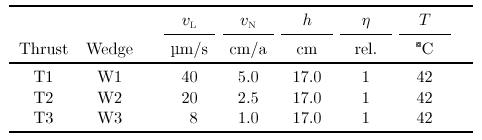 |
| Table 6. Experiments described utilising wax. Three experiments were done using a simple megathrust geometry, three more incorporating a weak wedge instead of the thrust. Configuration, convergence velocity (laboratory and natural), initial model thickness, relative viscosity and the resulting mean temperature of the wax are given for each experiment (ID used in text). Experiments T1-T3 and W1-W3 allow to compare the effect of the convergence rate, experiments C1-C3 were performed to examine the influence of the absolute scaling. Experiment C1 is a repetition of experiment T2. C2 is a "small, quick and warm" experiment, representing the same scenario as C3, with the length scale reduced by 1.7. |
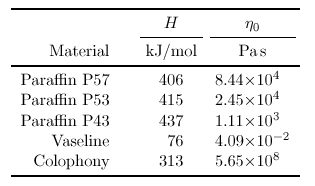 |
| Table 7. Properties of ductile materials used: Activation energy H and the viscosity η0 at the reference temperature 50§C. These parameters allow the viscosity to be obtained from the temperature using equation 2.15. The values for P53 are based on interpolation. |
| Dilatation | ||
 |
 |
 |
 |
 |
 |
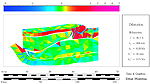
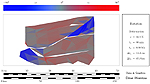
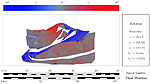
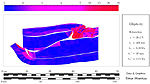
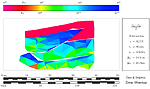
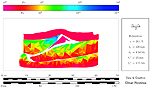
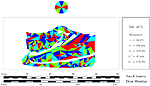
The distribution of the dilatation shows a patchwork-like chaotic pattern.
In all experiments, no more than about 2% of the triangles flip (Δ<-1)
at most 5% have dilatations smaller than -0.6. Large positive dilatations
(Δ>2) are similarly rare.
If large dilatations occurred in two adjacent triangles with opposite signs, this was probably an artefact of digitizing: If a marker position is digitized incorrectly, the areas of adjacent triangles change. Large dilatations were measured in the brittle part of the model, where the contrast of differently-coloured materials was used as markers. This contrast decreased during deformation, inhibiting accurate digitizing.
The large negative dilatations (-1<Δ<0, blueish colours) occurred at the base of the upper mantle (e. g. Figures [w1.dil.mov] or [t1.dil.mov]) or in the lower left part of the hanging wall block of the lower crust (all experiments). These were areas where partial melting could be observed.
The analogue model presented here was not designed to incorporate partial melting. The effects showing dilatation (regardless whether due to movement of melt or due to digitisation errors) pose limitations for the data analysis. Nevertheless, neither the differential stresses nor the direction of the principal strain axes are influenced by the isotropic part of the stress (or, indeed the strain) tensor. The size of the strain ellipses as well as the ellipticity are altered by an isotropic part of the strain tensor and have to be used with care in the respective areas.
In experiments with a wedge, the wedge always contained triangles with rather large dilatations, probably resulting from movement of the material in the line of view (see e. g. [w1.dil.mov]).
| Rotation | ||
 |
 |
 |
 |
 |
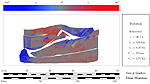 |
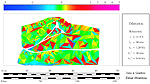
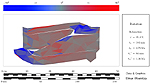
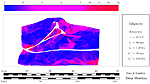
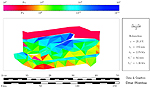
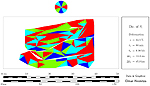
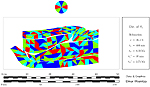
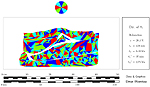
All the experiments have some features of the rotational shear in common.
Four areas show dextral shear (see e. g. [t3.rot.mov] or [w2.rot.mov]):
- The left side of the upper mantle was rotated upwards because of the downward pushing slab of the lower crust.
- The part of the brittle upper crust around the prolongation of the thrust/wedge showed strong clockwise rotation, caused by brittle material falling down the evolving slope.
- The root of the footwall block of the lower crust was sheared by the compressive forces acting from the right while the movement of the tip was obstructed.
- The left-hand side of the footwall block was rotated clockwise slightly.
Although the deformation along the thrust was dextral, the internal deformation in the two blocks of the lower crust adjacent to the thrust appears to be sinistral (e. g. [t2.rot.mov]). This was an effect of the rotation of the whole block, which was caused by steepening of the thrust.
Weak sinistral deformation in the right hand side of the upper mantle was a consequence of material flux underneath the right-hand piston out of the model domain (e. g. [w1.rot.mov]). It can be observed that the sinistral rotation in the hanging wall block of the lower crust was stronger in the experiments incorporating a weak wedge instead of a simple thrust (compare e. g. Figures [t1.rot.mov] and [w1.rot.mov]). This effect dominated in the fast experiments, and was weaker in the slow runs. In the wedge, both dextral and sinistral shear were present.
| Ellipticity | ||
 |
 |
 |
 |
 |
 |
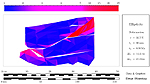
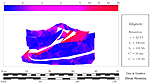
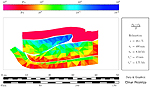
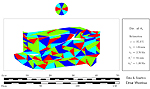
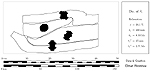
To analyse the strain in the experiments, strain ellipticities were plotted.
Together with the rotation data, the ellipticities allow to distinguish
between pure shear and simple shear. Rotation in areas with low ellipticity
is "rigid" body rotation, while ω≠0 in domains of significant
ellipticities indicates simple shear. Ellipticities larger than one in
the absence of rotation are a result of pure shear. This way of distinction
between simple shear and pure shear is complementary to the one given
by Passchier & Trouw (1996).
It should be noted that large ellipticities coincide with negative rotations (dextral shear), as can be seen in Figures [w2.rot.mov] and [w2.elt.mov]. These areas were the only ones with large ellipticities. Obviously, pure shear only played a minor role in the deformation.
Furthermore, the positive rotations were caused by whole-body rotation rather than by a simple-shear component of the strain. Therefore, the correlation between the rotation in the hanging wall block and the convergence rate as mentioned in the previous section is due to the lower internal deformation in fast experiments. The gravitative stresses are weaker than the viscous stresses in this case.
Stresses
For the analysis of the stresses, both the direction of the maximum principal
stress axis σ1 and the differential stress (σ1-σ2)/2
are given. Whereas the directions do not depend on the viscosity of the
materials, the differential stresses do. Therefore the latter are only
given in the ductile materials.
Differential
Stress
| Differential Stress | ||
 |
 |
 |
 |
 |
 |
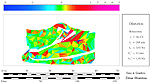
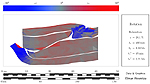
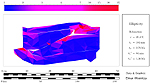
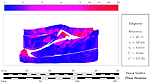
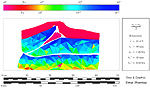
The differential stress partly coincided with the temperature distributions.
They were high in the upper parts of the two wax layers, and several orders
of magnitude less in the lower parts. This is due to the temperature dependent
rheology of the paraffin waxes: at higher temperature the viscosity is lower, and therefore at comparable
strain rates lower differential stresses occur.
The stress distribution reflects the temperature field as well as the convergence velocity. The ductile materials were harder in lower temperature domains, and the overall stress was higher in the experiments with high convergence velocities. Higher bulk deformation rates lead to larger stresses if the viscosities (temperatures) are similar. It could also be noted that after the deformation stopped, the stresses do not fall back to zero immediately, as was described in the bulk analysis and in Figure 9. Again, this observation suggests that the material does not show exact Newtonian behaviour. In a linear viscous medium, stresses should decrease towards zero, while non-Newtonian materials can sustain stresses up to a certain threshold (σ0 to reach a strain rate of ε10 as in equation 2.8 for n>>1).
Direction
of σ1
| Sigma | ||
 |
 |
 |
 |
 |
 |
| Ros | ||
 |
 |
 |
 |
 |
 |
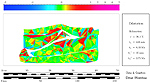
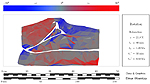
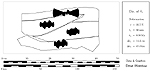
The distribution of the direction of σ1 in the upper crust shows a change from horizontal compressive stresses to vertical maximum stress or isotropic distribution. The distribution is not homogeneous: in the left part the direction points up-right, in the right half rather down-right (see e. g. [t2.sig.mov]).
In Figures [t1.sig.mov] and [w1.sig.mov] it can be seen that in the quick experiments, the directions in the hanging wall block of the lower crust change from being perpendicular to the thrust to a more or less isotropic distribution. Stress directions in the footwall block of the lower crust are rather isotropic, with a slight tendency to horizontal compressive regimes (e. g. [w3.dif.mov]). In the upper mantle the direction changes clearly from horizontal compression to horizontal extension (e. g. Figures [t2.dif.mov] or [w2.dif.mov]).
A common feature to all experiments is a flipping from compressive stresses in the upper mantle to extensive stresses at the end of the deformation. This reflects the "collapse" of the "orogen", the mantle was pushed away to the sides to make place for the deepening root of the orogen. The overall process of collapse has been proposed by Dewey (1988). For the Tibet Region, England & Molnar (1997) calculated extensional stresses in regions of high topography, leading to horizontally compressive regimes at the flanks of the Himalayas.
PT
t Paths
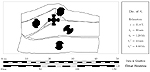
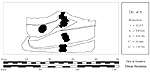
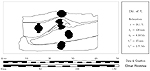
In Figure 10 the PTt paths for some material points are shown.
All paths are clockwise, i.e. an isothermal pressure increase is followed
by a rise of temperature and pressure. The starting conditions of the
paths correspond to their initial position in the model. The initial temperature
and pressure rise got steeper with increasing initial depth. The pressure
rose for points originating under the "foreland", due to accumulating
load above. For
the points originating in the upper crust, the ones originating in the
"hinterland" show no pressure increase. The temperature change
for these points was within 5°C. For the experiments including a relaxation
phase, the ends of the paths showed an isobaric temperature rise towards
the end.
 |
| Figure 10. PTt paths in the experiments. The points selected for analysis are shown in the inserts. To assign a path to the initial location of the point, depth is coded as colour, the lateral position as line style. Paths originating in the same depth (same colour) start in the same PT domain. The end of the deformation phase is marked by a black dot. The paths for points of the wedge are coloured black. The phase diagram for aluminosilicates is given for raw orientation only. It is based on the "work-around" for scaling of temperature (equation 2.13), and not on phase transitions in the analogue material. (Click for enlargement) |
The points originally in the upper crust of the hinterland start with an isobaric temperature decrease, followed only by an isobaric temperature increase in the relaxation phase. For the fast experiment including a wedge (W1), the uppermost points of the lower crust behaved similarly.
The clockwise form of the PTt paths has been described by England (1987) for diffuse continental deformation. The initial isobaric temperature decrease for the area described above has been predicted by England & Thompson (1984) and Thompson & England (1984) from numerical calculations for regions where the crust has been thickened by thrusting.
Natural rocks in orogenic scenarios are brought to the surface by erosion. Therefore, they show a geothermal decrease of temperature and pressure at the end of the PTt path. This end (a straight line to the "surface" conditions, 20°C, 0 GPa) must be added to the paths shown in Figure 10.